BTC/USDT
We left behind a week of bearish sentiment in the crypto market. At the beginning of the week, US President Donald Trump’s tariff threat against the European Union strengthened the FUD mood in the markets. Later in the week, Japan took a cautious stance towards the Bitcoin reserve. However, purchases by MicroStrategy and Hut 8 failed to keep the Bitcoin price at six-digit levels. Towards the end of the week, the fact that Tether has not yet been licensed under MICA regulations and the possibility of delisting in the European Union market put additional pressure on prices.
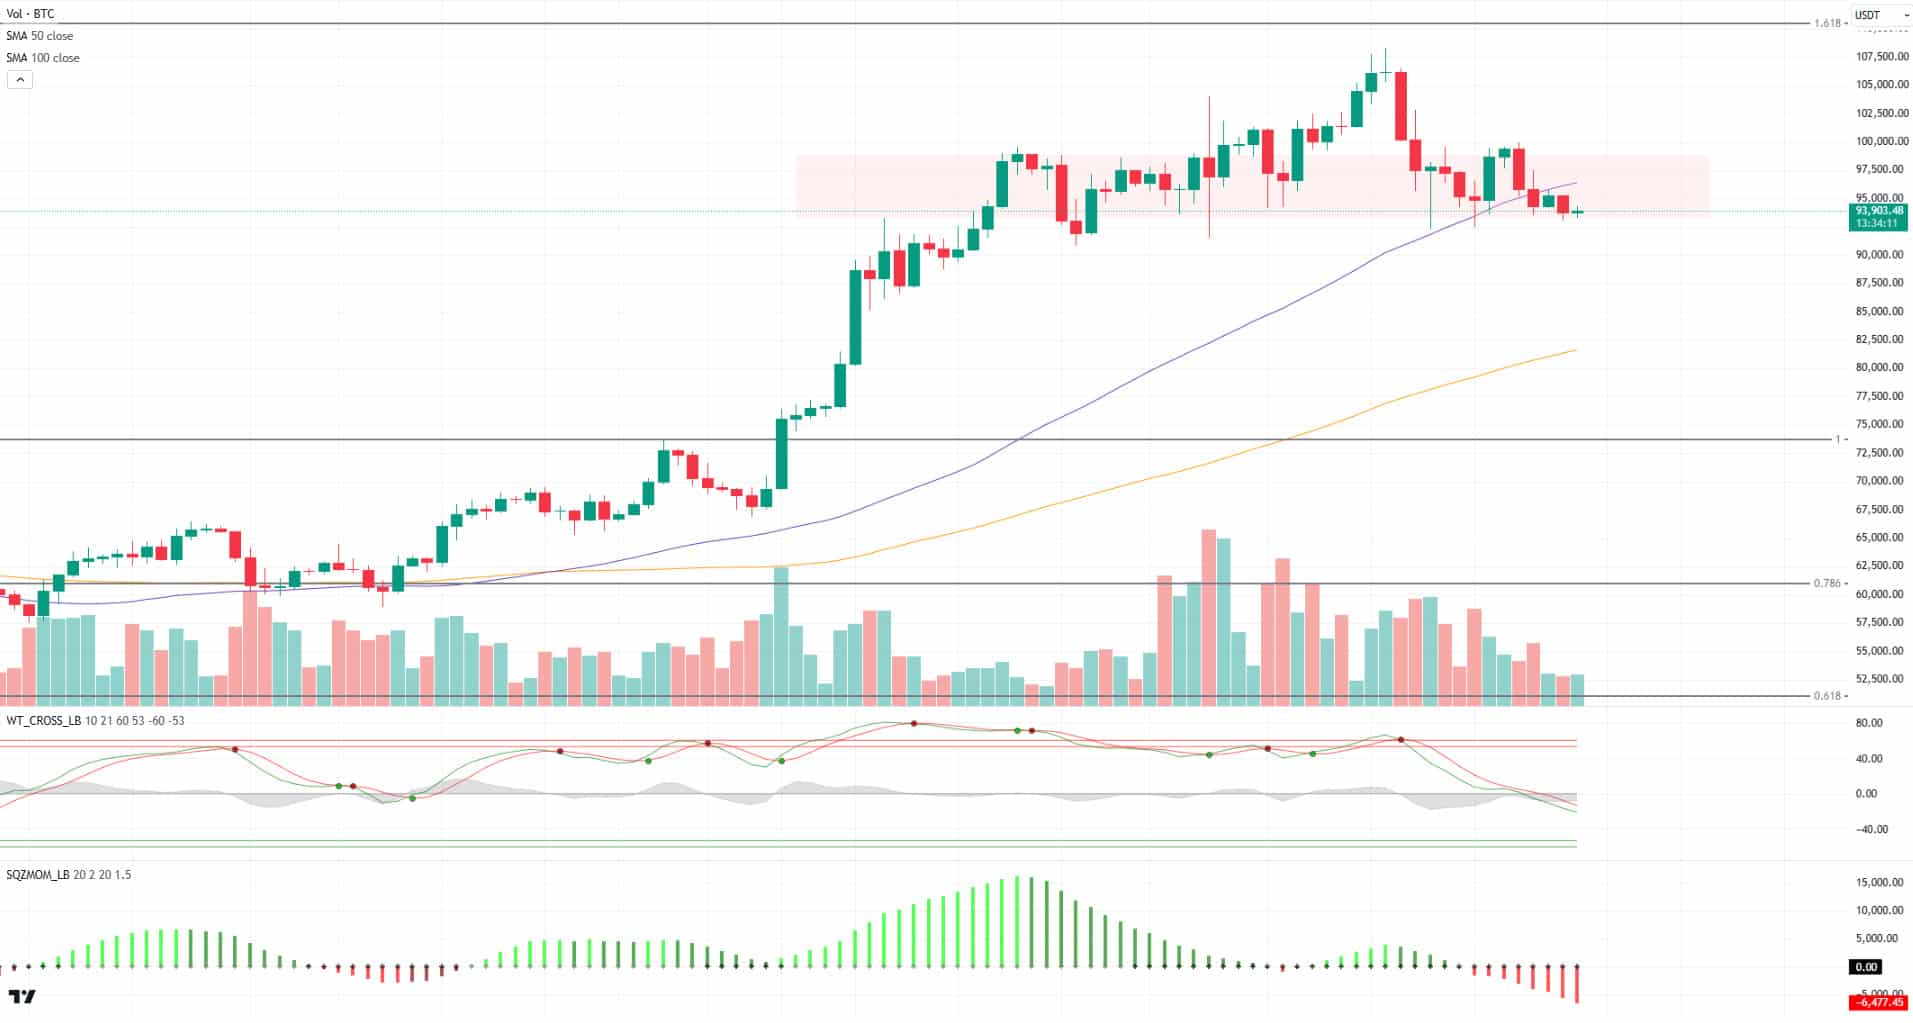
After all these developments, when we look at the long-term technical outlook, we see that the price has retreated to the level of 93,000 with the decline it experienced at the level of 108,000, the level where the price peaked. On a weekly basis, it is seen that there is a total decline of up to 10% with last week. In BTC, which is currently trading at 94,000, technical oscillators have reached the oversold zone after a long break and the momentum indicator has moved into the negative zone on the daily chart after nearly two months. BTC, which is in a healthy correction movement in the market, we can say that such corrections are effective in order to regain momentum in order to regain demand. If the price continues to decline, the 90,000 level is critical, but pricing above this level can be effective for regaining strength. The process related to FTX payments next week after the Christmas holiday may increase volatility in the BTC price, and with the increasing risk appetite, movements towards six-digit levels can be seen again.
Supports: 93,000 – 90,000 – 85,000
Resistances: 95,000 – 99,100 – 101,000
ETH/USDT
Ethereum gave signals of recovery by regaining critical support zones during the period when it fell from $ 4,000 to $ 3,100. While it is currently trading above the 3,400 level, both on-chain data and technical indicators supporting this recovery are noteworthy. In particular, the increase in activity on the network makes the growth dynamics in the Ethereum ecosystem more visible. Ethena and Usual, which are stable liquidity protocols, are among the projects that have attracted attention recently. In addition, the continuous increase in the amount of locked ETH in LRT and LST protocols such as Eigenlayer and Lido Finance increases the adoption rate and reliability of the Ethereum network. In particular, staked ETH assets are locked in more and more protocols, indicating that user activity on the network is expanding. On the NFT side, there has been a marked increase in demand for projects such as Doodles and Azuki, Ethereum’s OG NFT collections, following the launch of Pudgy Penguins. This shows that the NFT space in the Ethereum ecosystem is still vibrant and open to innovation. Moreover, the planned mainnet and token launches of next-generation networks such as Berachain, Monad, Abstract, and Eclipse in the first quarter of 2025 could further increase interest in Ethereum-based NFT collections. These developments are contributing to a significant increase in on-chain volumes on the network.
When we evaluate Ethereum’s price movements from a technical perspective, one of the most important indicators that stands out is Chaikin Money Flow (CMF). A positive mismatch in CMF on the daily timeframe indicates that buyers are dominant and the market is on a recovery trend. Moreover, the rise in CMF towards the zero level can be considered as an important metric that supports that the price is gaining upward momentum. However, the Relative Strength Index (RSI) and momentum indicators are also showing a positive outlook. The RSI is in an uptrend, indicating healthy support for price action, while momentum’s upward reaction suggests that short-term upside potential remains.
Ethereum’s holding above the 3,353 level is a critical threshold for the price to gain strength. If this level is maintained, bullish movements towards the 3,548 and 3,730 resistance zones can be expected. However, the area highlighted by the blue rectangle on the chart stands out as the most important resistance zone. Breaching this area could open the door for the price to form higher highs. On the other hand, the most important support level to watch out for in a downside scenario stands out as 3,016. In case of a decline below this level, selling pressure is likely to increase and the price is likely to fall to lower levels. In conclusion, Ethereum’s current price action is giving positive signals from both a technical and fundamental perspective. However, it is important to pay attention to critical support and resistance levels in order to implement strategies in a healthy way.
Supports: 3,353 – 3,216 – 3,016
Resistances: 3,548 – 3,730 – 4,008
XRP/USDT
The US Federal Reserve’s signal that it will keep interest rate cuts limited due to inflation hovering above target levels is one of the main factors putting pressure on XRP. This has led to a more pronounced negative sentiment across the market on XRP. With the recent declines, XRP’s loss of important support levels has turned investors’ attention to political developments in the US, especially the date when Trump will take over the presidency.
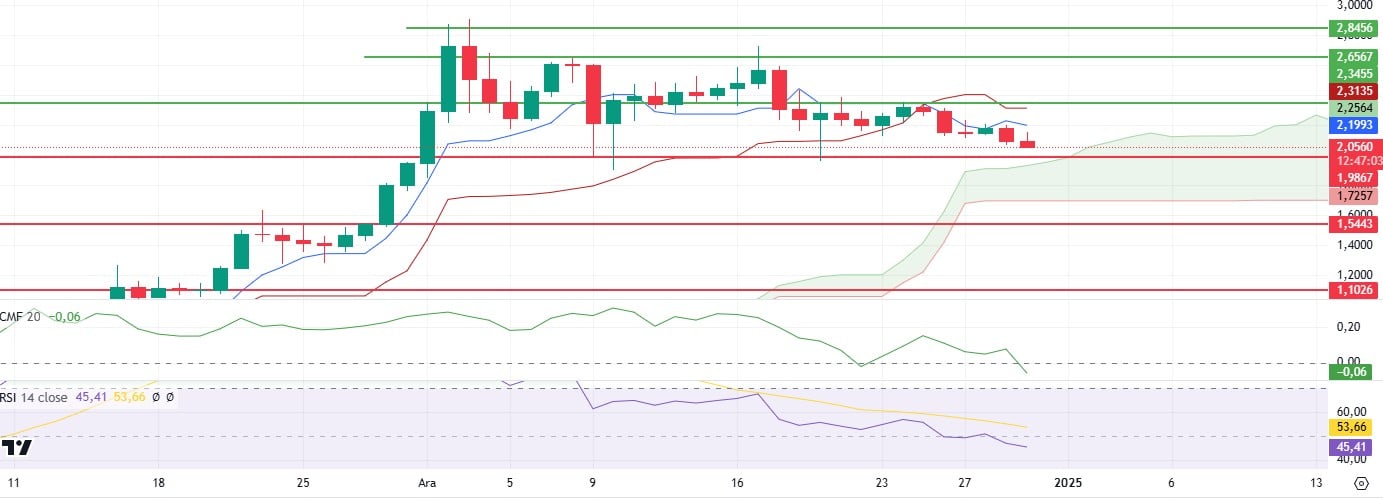
When XRP’s current price movements are analyzed, it is seen that technical indicators generally display a negative outlook. In particular, Chaikin Money Flow (CMF) fell sharply to below zero. Although this indicates an increase in selling pressure on the market, the positive mismatch between price and CMF is noteworthy. This mismatch may point to the possibility of a rebound in price movements in the short term. On the other hand, the recent sell signal on the Ichimoku indicator suggests that the downtrend continues. XRP price has retreated to the upper boundary of the kumo cloud. This region can be considered as a strong support level where the price may react. However, a downside break of this level could lead to a deeper decline. Relative Strength Index (RSI) continues its downward movement in line with the price. This weakness in the RSI suggests that buyers are hesitant to step in yet in the market.
The critical support level for XRP is located at 1.98. It seems likely that the price will pull back to this level and encounter buyers here. A reaction from this level could pave the way for XRP to make an upside move. However, daily closes below the 1.98 level could lead to increased selling pressure and push the price lower. In order for a positive outlook to prevail again, it is very important to exceed the 2.34 level. A close above this level could increase XRP’s potential to form new highs. In this case, upside targets may be shaped as higher resistance zones.
Supports: 1.9867 – 1.5443 – 1.1026
Resistances: 2.3455 – 2.6567 – 2.8456
SOL/USDT
Solana continues to remain in a downtrend. But things could change quickly in early 2025 as focus intensifies on the incoming pro-crypto US Trump administration. Bloomberg analysts recently suggested that a Solana ETF could be launched at some point next year, although the exact timing remains unclear due to some complex legal issues. Oncahin, SOL has captured 53% of global crypto users, surpassing all other blockchains, according to data from crypto analytics platform Token Terminal. In the weekly whale inflows, those who took advantage of the crypto market decline raised $1.7 million worth of SOL. As we approach the end of the year, many investors have chosen to take no action in the volatility associated with this transitional period. This could leave SOL vulnerable to further price declines unless significant market activity resumes
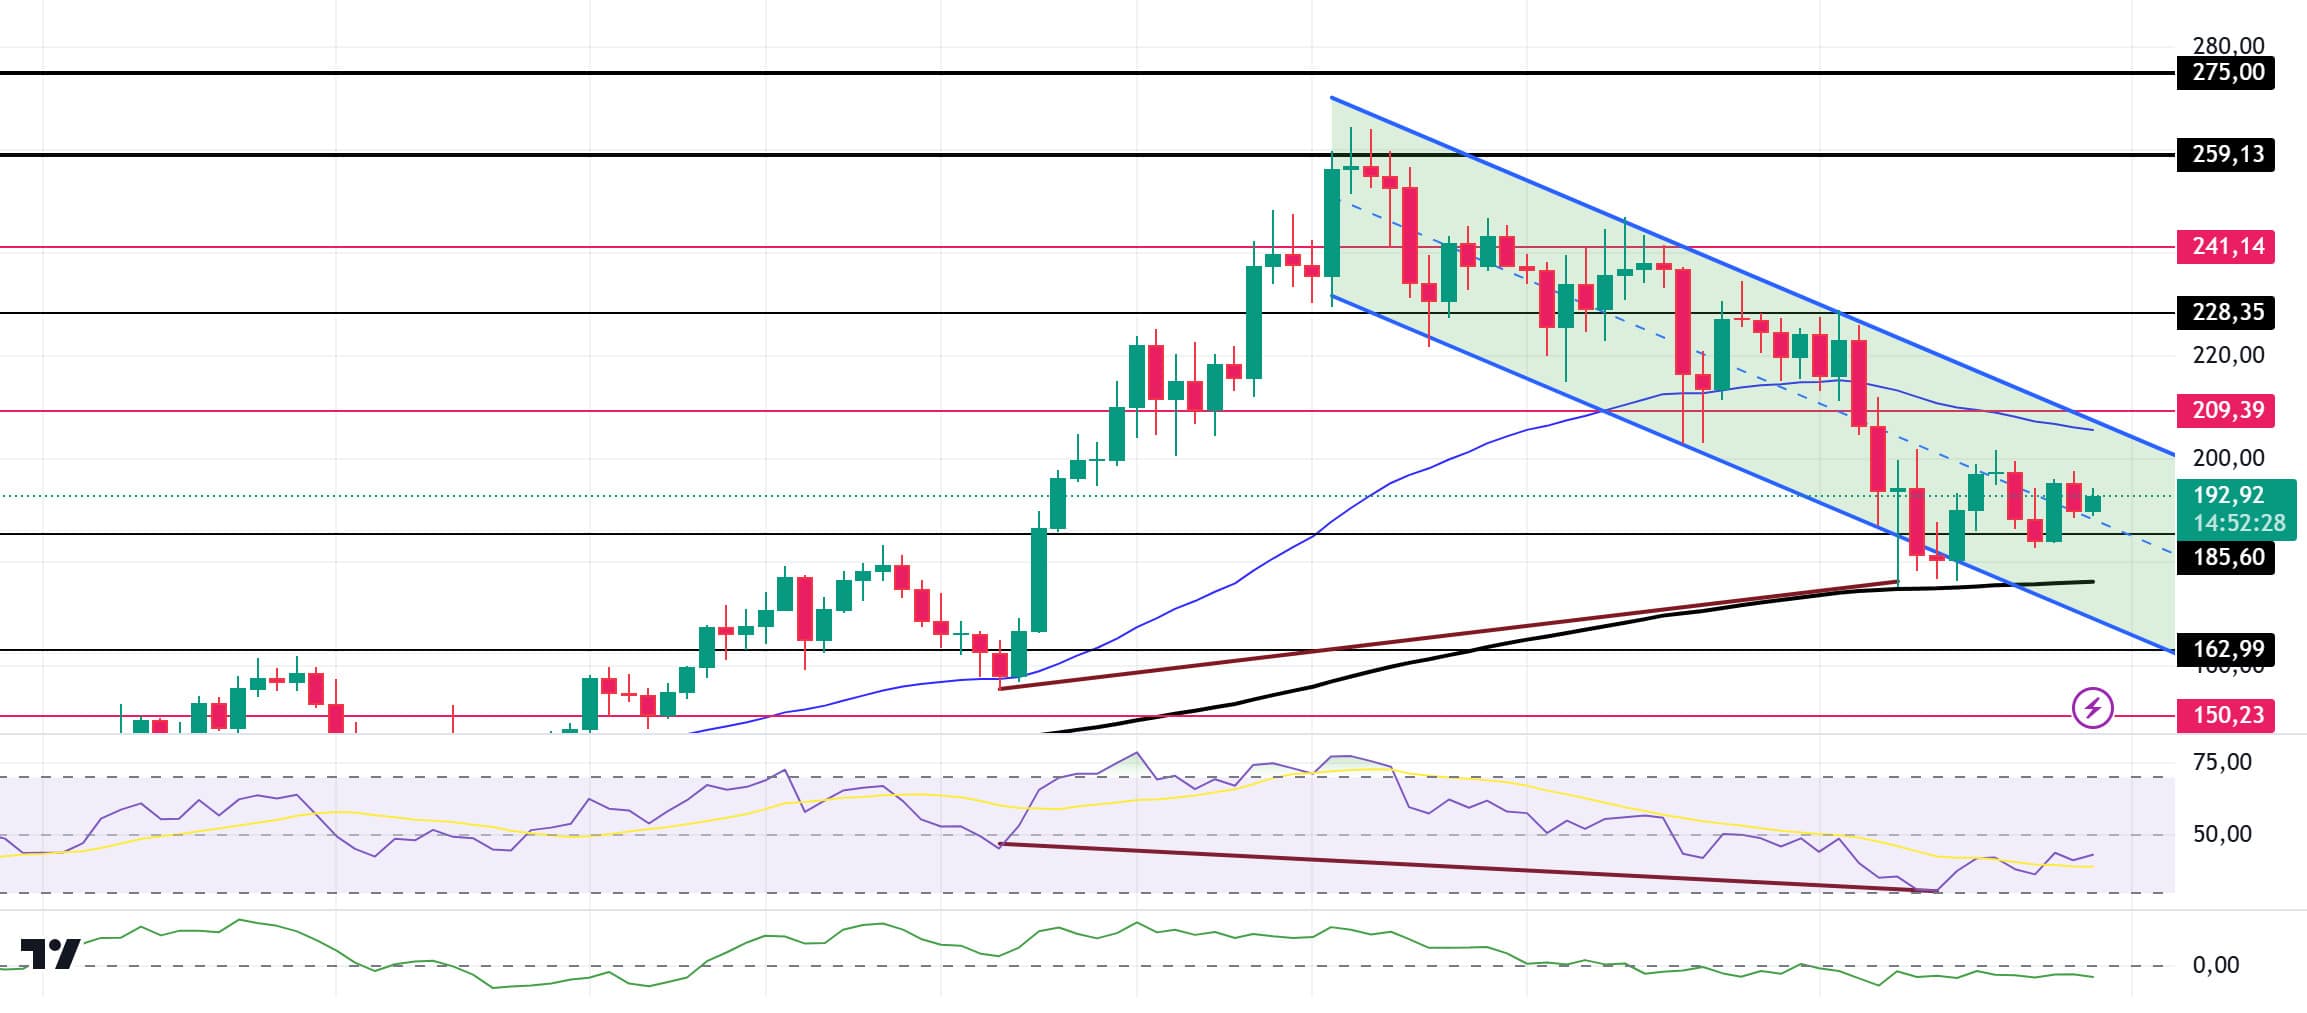
SOL, the 5th largest crypto by market capitalization, continued to exhibit a lackluster performance throughout the week, extending its month-long downward trajectory within a narrow price channel. Technically, it failed to break the strong resistance of 228.35 despite testing it 3 times and the decline deepened. Thus, the asset, which has been in a downtrend since November 22, received support from both the 200 EMA moving average and the bottom of the trend. The asset started to rise from here and started to be priced in the middle zone of the downtrend. These two supports mark this as a very strong support. On our daily chart, the 50 EMA (Blue Line) continues to be above the 200 EMA (Black Line). This shows that the trend is bullish in the medium term. Relative Strength Index (RSI) 14 is moving close to the neutral zone. At the same time, there is a bullish mismatch on the RSI and the chart. This could push the price higher. However, when we examine the Chaikin Money Flow (CMF)20 indicator, we see that there is money outflow. If the positive results in macroeconomic data and positive developments in the ecosystem continue, it may test the first major resistance level of 209.39. In case of negative macroeconomic data or negative news in the Solana ecosystem, the 162.99 level can be followed and a buying point can be determined
Supports: 185.60 – 162.99 – 150.23
Resistances: 209.39 – 228.35 – 241.14
DOGE/USDT
DOGE lost about 6.06% of its value last week. Speculation about the Dogecoin spot ETF filing was fueled by comments from Bloomberg senior ETF analyst Eric Balchunas. Balchunas suggested that the chances of a Dogecoin ETF filing could increase under the administration of President-elect Donald Trump. In its recent Dogecoin ecosystem report 2024, the Dogecoin Foundation hinted that the open-source software is now approaching the point where it is ready for adoption, presenting an opportunity for numerous for-profit businesses to take these tools and commercialize them to help bring Dogecoin payment solutions to a wider, non-technical audience. Oncahin data shows that it has accumulated a significant 250 million DOGE in the past week. Data from IntoTheBlock shows an increase in network activity. However, the data also reveals a large increase in the asset’s address activity. New addresses skyrocketed by 102.40%, while active addresses increased by 111.32% and addresses with zero balance experienced a significant increase of 155.46%. These figures show a significant increase in user engagement
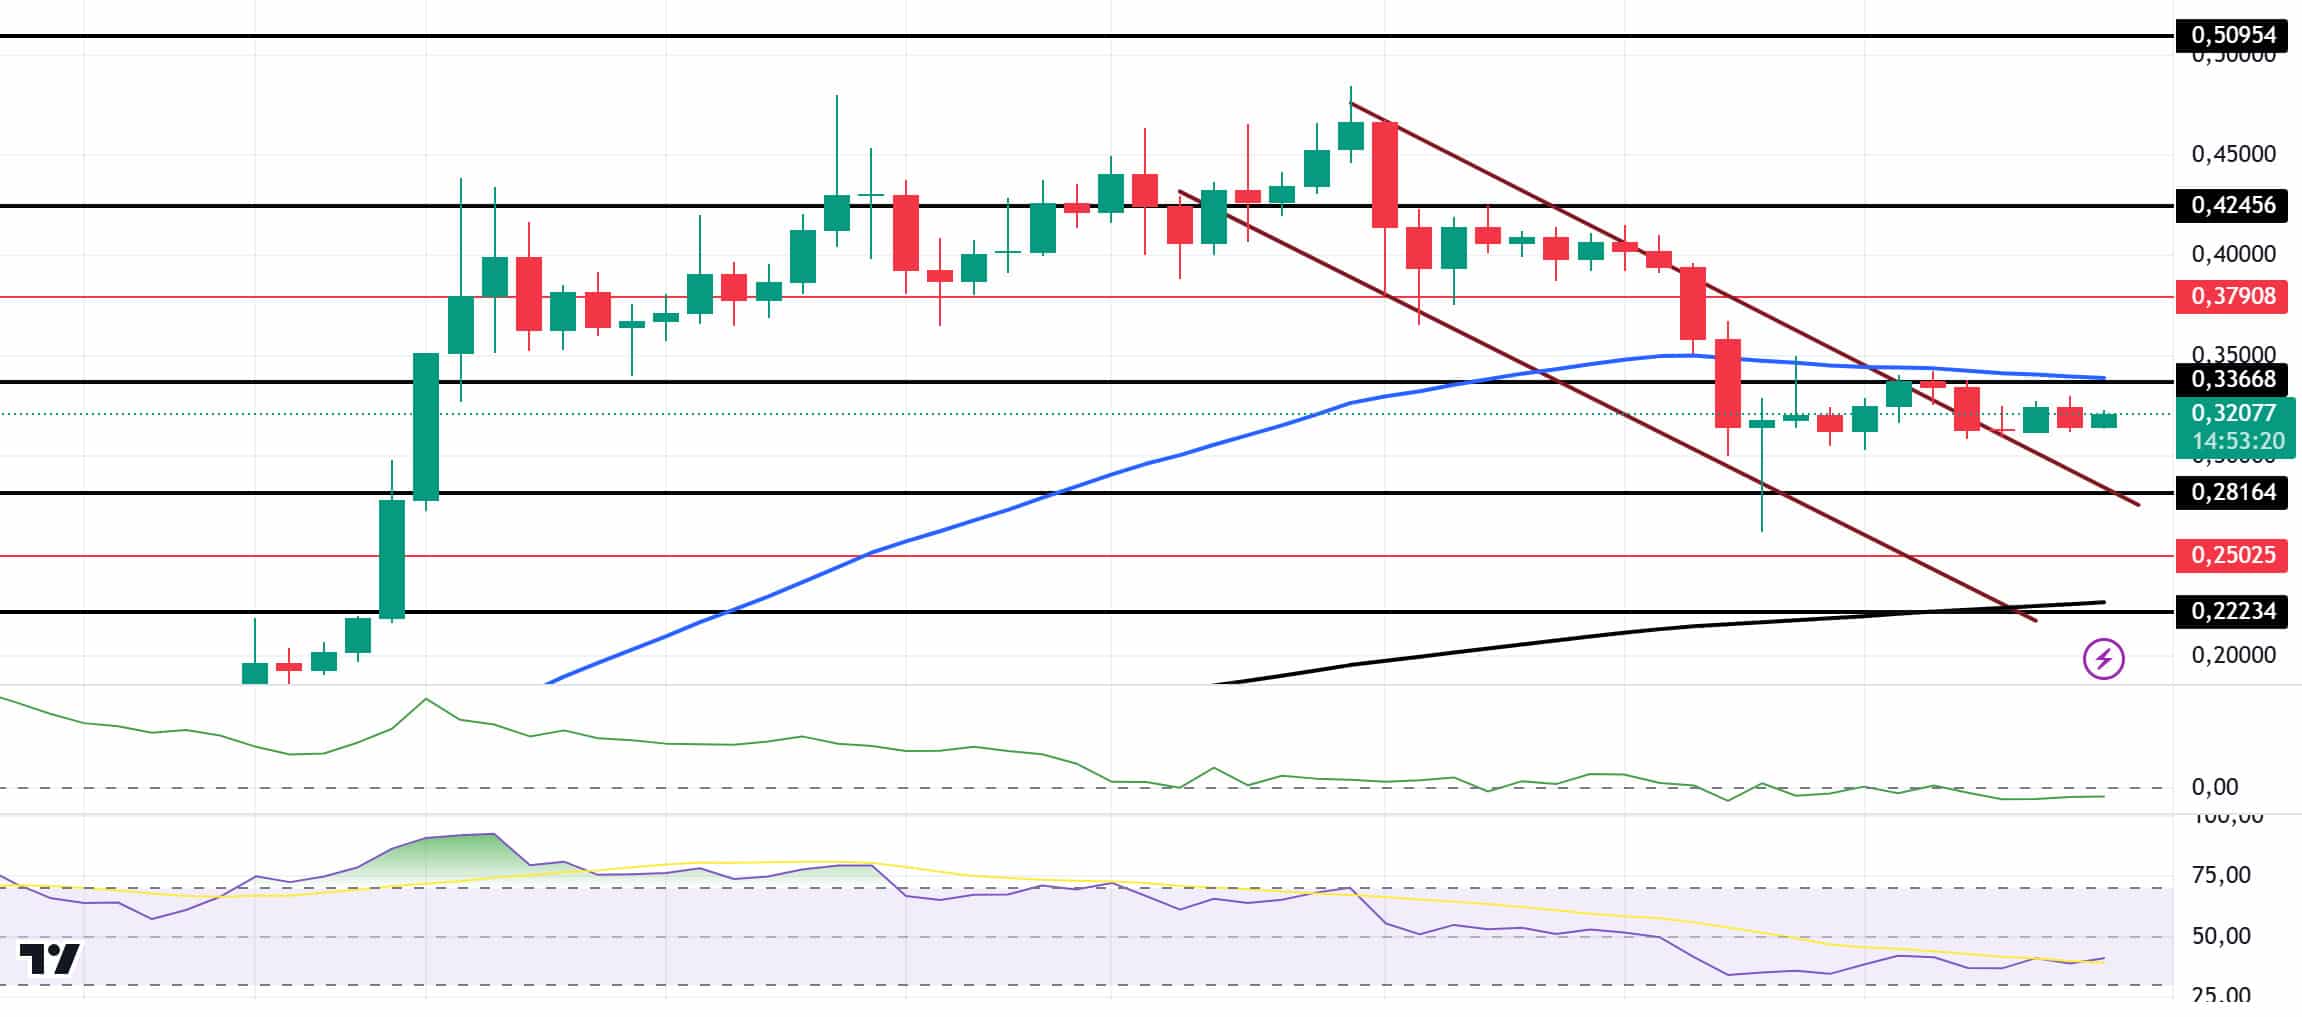
Looking at the daily chart, the 50 EMA (Blue Line) continues to remain above the 200 EMA (Black Line), indicating that the bull continues for the asset, but the difference between the two averages is 49.68%, increasing the possibility that the decline may continue. Also on our daily chart, the asset broke the downtrend by moving sideways while pricing at the mid-level of the downtrend since December 22. When we look at the Chaikin Money Flow (CMF)20 indicator, money inflows approached the neutral zone from negative. Relative Strength Index (RSI)14 was in the middle of the negative zone. In case of possible negative developments in macroeconomic conditions and ecosystem and retracements, 0.28164 can be followed as a strong support. In case of a continuation of the rises, 0.33668 should be followed as a strong resistance.
Supports: 0.28164 – 0.25025 – 0.22234
Resistances: 0.33668 – 0.37908 – 0.42456
TRX/USDT
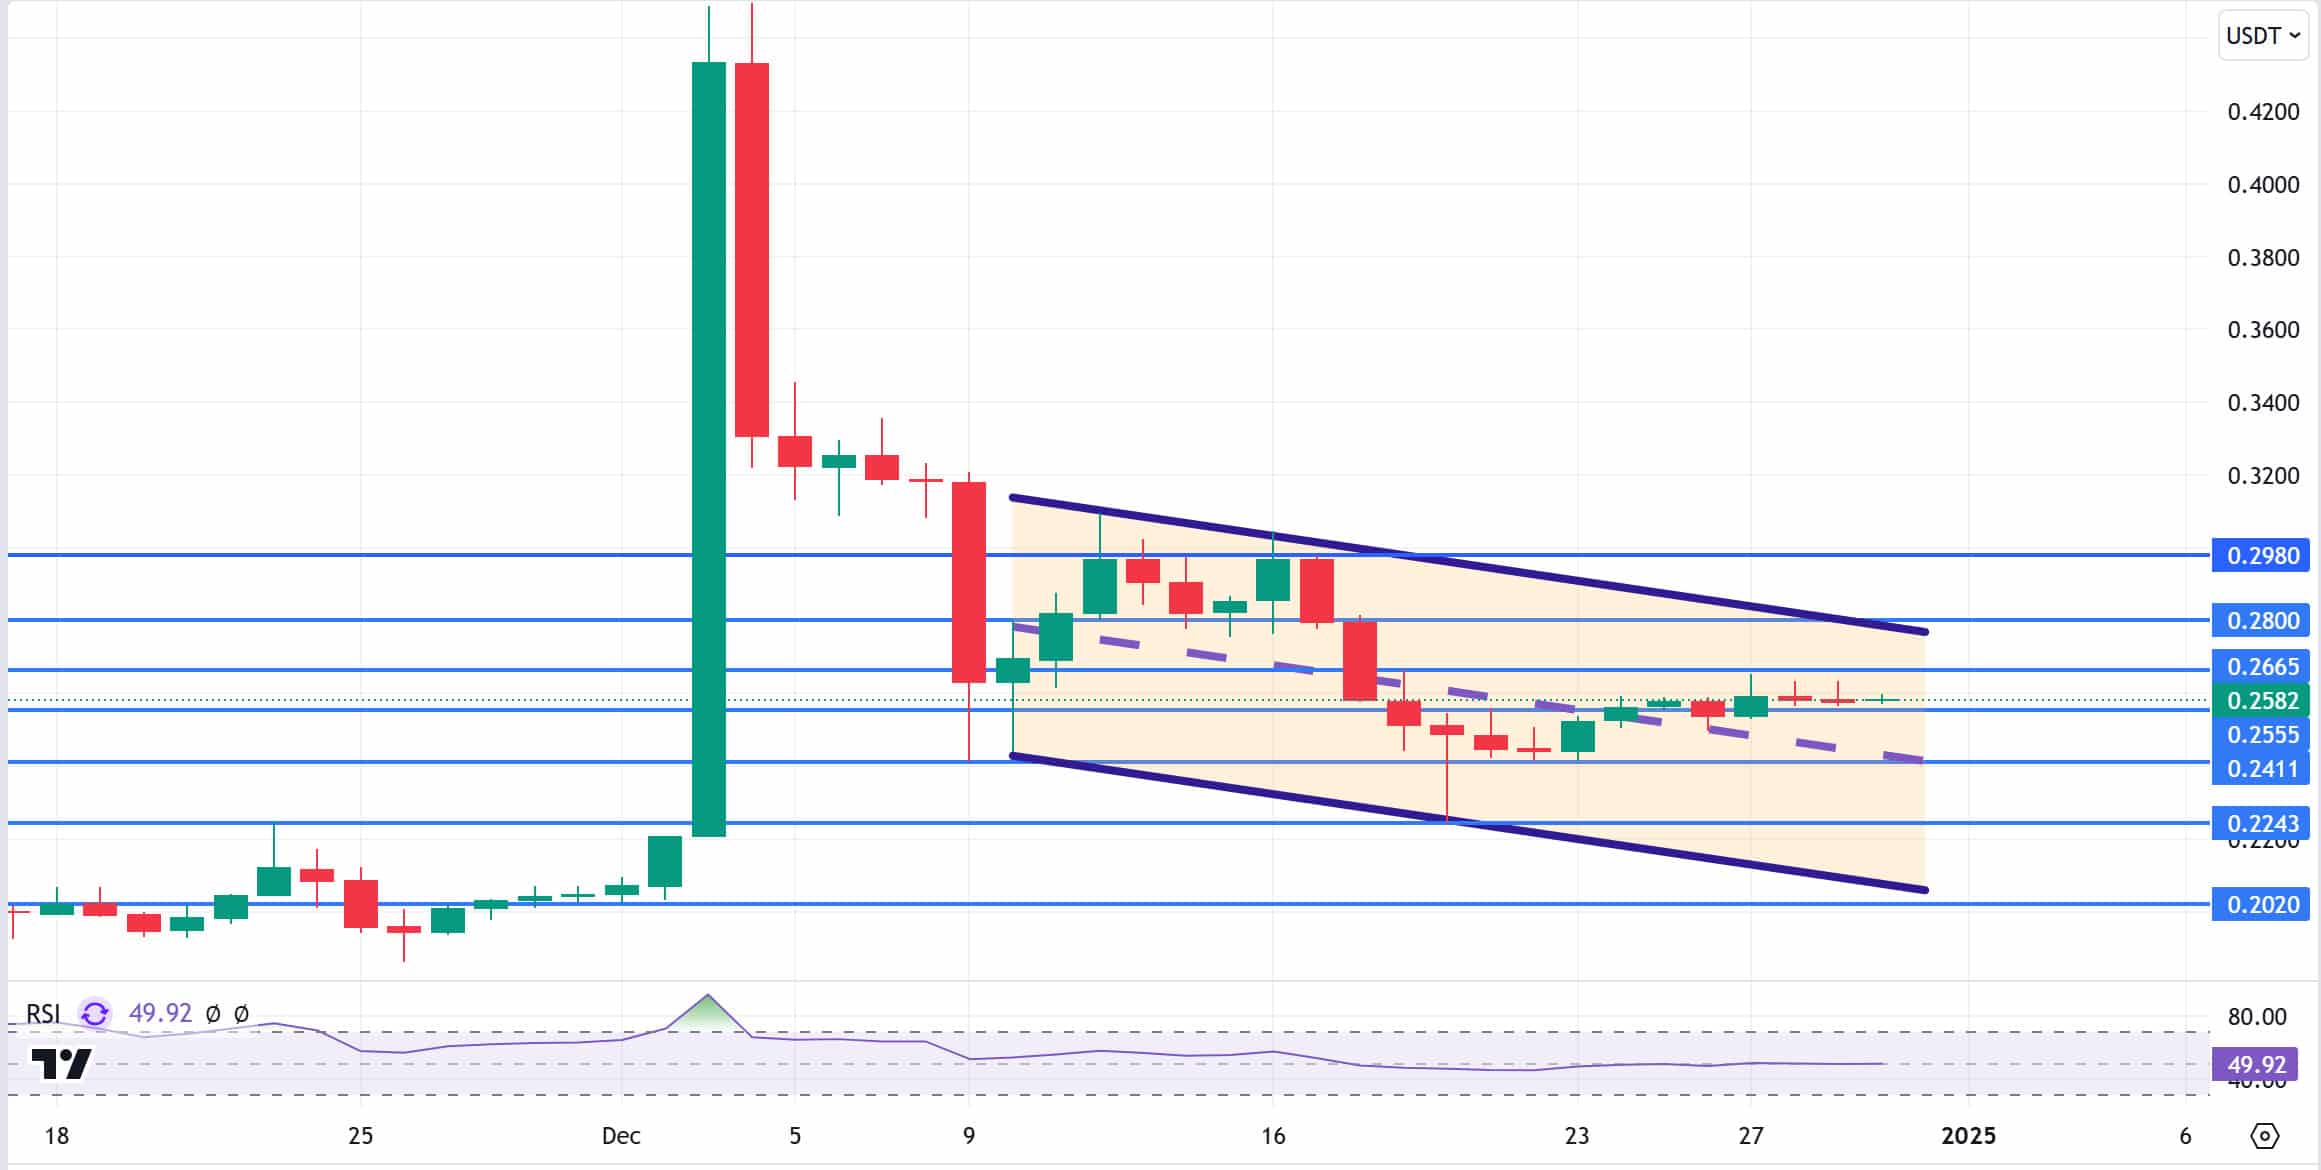
TRX, which started last week at 0.2442, rose about 5.5% during the week and closed the week at 0.2577. In this week, when we will enter the new year and there is little data that will affect the market, unemployment benefit applications, manufacturing purchasing managers index and ISM manufacturing purchasing managers index data will be announced on the US side. Especially if the unemployment benefits data is much lower than expected, it may be evaluated negatively by the market and create selling pressure.
TRX, which is currently trading at 0.2582, is moving towards the bearish channel middle band on the daily chart. With a Relative Strength Index value of 49, it can be expected to rise slightly from its current level and move towards the upper band of the bearish channel. In such a case, it may test the 0.2665 and 0.2800 resistances. If it cannot close above 0.2665 resistance on a daily basis, it may decline with the selling pressure that may occur and may want to move towards the lower band of the channel. In such a case, it may test 0.2411 and 0.2243 supports. As long as it stays above 0.2020 support on the daily chart, the bullish demand may continue. If this support is broken, selling pressure may increase.
Supports: 0.2555 – 0.2411 – 0.2243
Resistances: 0.2665 – 0.2800 – 0.2980
AVAX/USDT
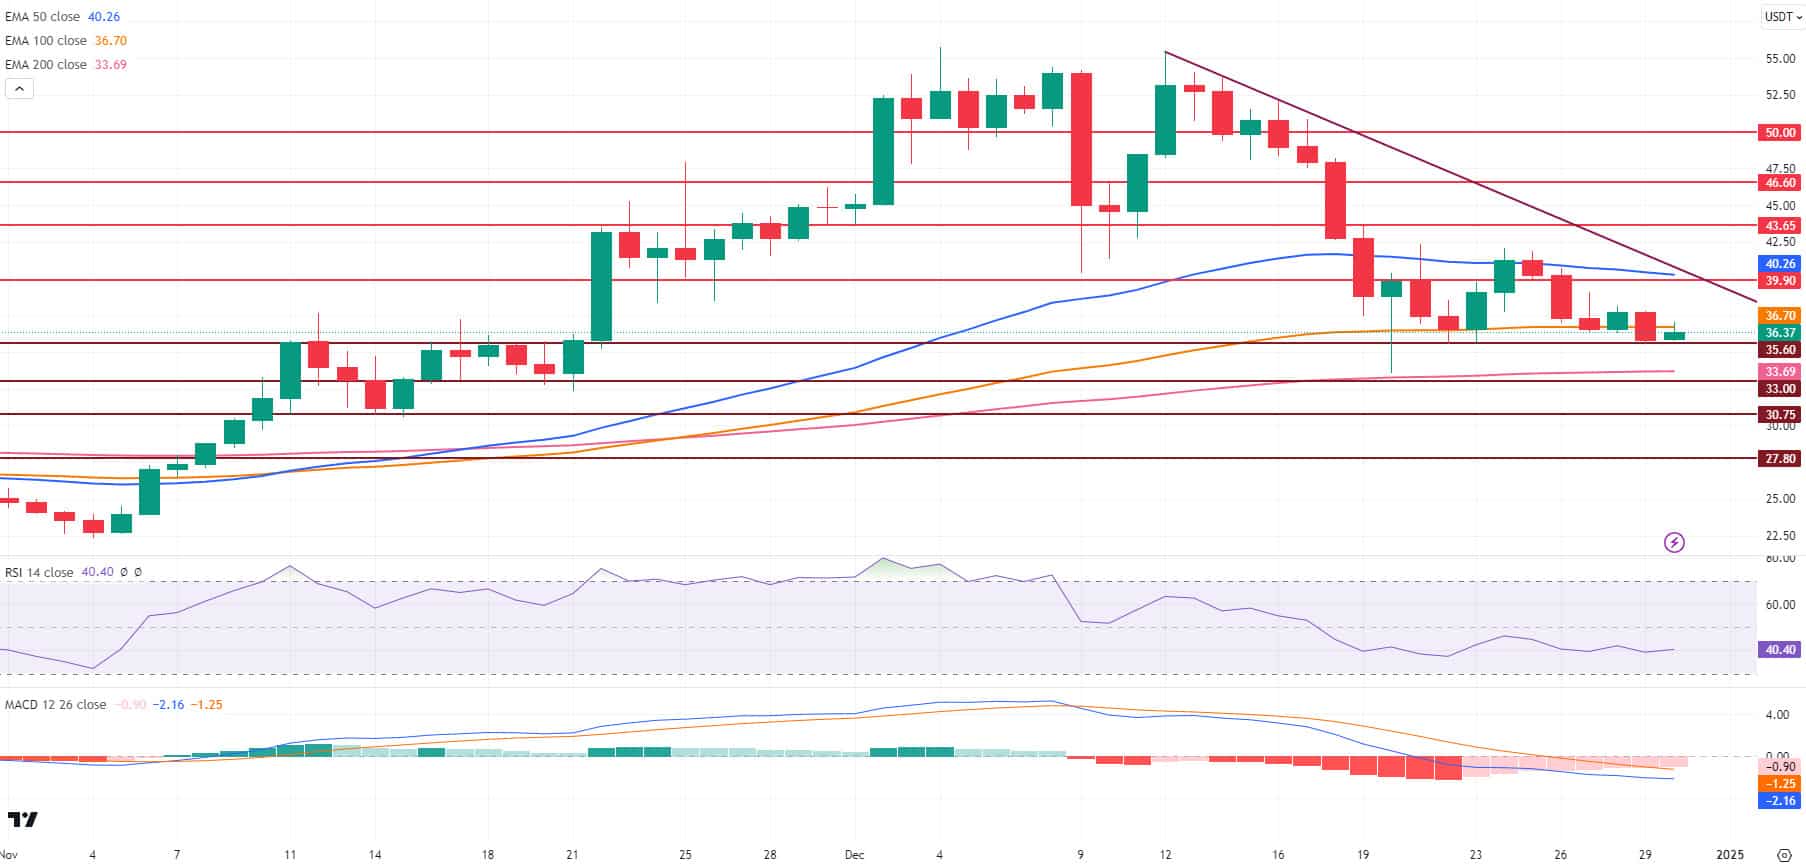
AVAX, which opened at 36.55 last week, rose as high as 42.03, but declined with the selling pressure and closed the week at 35.81. Although it started the new week with a rise, the downtrend in AVAX since December 12 continues to maintain its effect.
Moving Average Convergence/Divergence (MACD) data on AVAX remains in negative territory (-2.15), below the signal line (-1.25) as the downtrend continues. This confirms that selling pressure is still strong as the histogram shows weak momentum. Relative Strength Index (RSI 14) is showing weak momentum at 40. If AVAX tests the 35.60 support level and then the 200-period Exponential Moving Average (EMA200) and breaks it to the downside, the $30.75 and $27.80 levels can be targeted. This scenario is supported by the RSI falling further and the MACD remaining in negative territory. As the RSI indicator approaches the oversold zone of 30, there could be a possible reaction buying. If AVAX rises with possible buying, tests the EMA100 level and breaks it upwards, it may test the EMA50 and 39.90 resistance levels with its rise. If these resistance levels are broken, 43.65 and 46.60 levels can be targeted. RSI gaining strength and rising above 50 and MACD cutting the signal line upwards and rising towards the positive zone may strengthen the post-recovery rise in AVAX
(EMA50: Blue Line , EMA100: Orange Line , EMA200: Pink Line)
Supports: 35.60 – 33.00 – 30.75
Resistances: 39.90 – 43.65 – 46.60
SHIB/USDT
Shiba Inu (SHIB) token burn rate increased by 972% in the last 24 hours, resulting in 5.4 million tokens being removed from circulation. However, the 30% drop in network activity indicates that investor interest is waning. This indicates that the project is struggling to attract new funding and interest. On-chain activity, trading volume and community engagement need to revitalize to increase the token’s value and support long-term growth.
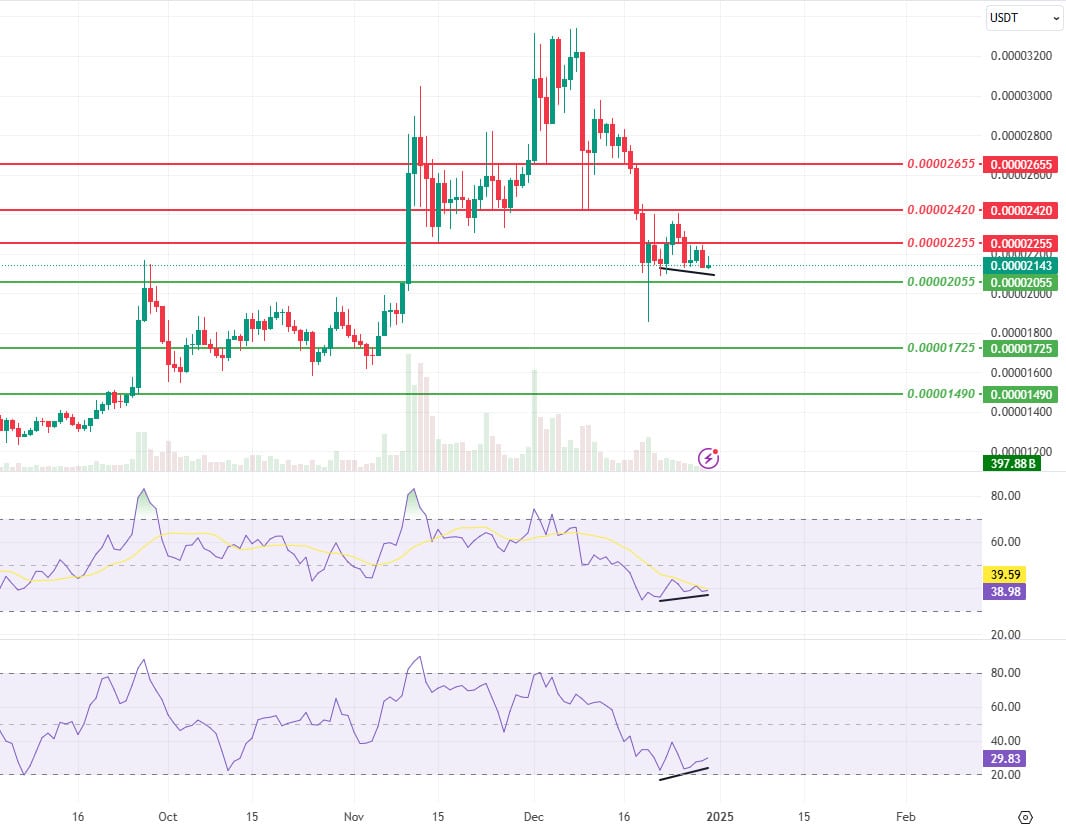
Technically, Shiba Inu (SHIB) moved towards 0.00002420 levels after the positive divergence in the On Balance Volume (OBV) oscillator, which we mentioned in our previous analysis, but it seems to have retreated without breaking the selling pressure at these levels. In the positive scenario, when we examine the Relative Strength Index (RSI) and Money Flow Index (MFI) oscillators, we can say that there are positive divergences (Black Lines) with the price. In this context, the price may move towards the 0.00002255 resistance level. If the price maintains above the 0.00002255 level, its next target may be 0.00002420 levels. On the other hand, if the selling pressure continues, if the price cannot maintain above the 0.00002055 support level, a retracement towards the next support level of 0.00001725 levels can be expected.
Supports: 0.00002055 – 0.00001725 – 0.00001490
Resistances: 0.00002255 – 0.00002420 – 0.00002655
LTC/USDT
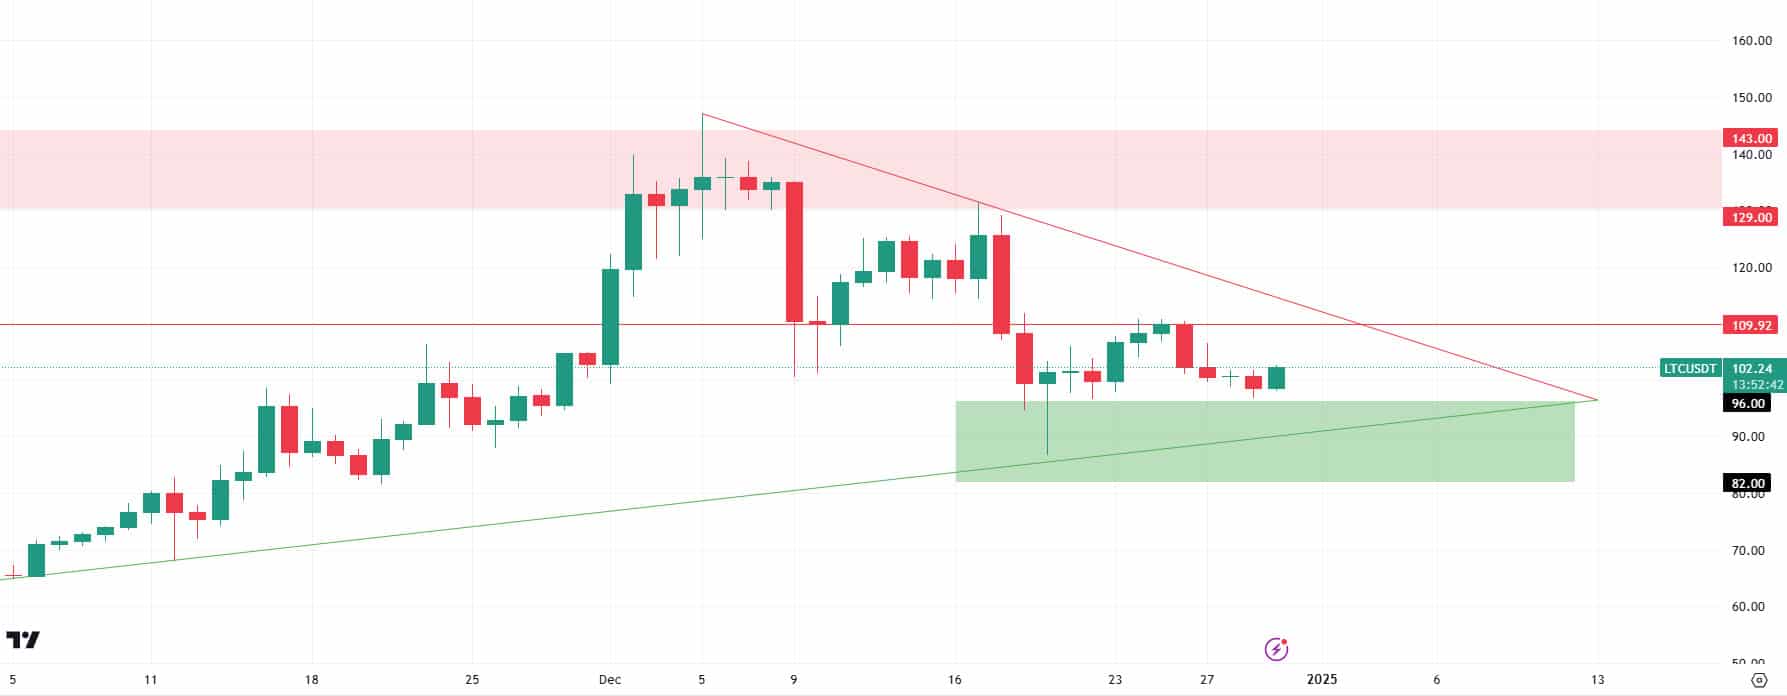
LTC, which lost 1.29% last week with a negative close, started the week at 98.51. LTC, whose ETF approval process is still pending, has not been able to differentiate by making big bullish waves like some altcoins and continues to move in line with the general movements of the crypto market. Last week, according to Arkham data, there was a total position of $128.03 million in futures trading on LTC, while this figure dropped to $102.15 million earlier this week. In Funding Rate ratios, negative values started to be seen in some exchanges. In this process, LTC has caught a negative series on a weekly basis, closing negative for the last three weeks.
When the daily chart of LTC is analyzed, if it continues its negative streak like the previous weeks, the first level to get a reaction is 96.00. This level may create a slight rebound effect as the top of the Fibonacci support area (green area). Trend support (green line), which can be considered as an important support in the continuation of the downward movement within the area, is currently at 90.45. In case the trend support is broken, the downward movement can be expected to continue at least to the lower part of the green zone. This level is at 82.00. In case of a recovery phase after last week’s pinpricks into the green zone, upside resistances can be expected to be tested. In this scenario, the first resistance level can be foreseen as horizontal intermediate resistance at 109.92. If the horizontal resistance is overcome, the next target will be the falling trend line. This resistance, which is currently at 115.00, could pave the way for a quick advance to the 129.00/143.00 area (red zone) if it is broken.
Supports: 96.00 -90.45- 82.00
Resistances: 109.92 – 115.00 – 129.00
LINK/USDT
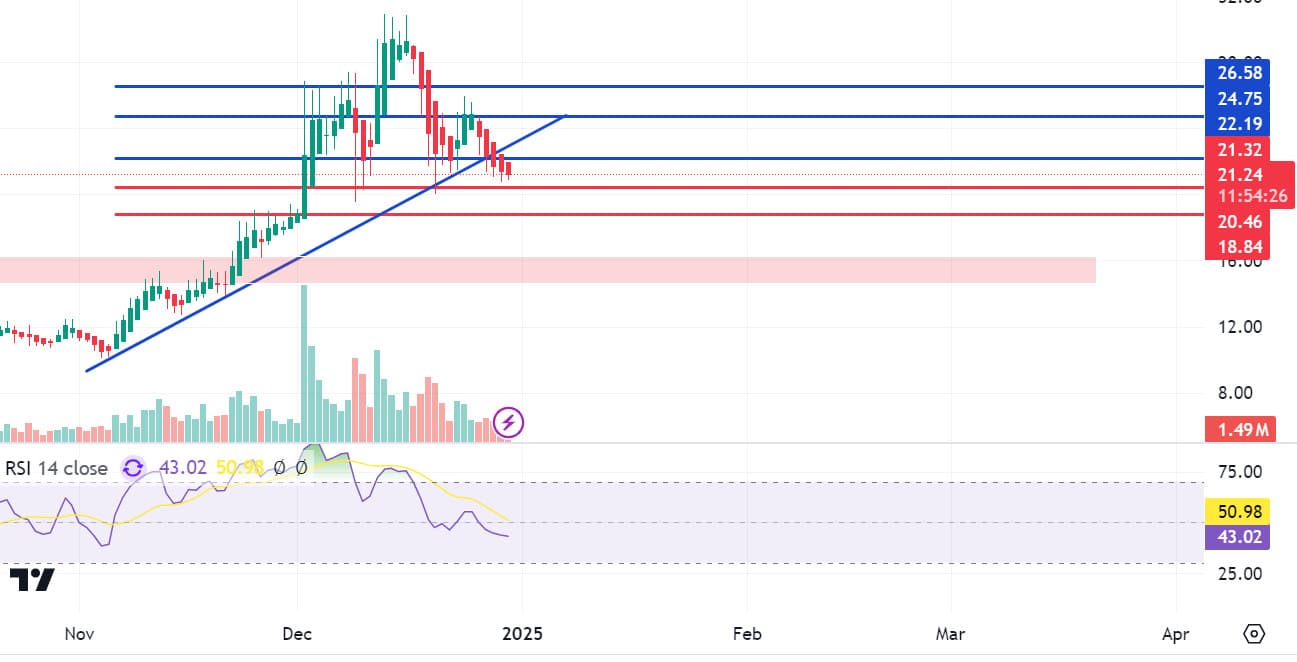
As of November 5, Chainlink (LINK), which gained bullish momentum as of November 5, fell below the 22.19 level after a rise of about 10 days, falling by up to 30%. This level also stood out as an important trend support. However, the fact that the price failed to hold in this region and continued its downward movement points to the formation of a technical “Shoulder to Shoulder” pattern. However, strategizing based on pattern targets alone can be quite risky. Therefore, monitoring the price’s critical turning points and taking macroeconomic data into account is of great importance for risk management.
With the downside break of the 22.19 level, the 20.46 level stands out as the first support point. Daily closes below this level and weak trading volume could trigger a “Shoulder-to-Shoulder” pattern and lead the price to retreat to the red support zone of $16. On the other hand, although the Relative Strength Index (RSI) is close to oversold territory, it does not signal any clear reversal. The 22.19 level stands out as a strong resistance point for the resumption of the upward movement. If the positive expectations in the market increase and this level is exceeded with a high volume breakout, the price may re-enter the uptrend and increase the strength of this movement.
Supports: 20.46 – 18.84 – 16.00
Resistances: 22.19 – 24.75 – 26.58
BNB/USDT
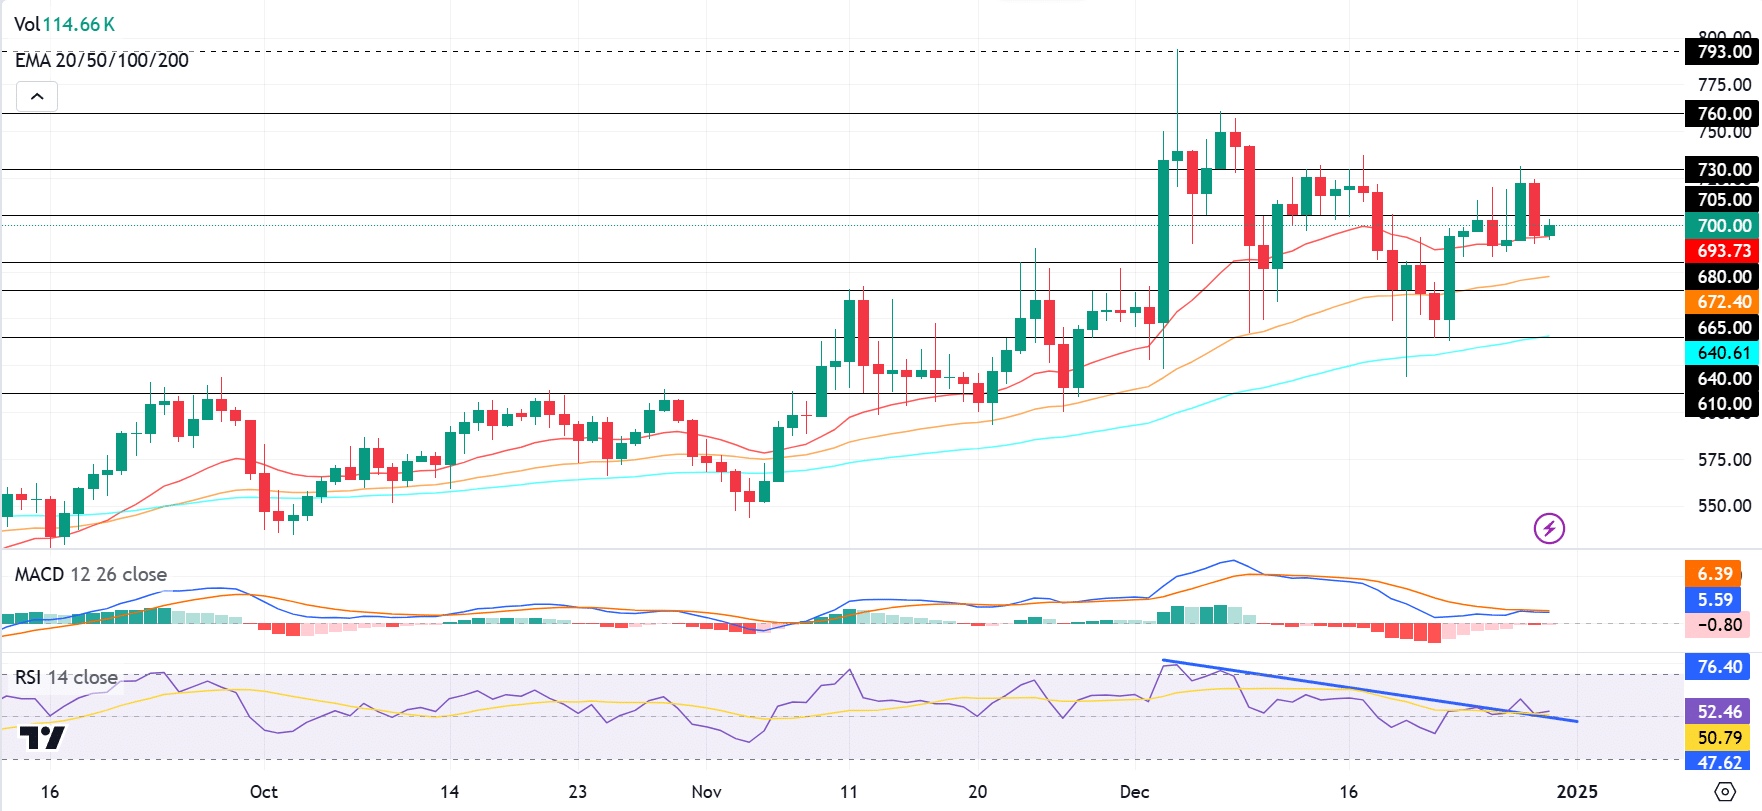
In the previous week, there was a busy agenda for the markets, which caused pressure on the crypto market in general. BNB/USDT, which entered a downward trend after Fed chairman Jerome Powell’s hawkish statements regarding interest rate cuts in 2025, fell as low as 618 after breaking the 705 support level. However, the asset, which managed to recover from these levels, has exhibited a positive price movement since the beginning of last week, finding support at the 640 level. The asset, which rose to 730 levels with the positive momentum captured, maintains its positive position above the EMA 20 (red line), although it is under pressure from these levels.
The RSI indicator managed to break the descending trend line, which has been running since December 4, to the upside and gained confirmation above this level. Maintaining this confirmation may contribute to the continuation of the positive outlook. The MACD indicator, on the other hand, shows that although negative candles indicate selling pressure, this pressure is weakening and may end if buying continues.
In this context, if the positive momentum continues, a rise towards the 705 level is expected first. If the 705 level is broken upwards, a rise up to 730 and 760 levels can be observed, respectively. However, as a result of a possible pressure from the 705 level, the price is likely to retreat towards the 680 level again. If the 680 level is broken downwards, the 665 and 640 levels can be followed as support.
Supports: 680- 665- 640
Resistances: 705- 730- 760
ADA/USDT
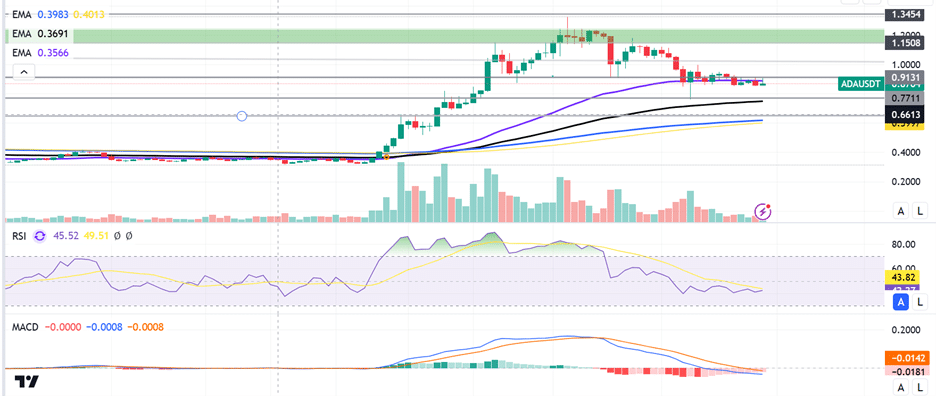
ADA, which opened at 0.9545 last week, rose as high as 0.9980, but fell with the selling pressure and closed the week at 0.7657. Although it started the new week with an uptrend, the downtrend in ADA since December 17 continues to maintain its effect.
Moving Average Convergence/Divergence (MACD) data continues to remain below the negative zone (-0.0072) on ADA, which continues its downtrend. This confirms that selling pressure is still strong as the histogram shows weak momentum. Relative Strength Index (RSI 14) is showing weak momentum at 46. If ADA tests the support level at 0.8287 and then the 200-period Exponential Moving Average (EMA100) and breaks it to the downside, the $0.7271 and $0.7335 levels could be targeted. The RSI falling further and the MACD remaining in negative territory emphasize the proximity of this scenario. As the RSI indicator approaches the oversold zone of 30, there may be a possible reaction buying. If the ADA rallies with possible buying and breaks the EMA50 level to the upside, it may test the 1.1583 resistance level (Green Line) for a rise, followed by the 1.0000 resistance levels. If these resistance levels are broken, 1.0318 and 0.8985 levels can be targeted. RSI gaining strength and rising above 50 and MACD crossing the signal line upwards and rising towards the positive zone may strengthen the post-recovery rise in ADA
(EMA50: Purple Line, EMA100: Black Line, EMA200: Blue Line)
Supports: 0,7271 – 0,7335 – 0,8985
Resistances: 1,1583 – 1,0318 – 1,0318
LEGAL NOTICE
The investment information, comments and recommendations contained in this document do not constitute investment advisory services. Investment advisory services are provided by authorized institutions on a personal basis, taking into account the risk and return preferences of individuals. The comments and recommendations contained in this document are of a general type. These recommendations may not be suitable for your financial situation and risk and return preferences. Therefore, making an investment decision based solely on the information contained in this document may not result in results that are in line with your expectations.


