MARKET SUMMARY
Latest Situation in Crypto Assets
| Assets | Last Price | 24h Change | Dominance | Market Cap |
|---|---|---|---|---|
| BTC | 92,500.19 | -2.38% | 56.51% | 1,83 T |
| ETH | 3,332.14 | -1.76% | 12.41% | 402,90 B |
| XRP | 2.026 | -6.70% | 3.59% | 116,35 B |
| SOLANA | 188.79 | -3.58% | 2.80% | 90,78 B |
| DOGE | 0.3125 | -3.62% | 1.43% | 46,29 B |
| CARDANO | 0.8449 | -6.73% | 0.92% | 29,74 B |
| TRX | 0.2532 | -2.85% | 0.67% | 21,85 B |
| AVAX | 35.57 | -3.78% | 0.45% | 14,61 B |
| LINK | 20.38 | -5.51% | 0.40% | 13,00 B |
| SHIB | 0.00002104 | -4.89% | 0.38% | 12,36 B |
| DOT | 6.630 | -6.09% | 0.31% | 10,14 B |
*Prepared on 12.30.2024 at 14:00 (UTC)
WHAT’S LEFT BEHIND
MicroStrategy announces 8th consecutive week of Bitcoin buying
Since August 2020, MicroStrategy, which has been making regular Bitcoin purchases and thus attracting the attention of the whole world, announced new Bitcoin purchases 2 days before the end of the year. The company bought 2138 BTC.
BNB Chain Stablecoin Free Transfer Promotion Extended
BNB Chain has announced the extension of its “Zero Gas Fee Carnival” event until March 31, 2025 in an effort to increase the adoption and usage of stablecoins. During this period, users will be exempt from gas fees on stablecoin transfers such as USDT, USDC, FDUSD from centralized exchanges to the BNB Smart Chain (BSC) and opBNB network.
BTC.Fun Officially Launches: Million Dollar Meme Incentive Plan
BTC.Fun, a fun project for the Bitcoin ecosystem, officially launched today. The platform allows users to publish, mint and trade Bitcoin-based memes in Runes and BRC-20 standard. Furthermore, BTC.Fun is inviting the community to join the platform by launching a million-dollar Meme Issuance Incentive Plan.
Grayscale is the Largest Institutional Owner with $6.62 Billion ETH
Blockchain analytics platform Arkham has revealed that Grayscale currently holds ETH worth $6.62 billion, making it the largest institutional Ethereum holder. Grayscale’s ETH investments cement its leading position in the industry.
Grayscale’s High Potential Coin List Updated
Grayscale has renewed the list of “20 cryptocurrencies with the highest potential” in its report sharing its expectations for the first quarter of 2025. The 6 new cryptocurrencies added to the list: HYPE, ENA, VIRTUAL, JUP, JTO, GRASS. At the same time, NEAR, STX, MKR, CELO, UMA, TON were removed from this list. Grayscale’s new additions provide a remarkable roadmap for investors.
2024 Financial Stability Report from the People’s Bank of China: Attention to Cryptocurrencies
Although China banned cryptocurrencies in 2021, it included global developments in the crypto market in its “Financial Stability Report” for 2024. The report states that regulatory compliance processes, especially in Hong Kong, are closely monitored. China’s approach to crypto assets reveals its stance against global regulations.
HIGHLIGHTS OF THE DAY
Important Economic Calender Data
| Time | News | Expectation | Previous |
|---|---|---|---|
| 14:45 | US Chicago PMI (Dec) | 42.7 | 40.2 |
| 15:00 | US Pending Home Sales (MoM) (Nov) | 0.9% | 2.0% |
INFORMATION
*The calendar is based on UTC (Coordinated Universal Time) time zone.
The economic calendar content on the relevant page is obtained from reliable news and data providers. The news in the economic calendar content, the date and time of the announcement of the news, possible changes in the previous, expectations and announced figures are made by the data provider institutions. Darkex cannot be held responsible for possible changes that may arise from similar situations
MARKET COMPASS
Wall Street index futures are pointing to a lower open on the first trading day of the week, following Friday’s declines, even as the recent sell-off in the US bond market shows signs of abating. Losses between 1%-1.5% are being read on the three major indices. European stock markets also retreated, albeit to a lesser extent. Markets continue to adjust their positions regarding the US Federal Reserve’s rate cut path. The value of the dollar appreciated during European transactions. We can say that the “Santa Claus Rally” effect has not been felt so far.
Digital assets also reflect the weakness in global risk appetite. While major cryptocurrencies declined, we maintain our expectation of sideways movement in the short term. For the long term, as mentioned below, we do not see a strong reason to change our bullish expectation for now.
From the short term to the big picture.
The victory of former President Trump on November 5, which was one of the main pillars of our bullish expectation for the long-term outlook in digital assets, produced a result in line with our predictions. Afterwards, the appointments made by the president-elect and the increasing regulatory expectations for the crypto ecosystem in the US and the emergence of BTC as a reserve continued to take place in our equation as positive variables. Although it is expected to continue at a slower pace, the FED’s signal that it will continue its interest rate cut cycle and the volume in crypto-asset based ETFs indicating an increase in institutional investor interest (in addition to MicroStrategy’s BTC purchases, BlackRock’s BTC ETF options starting to trade…) support our upward forecast for the big picture for now.
In the short term, given the nature of the market and pricing behavior, we think it would not be surprising to see occasional pauses or pullbacks in digital assets. However, at this point, it is worth emphasizing again that the fundamental dynamics continue to be bullish.
TECHNICAL ANALYSIS
BTC/USDT
MicroStrategy, which was included in the Nasdaq 100 index last week, continues its Bitcoin purchases unabated. The company announced this Monday that it purchased another 2138 BTC. With this purchase, MicroStrategy’s total Bitcoin holdings reached 446,400. In addition, the Saylor-led firm has purchased a total of 257,100 BTC in 2024.
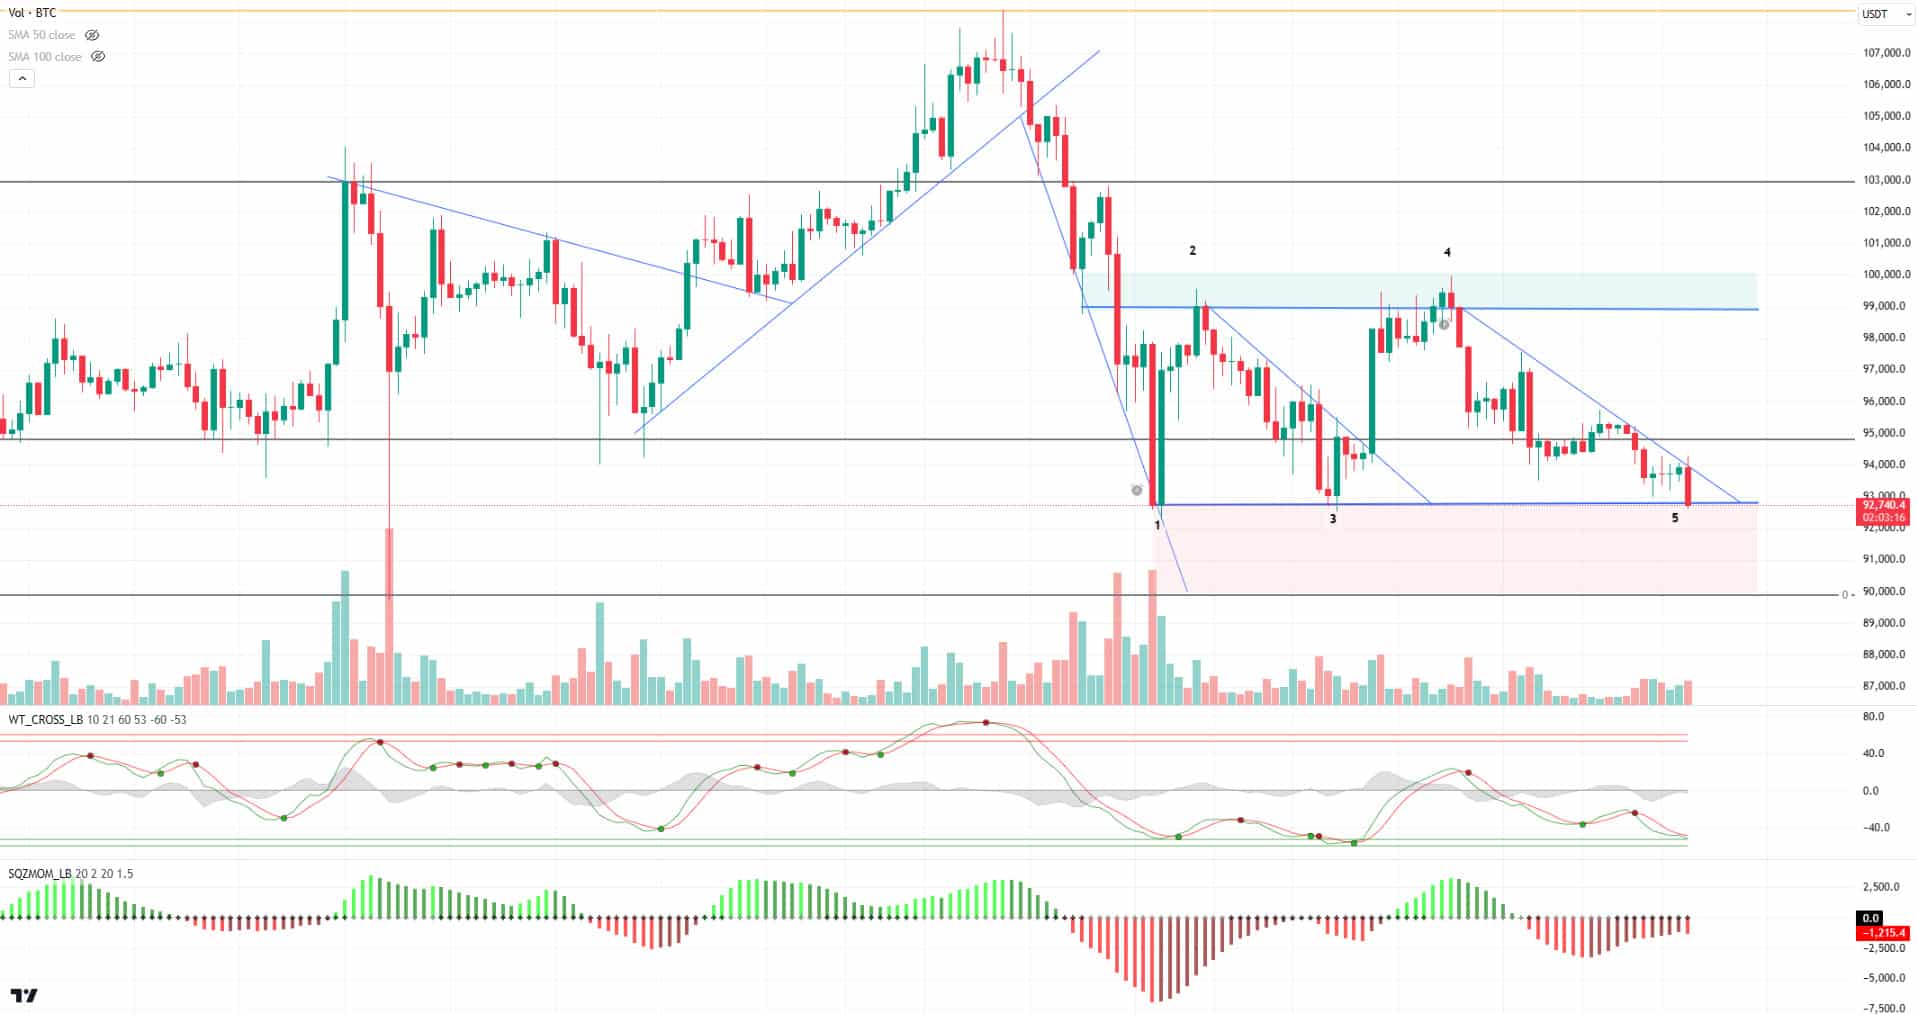
When we look at the technical outlook with the latest development, the price, which tested the falling minor trend line in a rectangle pattern, retreated. In BTC, which is currently trading at 92,700, technical oscillators are about to give a buy signal in the oversold direction, while the momentum indicator to weaken in the negative zone. With the price crossing the falling trend line, an upward breakout may occur and a new uptrend may begin. In a possible pullback, the 92,800 level continues to serve as critical support. Hourly closures below it may pull the price to the 90,000 level.
Supports 92,800 – 90,000 – 88,500
Resistances 95,000 – 97,200 – 99,100

ETH/USDT
The decline that started in the market with MicroStrategy’s announcement that it was buying Bitcoin also had an impact on Ethereum (ETH). Open interest data showed that many positions were closed, while Cumulative Volume Delta (CVD) data showed that futures selling accelerated. This indicates that the bearish movement in the market is driven by futures.
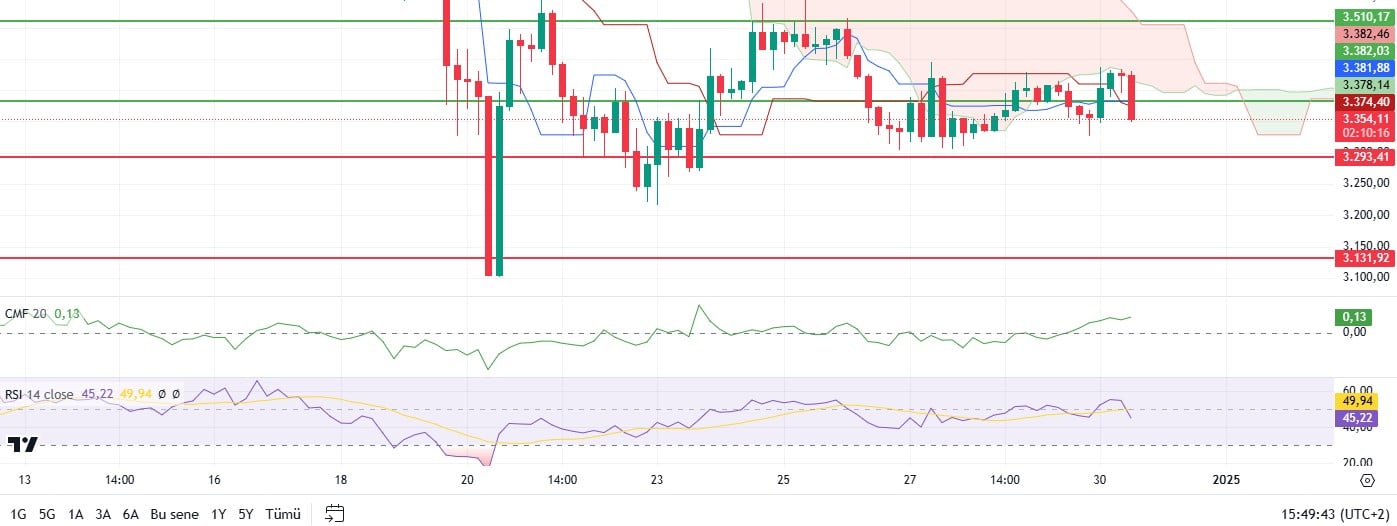
Technical indicators for ETH are signaling that the decline may be temporary. Although the 3,382 support has been lost, the continued upward movement in the Chaikin Money Flow (CMF) indicator suggests that the impact of the sell-off may be limited. This strengthens the possibility that the decline could be a “fake out”. If the price regains the 3,381 level in the evening, the bullish momentum may continue.
Looking at the Ichimoku indicator, the price was rejected from the lower band of the kumo cloud. However, at the same time, there is a buy signal formed by the tenkan level crossing the kijun level upwards. This technical signal indicates the potential for a price rebound. In case the price breaks through the 3,382 level and the kumo cloud lower band, stronger upside movements are likely to be seen. However, the 3,293 level remains important as support. A break of this level could disrupt the current positive outlook and lead to deeper declines. As a result, ETH’s surpassing the 3,381 level could restore the positive outlook, while a break below the 3,293 level could pave the way for a harder sell-off. These critical levels should be closely monitored.
Supports 3,293 – 3,131- 3,033
Resistances 3,382 – 3,510 – 3,670

XRP/USDT
XRP continued its recent bearish move, losing the 2.08 support. This move signals weakness, which is confirmed by a number of technical indicators.
In particular, the Relative Strength Index (RSI) indicator has fallen as low as 30, approaching oversold territory. Chaikin Money Flow (CMF), on the other hand, is flatter in the negative territory. This flat movement in CMF suggests that there is no clear buying or selling pressure across the market, investors are cautious and the market is unable to determine a clear direction. Moreover, weak momentum and volume data suggest that XRP may not find further support in its current downtrend. These weak fundamental indicators suggest that the short-term recovery may remain limited, strengthening the possibility of a decline to 1.96.
The 1.96 level stands out as a critical support zone for XRP. Although this area is considered as a potential area where the price may react, the loss of this level may lead to deeper declines. A break below 1.96 could trigger a price decline towards lower support levels and reinforce the bearish momentum
Supports 1.9638 – 1.8651 – 1.6309
Resistances 2.0800 – 2.1800 – 2. 3236

SOL/USDT
Solana’s number of transactions has increased recently. It recorded an increase in trading activity with 66.9 million trades executed in the last 24 hours. Market activity showed that sellers outnumbered buyers
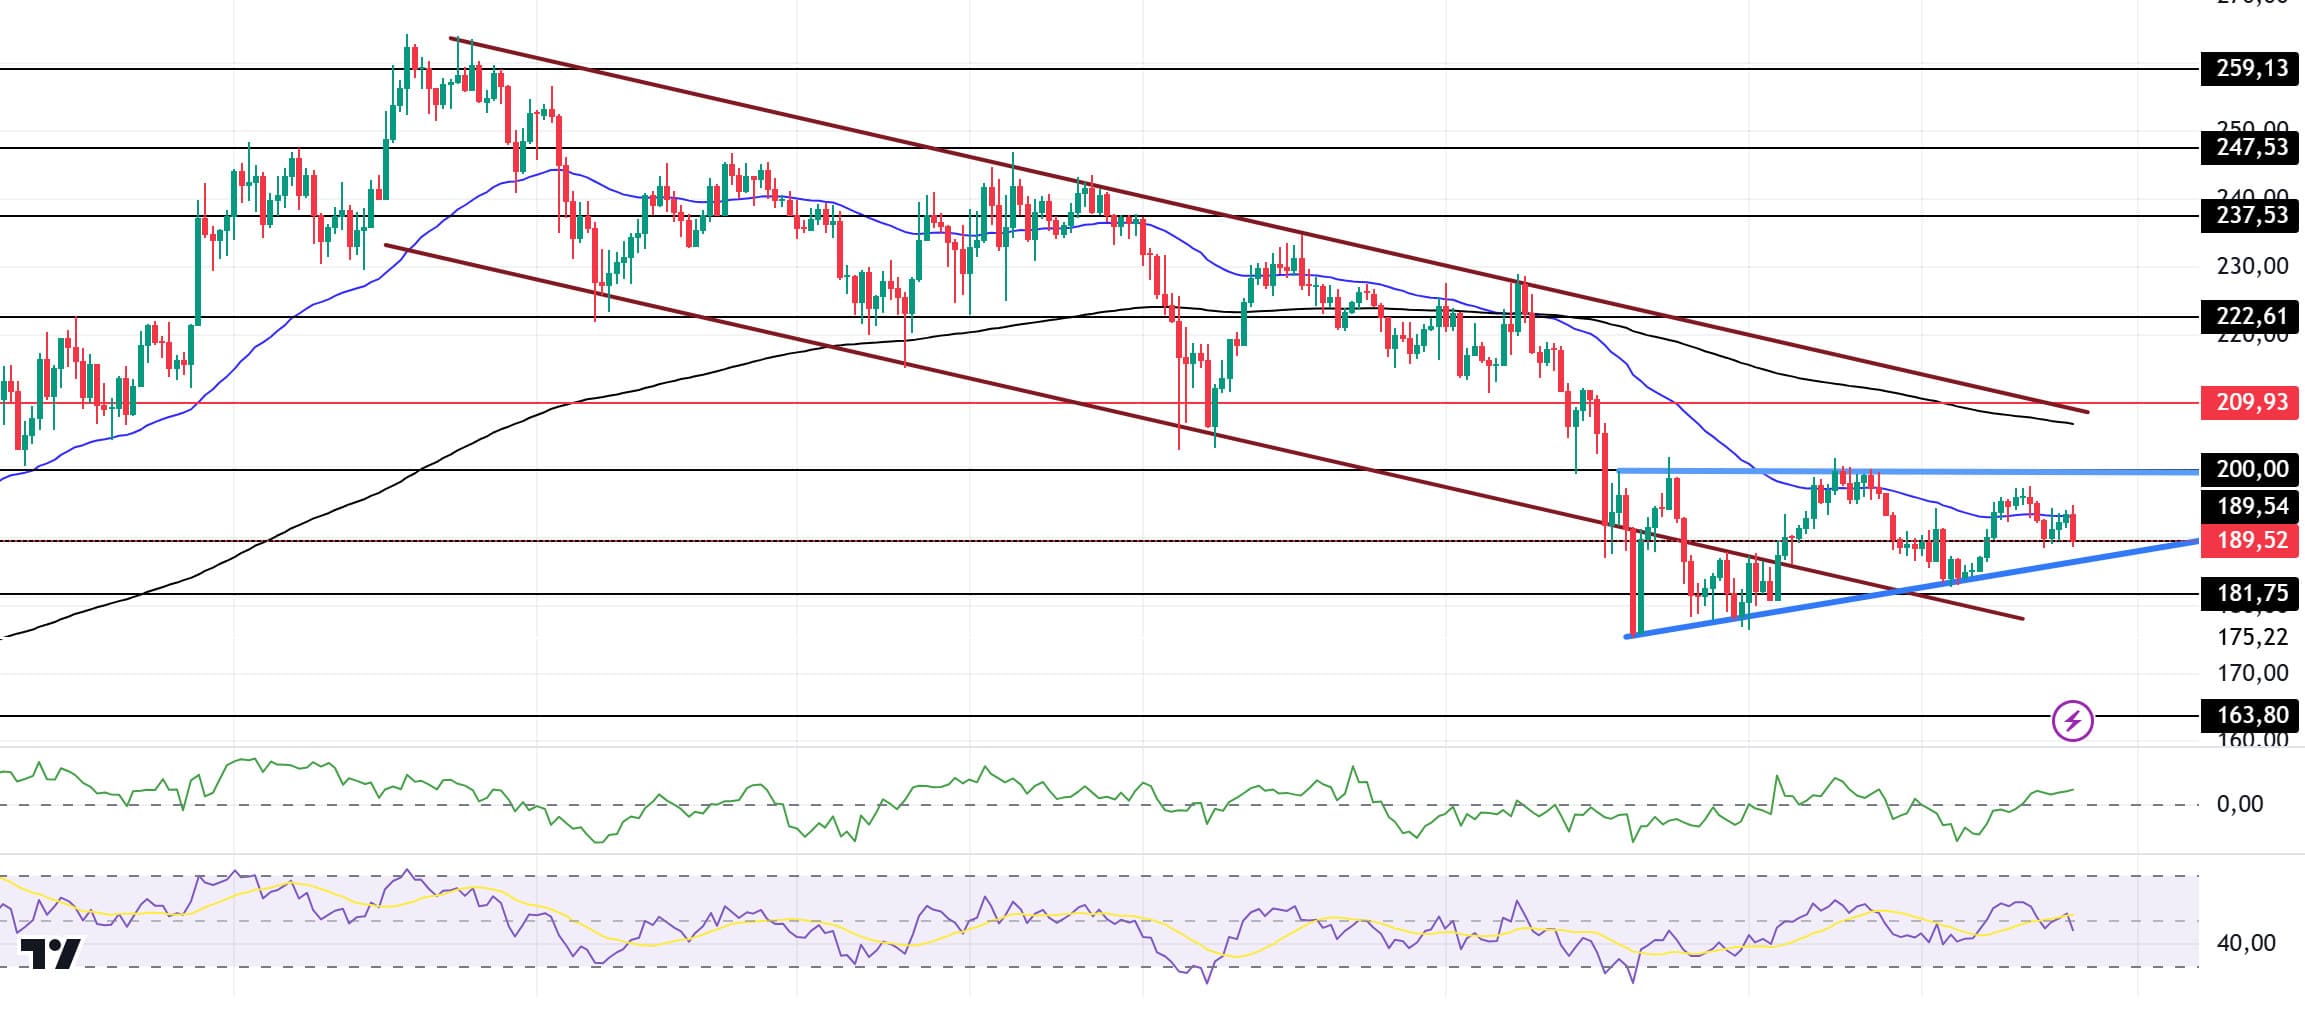
Solana has been trading sideways since our analysis in the morning. On the 4-hour timeframe, the 50 EMA (Blue Line) is below the 200 EMA (Black Line). As a matter of fact, the asset tested the 50 EMA resistance during the day but failed to break it and turned bearish. If it retests and breaks here again, the rise may continue. When we examine the Chaikin Money Flow (CMF)20 indicator, it is in positive territory and money inflows are gradually increasing. However, Relative Strength Index (RSI)14 is at the neutral level. On the other hand, the ascending triangle pattern should be taken into consideration. The 209.93 level stands out as a very strong resistance point in the rises driven by both the upcoming macroeconomic data and the news in the Solana ecosystem. If it breaks here, the rise may continue. In case of retracements for the opposite reasons or due to profit sales, the 163.80 support level can be triggered. If the price comes to these support levels, a potential bullish opportunity may arise if momentum increases.
Supports 189.54 – 181.75 – 163.80
Resistances 200.00 – 209.93 – 222.61

DOGE/USDT
Dogecoin open interest fell by 2.75% to $1.98 billion. Meanwhile, the OI weighted funding rate remained at 0.0098%. This shows us that traders are willing to pay the same premium as last week to maintain bullish positions.
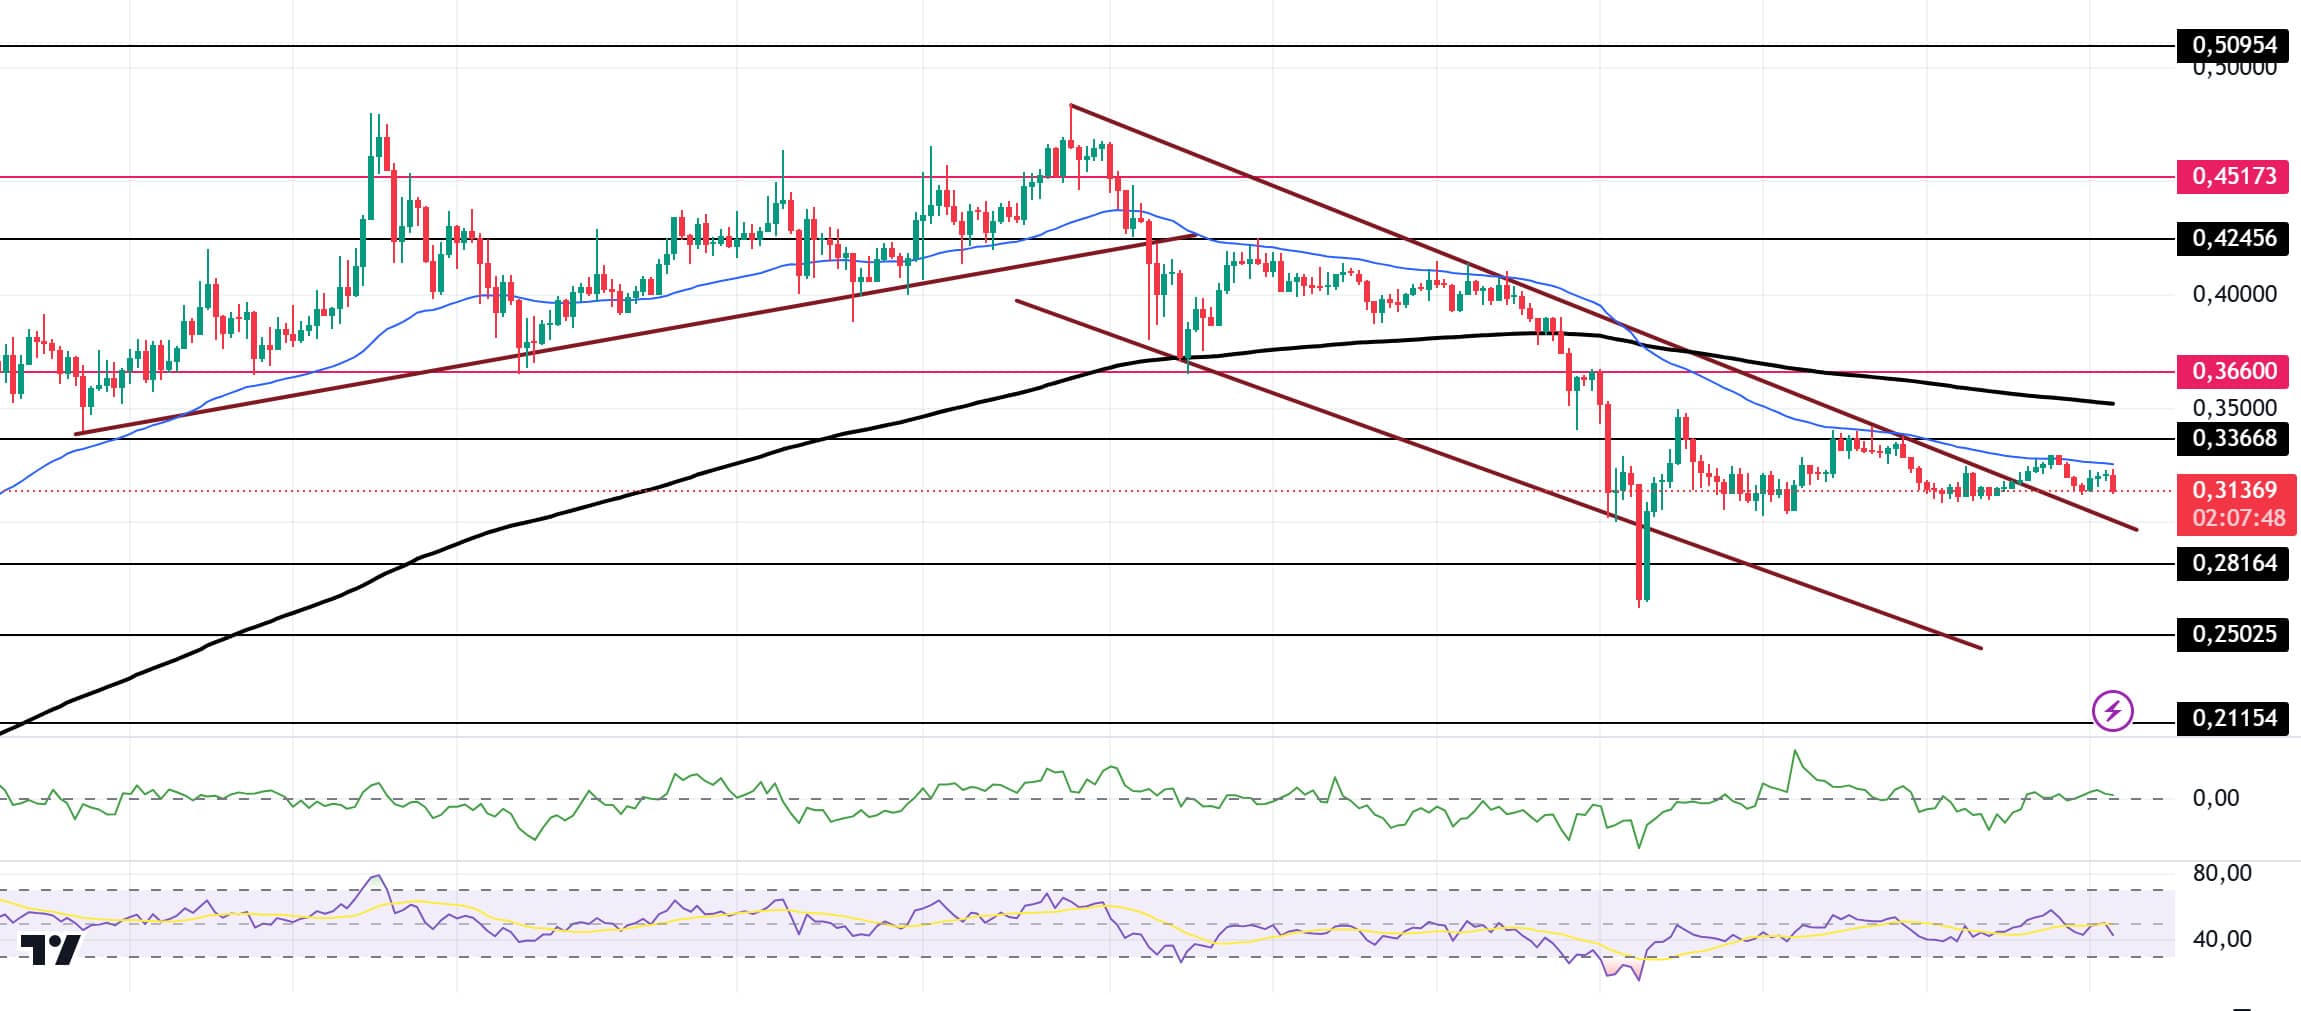
When we look at the chart, DOGE, which has been in a downtrend since December 8, gained momentum from the support of this trend and consolidated in the middle of the trend, then tested the resistance level of the trend with horizontal movements and went out of the trend. Currently, the 50 EMA is working as resistance to the asset. On the 4-hour timeframe, the 50 EMA (Blue Line) continues to be below the 200 EMA (Black Line). When we examine the Chaikin Money Flow (CMF)20 indicator, it moved into the positive zone. As a matter of fact, money outflows started to increase. However, Relative Strength Index (RSI)14 maintains its neutral zone level. The 0.36600 level stands out as a very strong resistance level in the rises driven by both the upcoming macroeconomic data and the innovations in the Doge coin. If DOGE catches a new momentum and rises above this level, the rise may continue strongly. In case of possible pullbacks due to macroeconomic reasons or negativity in the ecosystem, the 0.25025 level, which is the base level of the trend, is an important support. If the price reaches these support levels, a potential bullish opportunity may arise if momentum increases.
Supports 0.28164 – 0.25025 – 0.21154
Resistances 0.33668 – 0.36600 – 0.42456

LEGAL NOTICE
The investment information, comments and recommendations contained herein do not constitute investment advice. Investment advisory services are provided individually by authorized institutions taking into account the risk and return preferences of individuals. The comments and recommendations contained herein are of a general nature. These recommendations may not be suitable for your financial situation and risk and return preferences. Therefore, making an investment decision based solely on the information contained herein may not produce results in line with your expectations.


