BTC/USDT
We left behind another week of year-end closures in the crypto market. One of the most important developments on the crypto side in the last week of the year, the restriction of Tether in the European market, which did not meet the regulations given under MiCA regulations, created FUD pressure on the market. With the declining risk appetite, Spot ETFs were negative. Institutional investors’ interest continued, led by MicroStrategy and Marathon Digital.
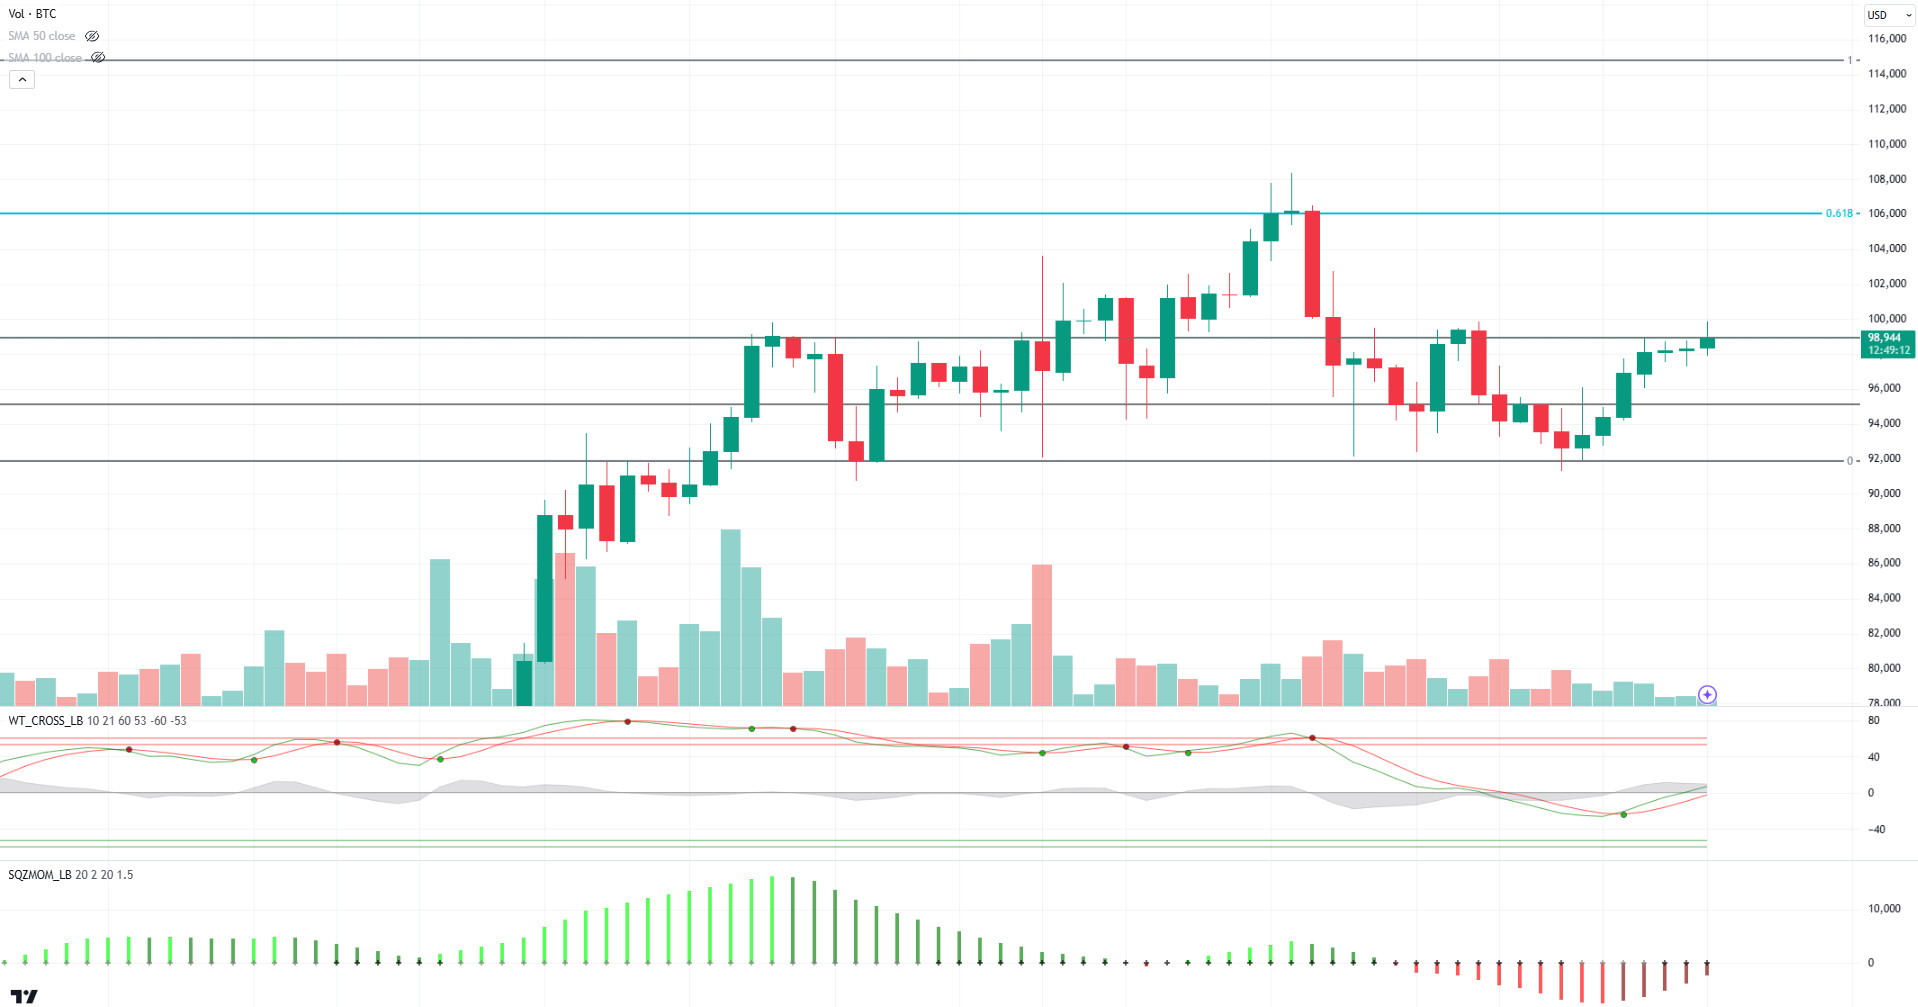
When we look at the technical outlook from a daily perspective, BTC, which fell to 91,700 with the impact of negative developments, gained 5.38% on a weekly basis and recovered its losses and reached six-digit limits again. In BTC, which is currently trading at 98,800, technical oscillators continue to maintain the buy signal on the daily chart, while the momentum indicator has weakened well in the negative zone. When we look at the weekly liquidation chart, we can say that short trades in the range of 100,000 and 103,000 can be targeted for the rest of the week. In a possible pullback, the 95,000 support level is the level we will accept as a reference.
Later in the week, eyes will be on US macro data such as non-farm payrolls and unemployment rates. In addition, earnings reports from important BTC companies such as BlackRock and Coinbase could have an impact on the market.
Supports 95,000 – 92,800 – 90,000
Resistances 99,100 – 103,800 – 105,000
ETH/USDT
Fast-starting 2025, Ethereum is gaining attention with some metrics following the EIP-4844 (Proto-Danksharding) update, which aims to provide solutions to scalability issues. This update managed to significantly reduce transaction costs while significantly increasing the network’s transaction capacity. It seems that Ethereum is becoming a more attractive platform, especially for institutional investors and decentralized application developers. The increased transaction capacity and lower costs have enabled wider adoption of the network, leading to a significant increase in individual and institutional adoption rates. Ethereum’s leadership in decentralized finance (DeFi) continues to strengthen in 2025. Total value locked (TVL) on DeFi protocols could reach new record highs this year. In particular, the increasing integration of banks and financial institutions into DeFi protocols will strengthen the demand for the Ethereum ecosystem and support the ETH price upwards. The high utilization rate of Ethereum infrastructure in the NFT and gaming sectors also contributes to the growth of the ecosystem. In addition, the active use of Layer-2 solutions developed to reduce congestion on the network and improve the user experience increases Ethereum’s potential to expand its user base.
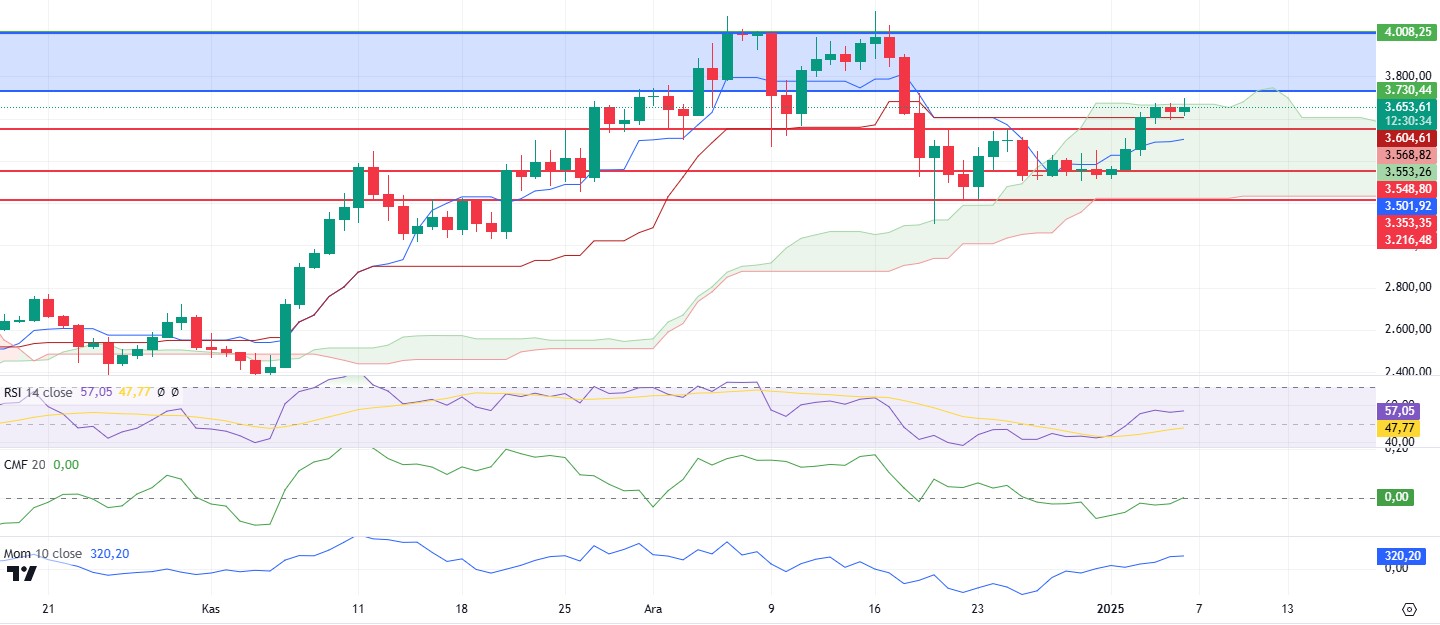
Looking at Ethereum’s technical analysis, the Ichimoku indicator shows that the price rose to the upper boundary of the kumo cloud, but failed to break through this level. The Relative Strength Index (RSI) shows that the bullish momentum has slowed down as of the last weekend. Furthermore, the Chaikin Money Flow (CMF) indicator has a negative divergence that is out of sync with price action. This data suggests that Ethereum’s recent bullish move is not entirely on a sound footing and reinforces the possibility of a short-term correction. However, positive signs include price holding above the Kijun line and continued strength in the momentum indicator. Over the coming week, Ethereum’s price can be expected to remain sideways or make slight corrections. However, possible rallies towards the upper boundary of the kumo cloud and the resistance levels indicated on the chart could strengthen the technical outlook and lead to the formation of new highs. This scenario may become even stronger, especially in case of a positive turn in market dynamics.
Supports 3,548 – 3,353 – 3,216
Resistances 3,730 – 4,008 – 4,374
XRP/USDT
The SEC lawsuit against Ripple remains a central issue for XRP. Ripple’s legal team suggests that the SEC’s appeal deadline of January 15, 2025 will not change Judge Analisa Torres’ ruling that XRP is not a security. This view has generated strong optimism within the Ripple and XRP community. Moreover, the fact that a pro-crypto leader like Paul Atkins, who is expected to head the SEC, is taking over increases the likelihood that the case will be withdrawn or a settlement will be reached between the parties. Such a scenario could add significantly to XRP’s market capitalization, allowing its price to test new highs.
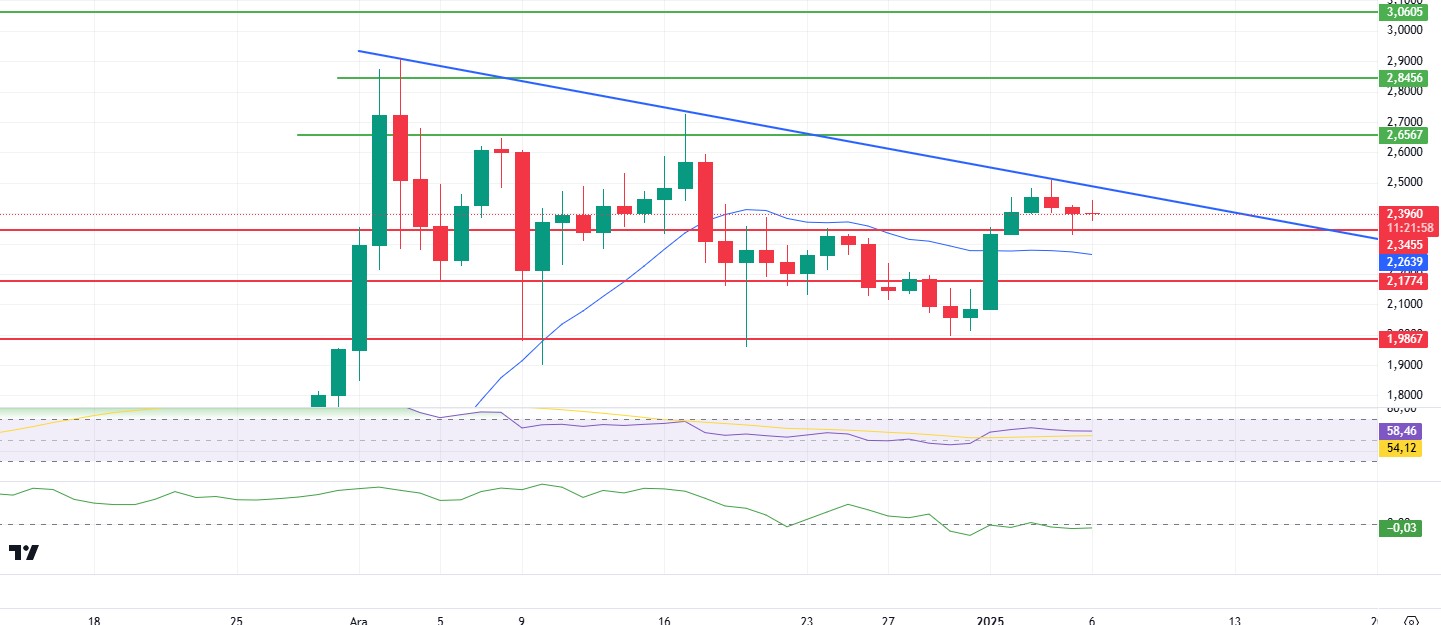
From a technical analysis perspective, momentum indicators are showing a significant weakening despite XRP price breaking through the 2.34 level again. Chaikin Money Flow (CMF) and Relative Strength Index (RSI) indicators suggest that momentum has slowed down after the recent rally. Moreover, the fact that the main trend line on the chart has not been breached despite being tested for the third time suggests that market dynamism has weakened somewhat.
While it is positive that the price managed to stay above the 20-day exponential moving average and broke the 2.34 level, weaknesses in short-term technical indicators point to a potential correction. Notably, if a volume-backed breakout fails to materialize, the price is likely to consolidate at these levels or retest lower support levels. In summary, while XRP price has the potential to break through strong resistance levels, it is important for traders to be cautious of volatility due to short-term uncertainties.
Supports 2.3455 – 2.1774 – 1.9867
Resistances 2.6567 – 2.8456 – 3.0605
SOL/USDT
Last week, asset manager Volatility Shares filed for three new exchange-traded funds (ETFs) focused on Solana futures contracts. At the same time, Nate Geraci, president of ETF Store, shared on the X platform that spot Solana ETFs are expected to be approved in 2025. With this, the possibility of Polymarket’s spot SOL ETF has also increased. Polymarket’s probability of this approval in 2025 is 85%. Solana co-founder Stephen Akridge is being sued by his ex-wife Elisa Rossi for allegedly stealing millions in staking rewards from his crypto wallet. Rossi alleged that Akridge used his blockchain expertise to secretly control her accounts and take all the rewards without her consent. The lawsuit, filed in San Francisco, accuses Akridge of fraud and unjust enrichment and described the amounts in dispute as “substantial.” The Solayer Foundation was launched to support Solayer, the Solana restaking protocol. The Solayer protocol aims to scale the Solana Virtual Machine (SVM) horizontally, similar to what EigenLayer does for the Ethereum network. On the onchain side, Solana’s competitive advantages such as low fees and high transaction speeds continue to attract DeFi users. As DEX trading accelerated, Solana became the leader in stablecoin inflows. Over $5 billion in stablecoin assets paved the way for a slight weekly rebound. According to Coinglass data, the SOL Long/Short ratio was 48.59% at press time, indicating caution among traders
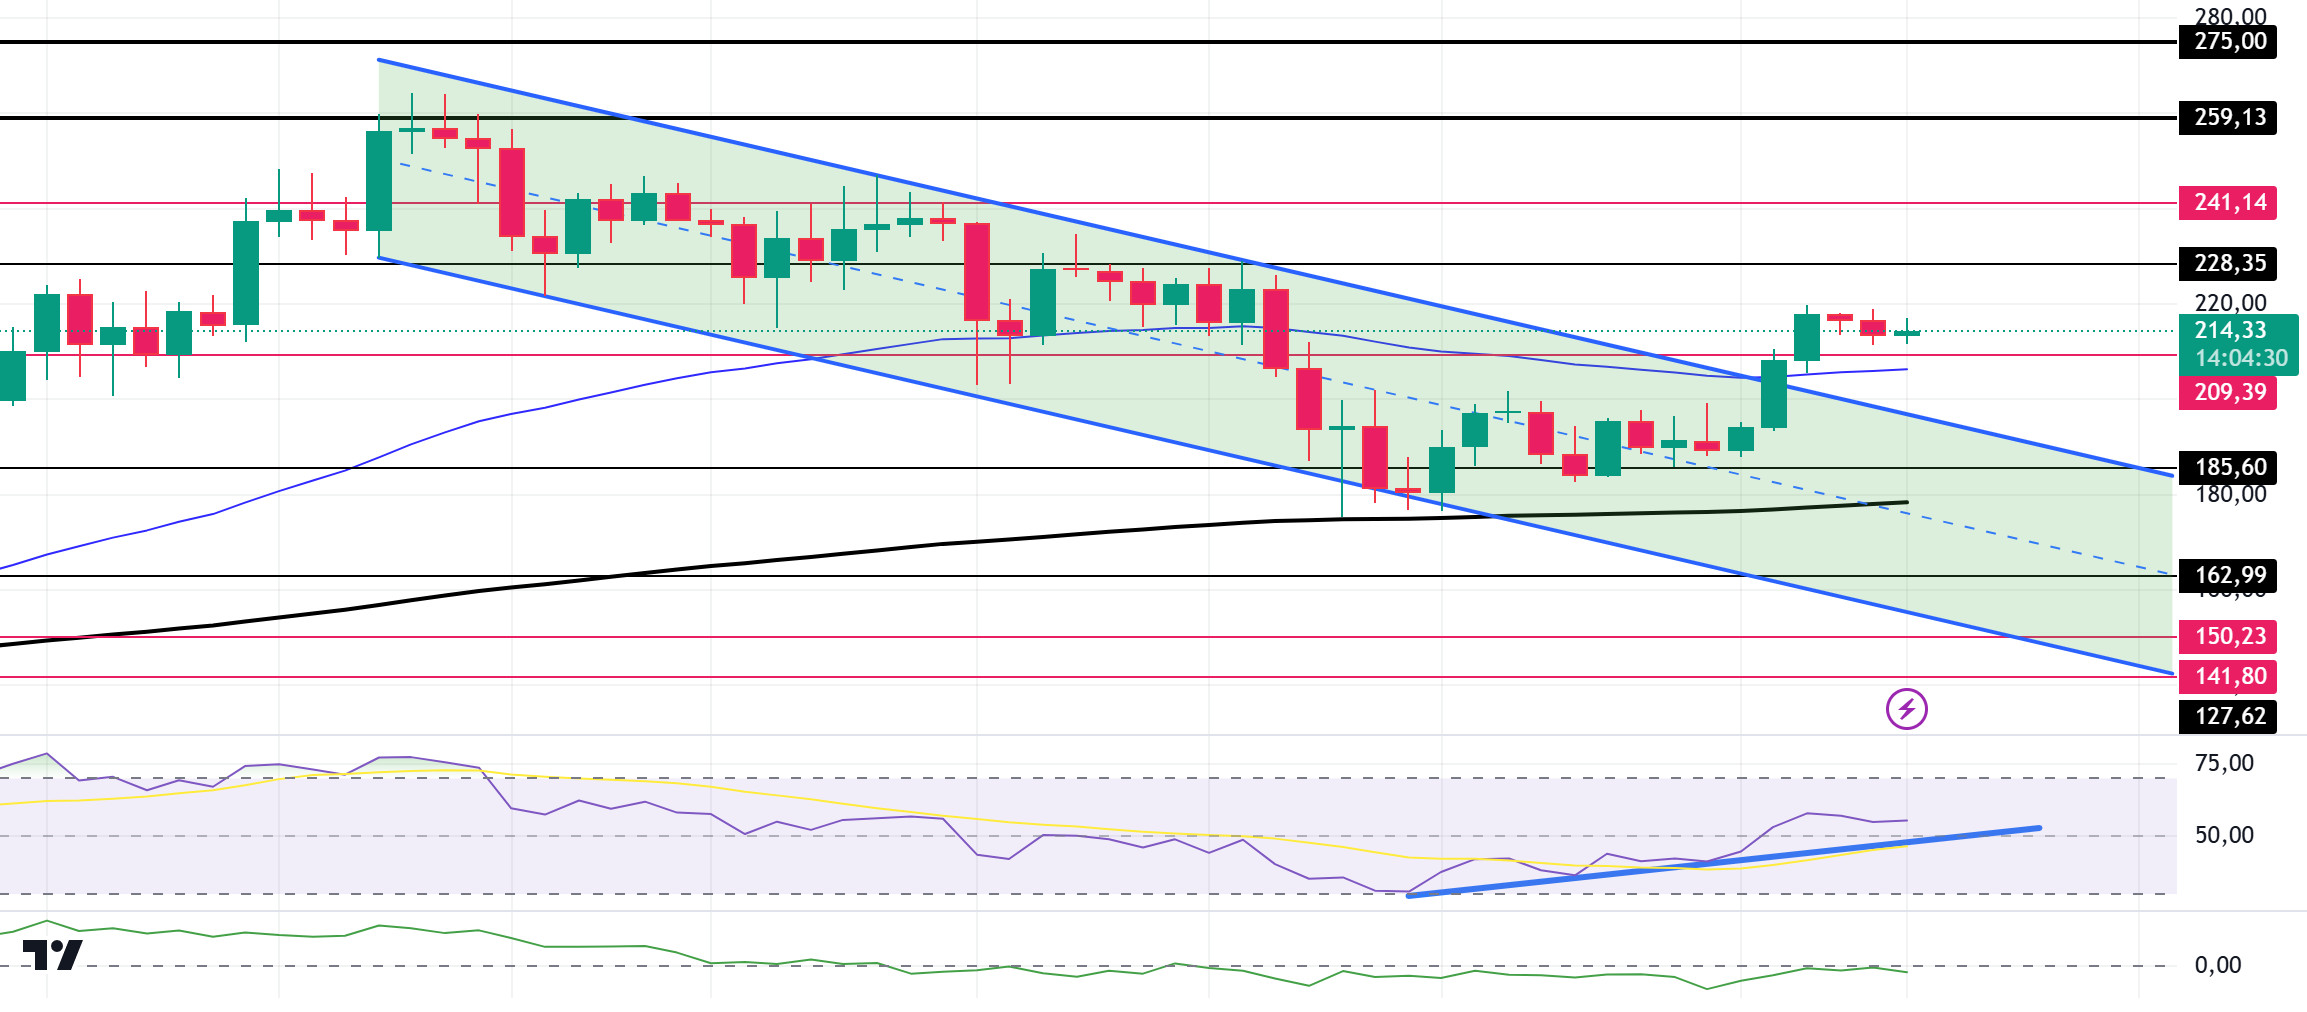
SOL, the 5th largest crypto by market capitalization, continued to perform upwards during the week, breaking the month-long downtrend upwards within a narrow price channel. Technically, it broke the strong resistance at 209.39, thus breaking the downtrend since November 22. It also started pricing above the 50 EMA (Blue Line) and 200 EMA moving averages. The asset may pull back slightly from here, supported by the 200 EMA and the resistance of the downtrend and start rising again. These two levels mark this as a very strong support. On our daily chart, the 50 EMA (Blue Line) continues to be above the 200 EMA (Black Line). This shows that the trend is bullish in the medium term. Relative Strength Index (RSI) 14 is moving close to the neutral zone. At the same time, the RSI chart shows an uptrend. This could push the price higher. However, when we examine the Chaikin Money Flow (CMF)20 indicator, we see that money inflows and outflows are breakeven and CMF is in the neutral zone. If the positive results in macroeconomic data and positive developments in the ecosystem continue, it may test the first major resistance level of 228.35. In case of negative macroeconomic data or negative news in the Solana ecosystem, the 185.60 level can be followed and a buy point can be determined
Supports 209.39 – 185.60 – 162.99
Resistances 228.35 – 241.14 – 259.13
DOGE/USDT
Last week, the Dogecoin founder responded to Elon Musk’s X call and published a massive DOGE post. Whales bought over 90 million DOGE last week, signaling accumulation. This accumulation was recorded when the asset’s price fell to a record low of $0.3065. According to Coinglass data, Dogecoin derivatives have seen notable movements recently. An imbalance has emerged in the liquidation of DOGE perpetual futures positions. It was noteworthy that the amount of liquidated short positions exceeded the amount of long positions by more than 400%. The total amount of liquidated Dogecoin positions is $9.94 million. Of this amount, 1.98 million dollars were long positions and 7.96 million dollars were short positions.
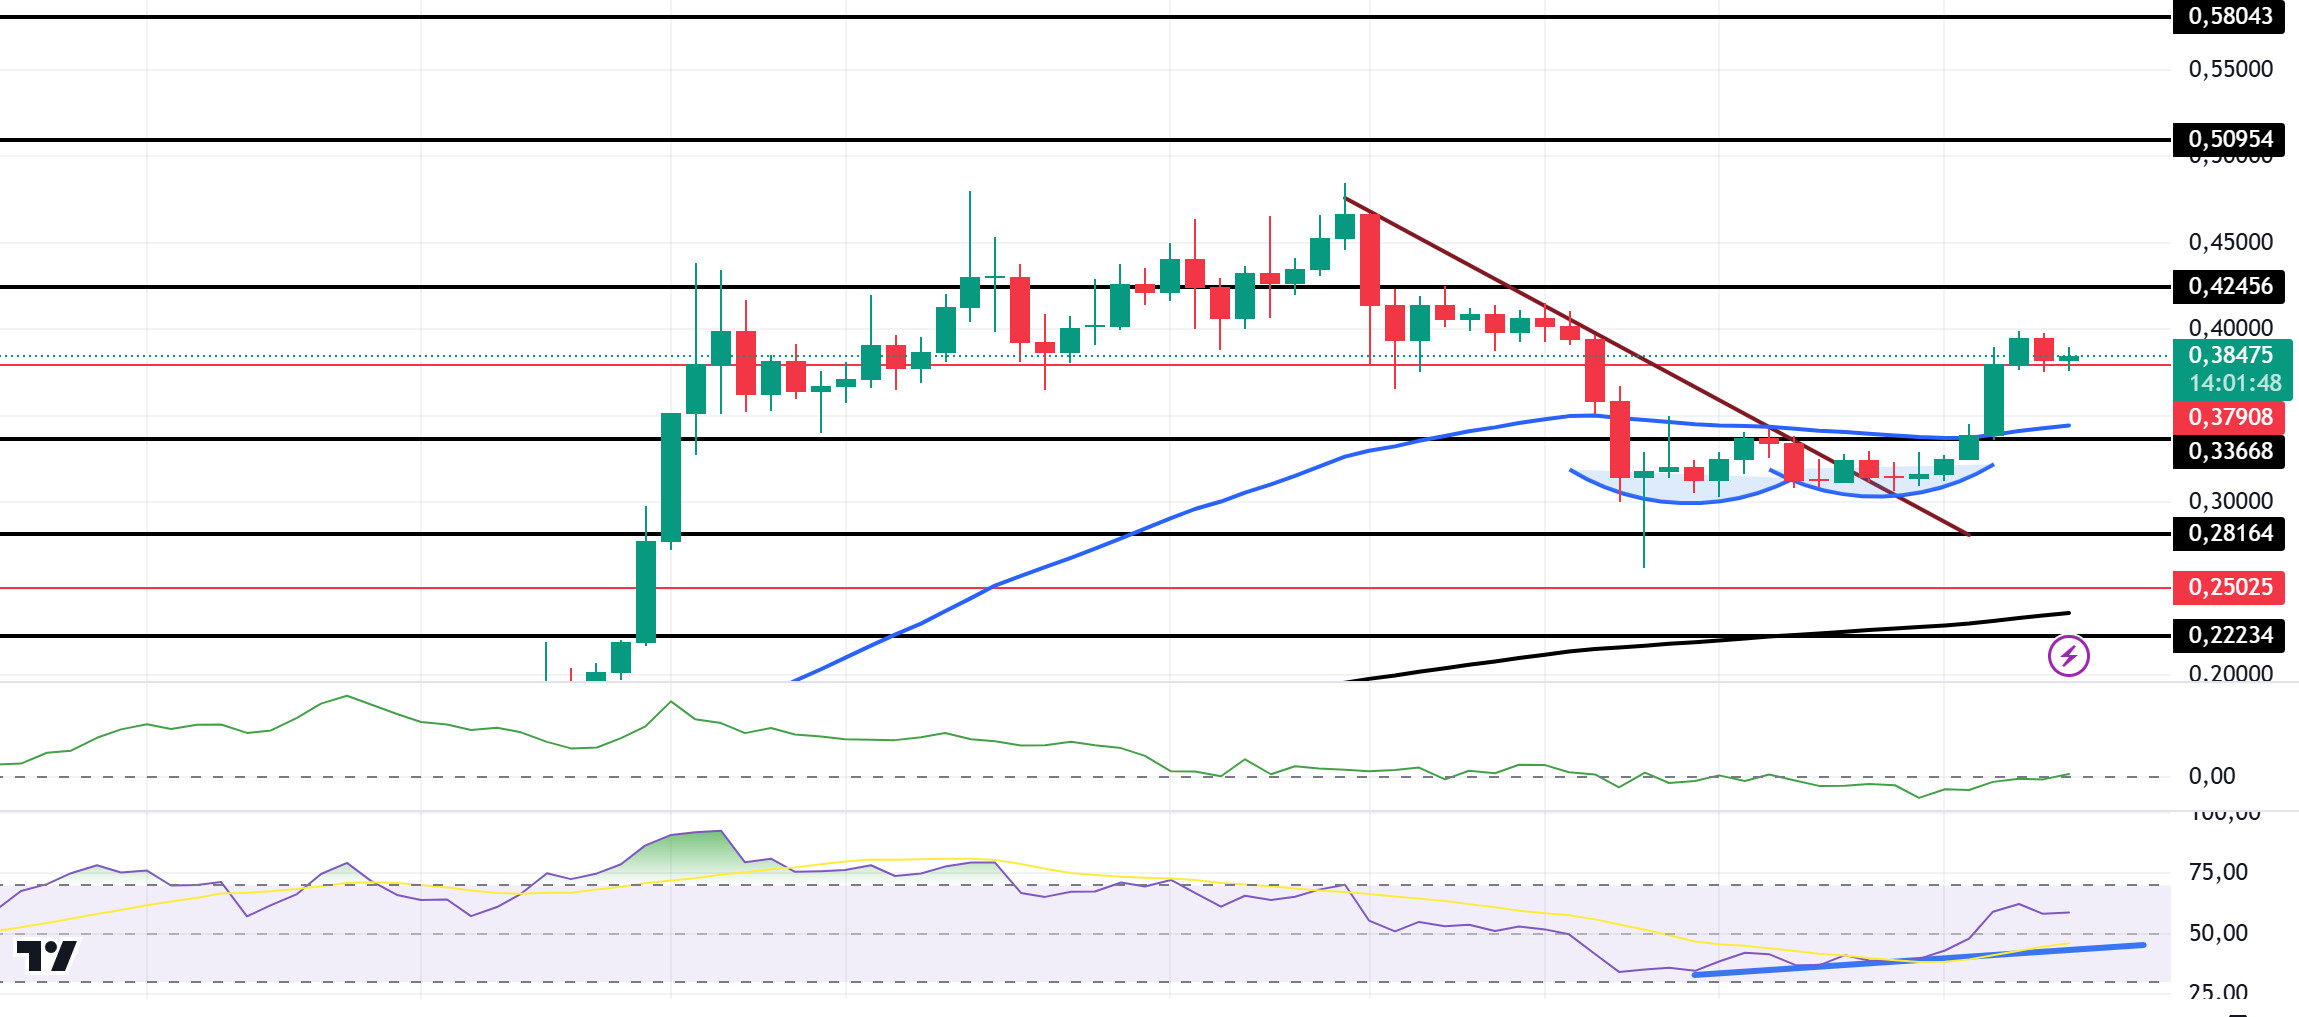
Looking at the daily chart, the 50 EMA (Blue Line) remains above the 200 EMA (Black Line), indicating that the bull continues for the asset, but the difference between the two averages is 46.29%, increasing the possibility that the decline may continue. Also on our daily chart, the asset has been priced at the midpoint of the downtrend since December 22, forming a double bottom last week after starting to move sideways. When we look at the Chaikin Money Flow (CMF)20 indicator, money inflows approached the neutral zone from negative. Relative Strength Index (RSI)14 was in the middle of the positive zone. At the same time, an uptrend is seen on the RSI chart. This may push the price higher. In case of possible negative developments in macroeconomic conditions and ecosystem and retracements, 0.33668 can be followed as a strong support. In case of a continuation of the rises, 0.42456 should be followed as a strong resistance.
Supports: 0.37908 – 0.33668 – 0.28164
Resistances: 0.42456 – 0.50954 – 0.58043
TRX/USDT
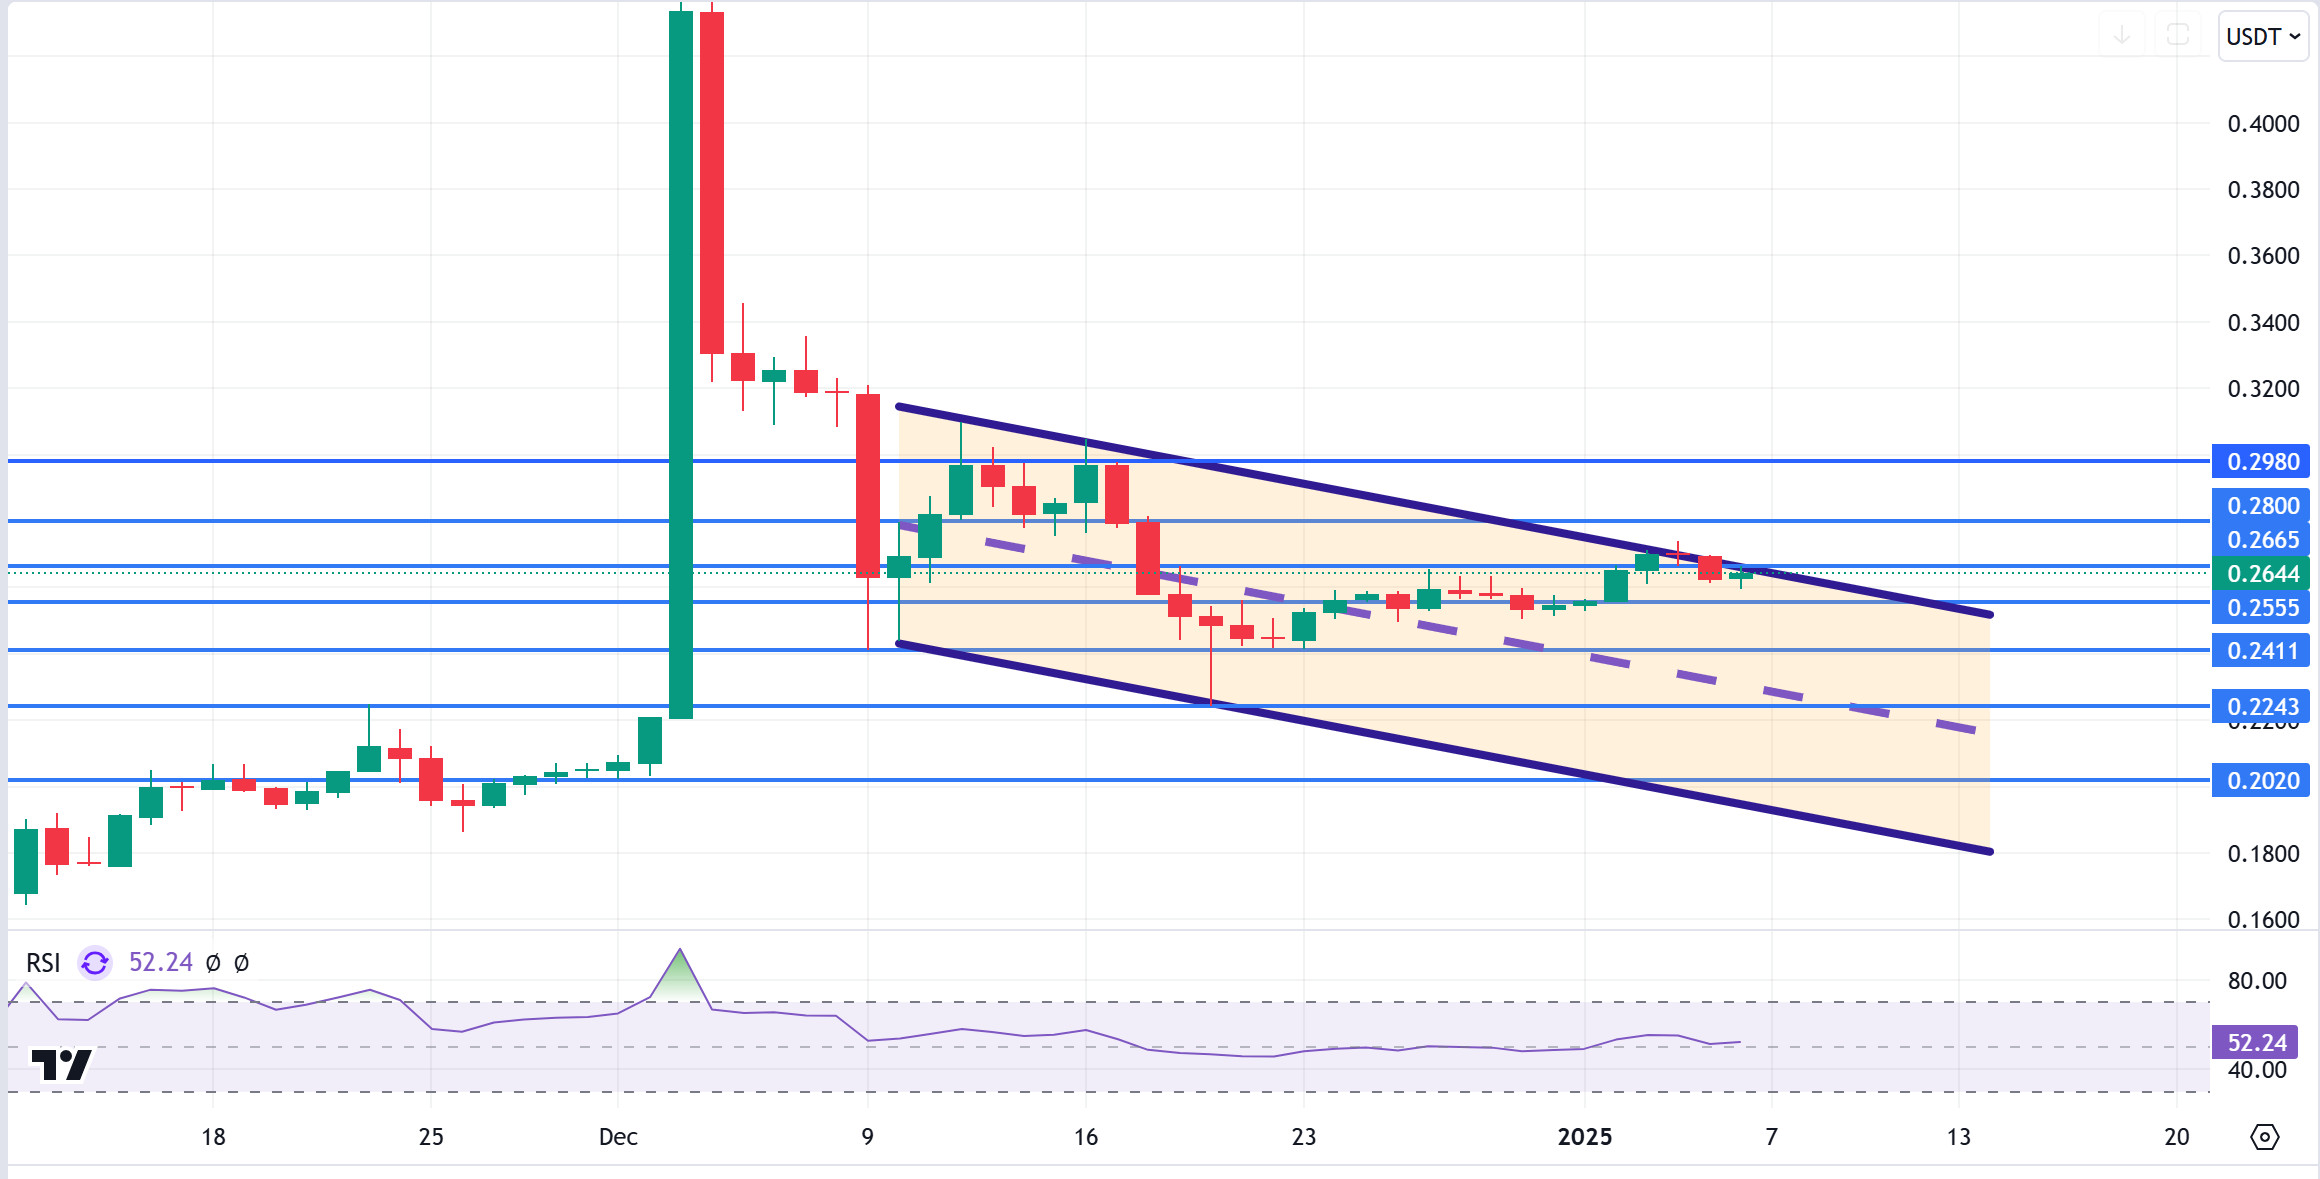
TRX, which started last week at 0.2578, rose about 2% during the week and closed the week at 0.2626. This week, unemployment benefit applications, services purchasing managers index, ISM non-manufacturing purchasing managers index, job openings and staff turnover rate, non-farm employment and unemployment rate data will be announced on the US side. In particular, the market will closely follow the non-farm employment data and if it is announced much higher than expected, it may create selling pressure for the cryptocurrency market.
TRX, currently trading at 0.2642, is in the upper band of the bearish channel on the daily chart. With a Relative Strength Index value of 52, it can be expected to decline slightly from its current level and move towards the bearish channel middle band. In such a case, it may test the 0.2555 and 0.2411 supports. If it cannot close daily below 0.2555 support, it may rise with the buying reaction and may want to break the channel upwards. In such a case, it may test 0.2665 and 0.2800 resistances. As long as it stays above 0.2020 support on the daily chart, the bullish demand may continue. If this support is broken, selling pressure may increase.
Supports: 0.2555 – 0.2411 – 0.2243
Resistances 0.2665 – 0.2800 – 0.2980
AVAX/USDT
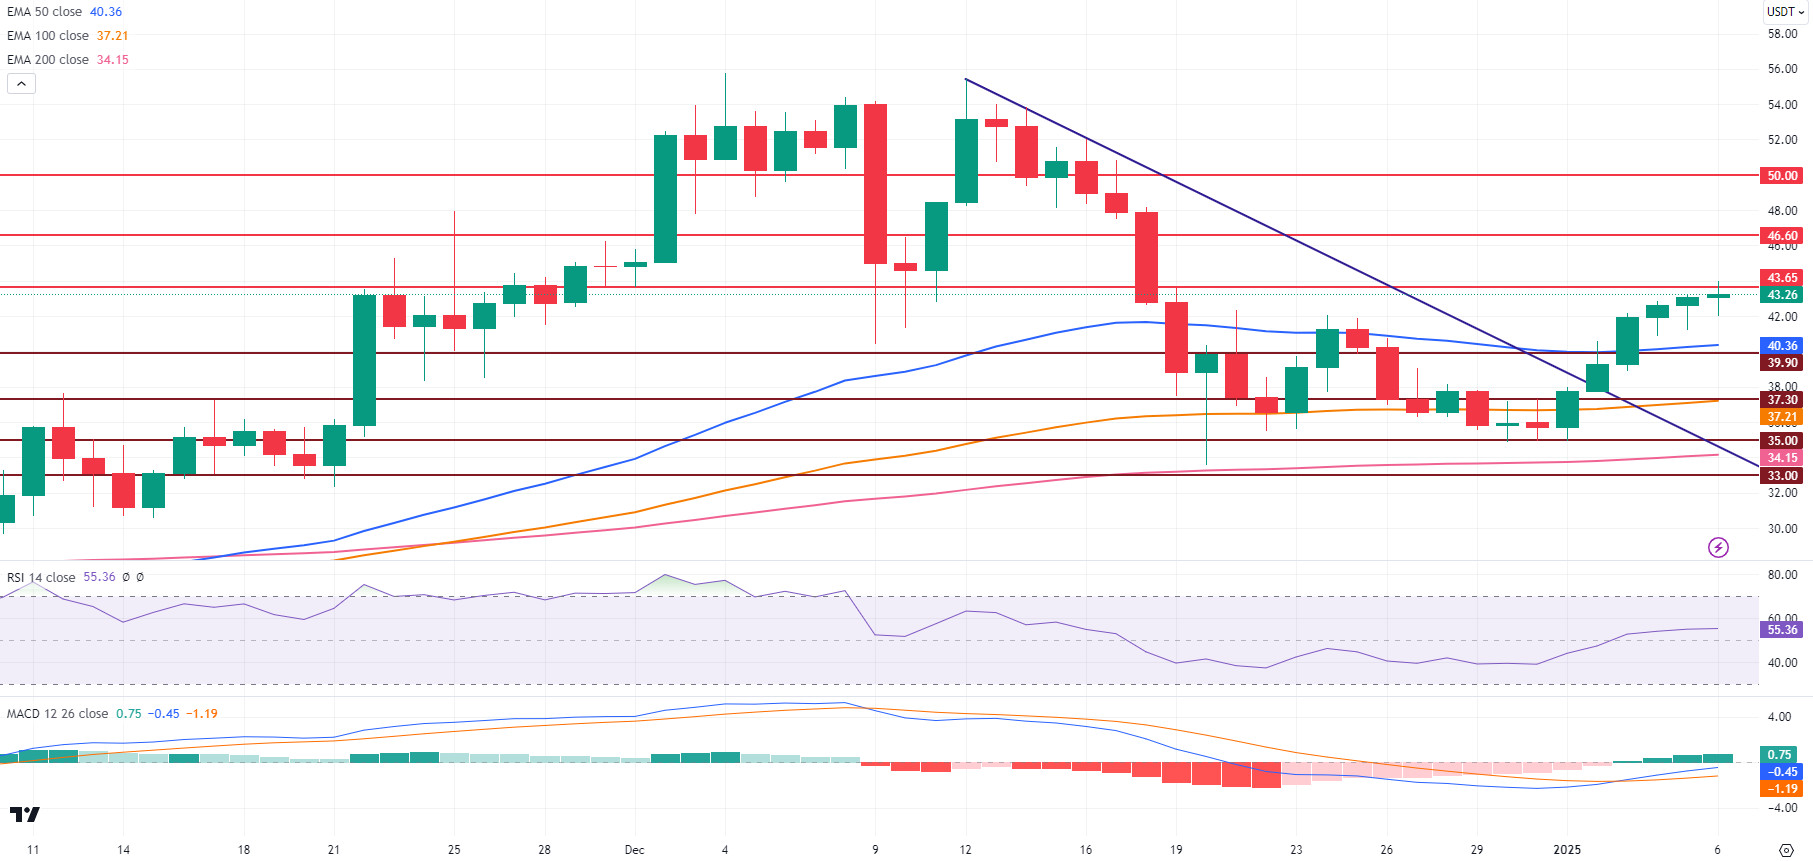
AVAX, which started last week at 35.81, closed the week at 43.11 with a strong upward movement. AVAX, which started the new week with a rise, managed to break the downtrend that has been going on since December 12 at the beginning of the new year. This may be considered as a trend reversal signal and a bullish channel pattern may form.
Moving Average Convergence/Divergence (MACD) data tends to break out of the negative zone and is above the signal line. Relative Strength Index (RSI 14) is at 55.36 and gaining strength. In case AVAX breaks the 43.65 resistance level, it may test the 46.60 level with its rise. A close above 46.60 may support the rise towards the 50.00 psychological resistance level. The RSI rising above the 60 level and the MACD gaining strength in the positive zone with its rise may strengthen AVAX’s upward momentum.
On the contrary, if AVAX turns bearish and breaks the 39.90 support level, it may fall to 37.30 and 100-period Exponential Moving Average (EMA100) support levels. If it closes below these levels, the decline may deepen towards 35.00 and EMA200 support levels. RSI breaking below the 50 level and MACD crossing below the signal line could reinforce this possible bearish momentum.
AVAX continues its upward movement, but exceeding the 43.65 level and closing above the 46.60 level is critical in terms of strengthening the upward momentum. Otherwise, closes below support levels may increase selling pressure and cause the price to experience a deeper decline.
(EMA50: Blue Line , EMA100: Orange Line , EMA200: Pink Line)
Supports : 39.90 – 37.30 – 35.00
Resistances : 43.65 – 46.60 – 50.00
SHIB/USDT
Cremation activity in the Shiba Inu (SHIB) ecosystem increased by 2.133% in the last 24 hours, removing over 34 million SHIBs from circulation. In total, 44.6 billion SHIBs were burned during 2024. While the Community does not consider the impact of these burns to be sufficient, it considers them as a basis that can support price growth in the long term. In addition, Shytoshi Kusama, SHIB’s lead developer, gave the community a hopeful message for the future, stating that he is working on new projects and developments.
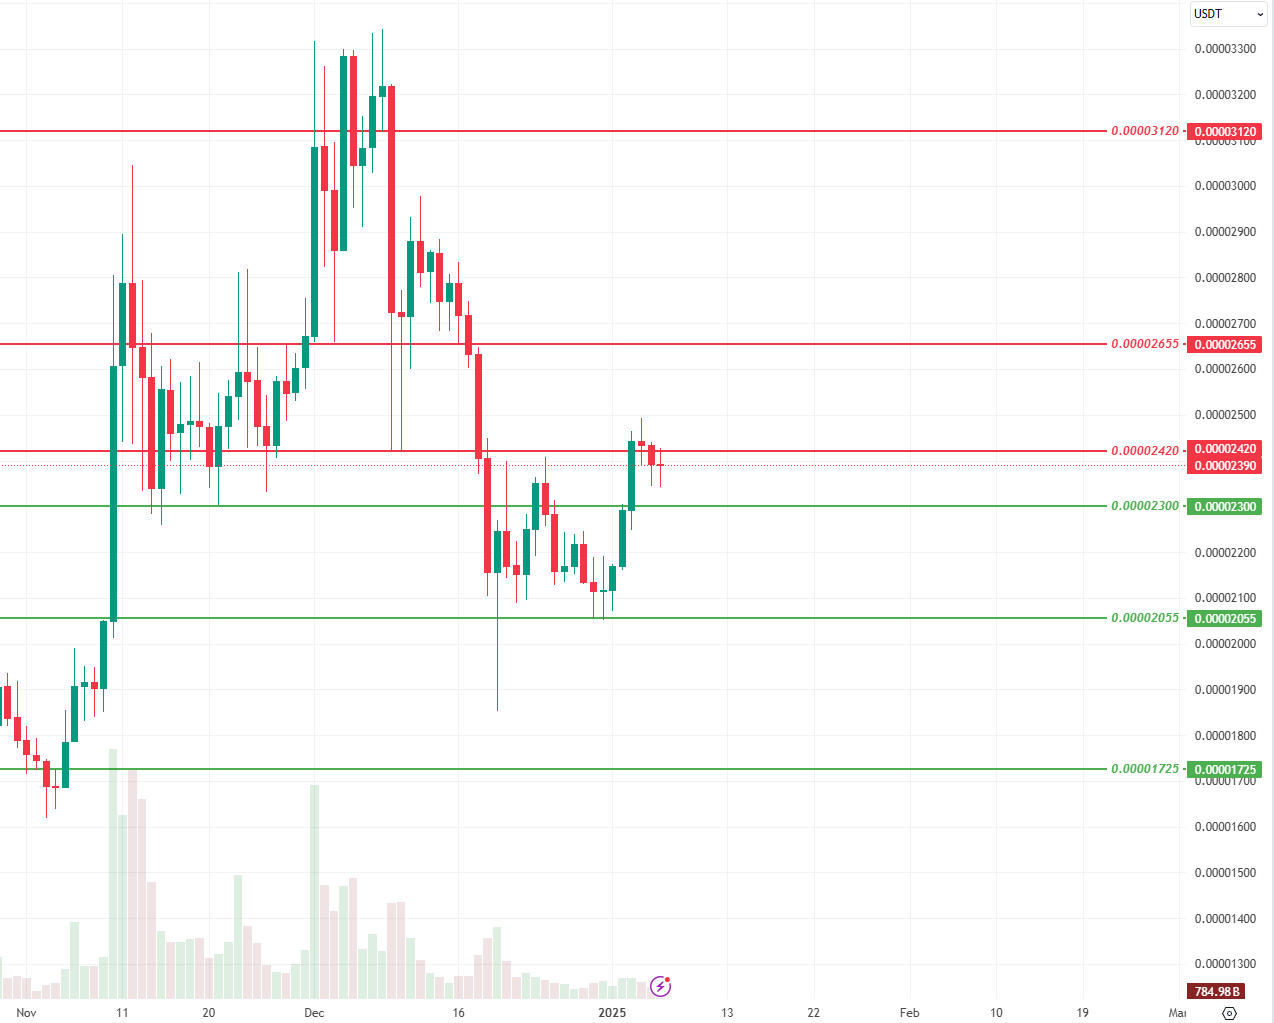
Technically Shiba Inu (SHIB) showed an increase towards the resistance level of 0.00002420 with the reaction it received from the 0.00002055 level after the positive divergence in the Relative Strength Index (RSI) and Money Flow Index (MFI) oscillators mentioned in our previous analysis. SHIB will want to break the selling pressure at 0.00002420 as long as it maintains above 0.00002300 support. If the selling pressure at this level is broken, the price may rise towards 0.00002655 levels. If the price persists below the 0.00002300 support level, we can expect a reaction from our previous support level of 0.00002055.
Supports 0.00002300 – 0.00002055 – 0.00001725
Resistances 0.00002420 – 0.00002655 – 0.00003120
LTC/USDT
LTC, which gained 17.47% last week with a positive close, started the week at 115.72. According to Arkham data, while there was a total position of 261 million dollars in futures on LTC last week, it increased to 307 million dollars this week. Funding Rate rates turned positive in all exchanges. It continues to maintain its position in 22nd place in market size.
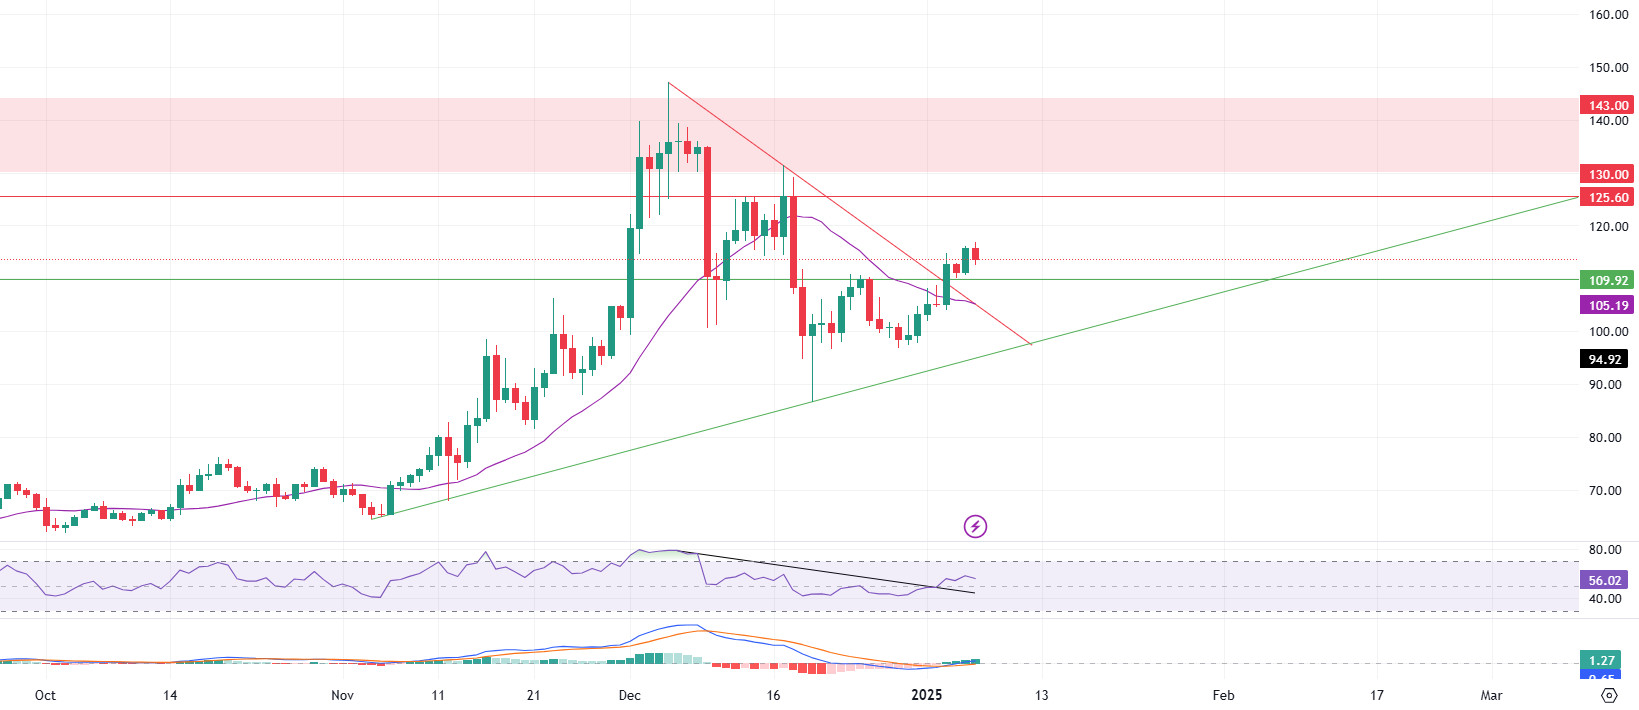
LTC’s daily chart shows that the price is above the 20-, 50- and 100-period simple moving averages and has broken the falling trend line to the upside. The Relative Strength Index (RSI) and Moving Average Divergence (MACD) indicators signal the end of the decline and the start of the uptrend. Although there are upside signals in this week’s movements, the horizontal resistance at 125.60 stands out among the levels where selling pressure may be encountered. Once this level is broken, the 130.00/143.00 area will be monitored as an important resistance area. Especially the 143.00 level can be considered as the level where strong selling pressure may be seen. In bearish scenarios, the first support level will be the horizontal support zone at 109.92. After that, the level of 105.19, where the 20-day moving average is located, can be maintained. In case of a downside break of the supports, the rising trend line (green line) crossing the 94.92 level as major support may come into play and upside movements can be expected with increased buyer intensity.
Resistances 125.60 – 130.00 – 143.00
Supports: 109.92 -105.19- 94.92
LINK/USDT
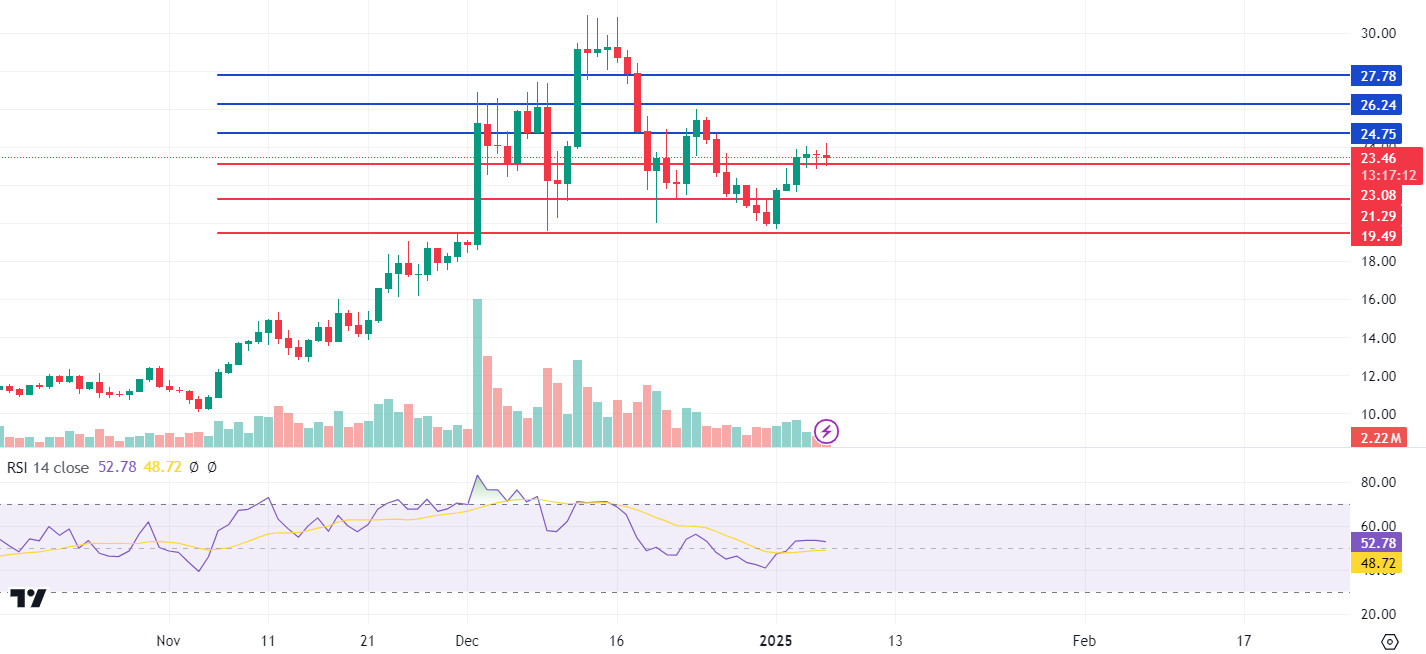
Chainlink (LINK) has been trading in a significant horizontal movement recently. The 24.75 level stands out as a critical resistance point for the price to gain upward momentum. A voluminous breakout above this level may allow the price to head towards the 26.24 and 27.78 resistance zones, respectively. However, it will be important to carefully monitor the trading volume in terms of the sustainability of the bullish movement. A rise with low volume may cause the price to bounce back from the resistance.
In downward movements, the 23.08 level appears as an important support. A daily close below this level may put the price at risk of retracement towards 21.29 and 19.49 levels, respectively. In particular, we can consider these support levels as critical areas to watch out for in case of increased selling pressure. The Relative Strength Index (RSI) is currently at 52.70, indicating a neutral outlook. A fall in the RSI below 50 may signal that selling pressure may strengthen.
Supports 23.08 – 21.29 – 19.49
Resistances 24.75 – 26.24 – 27.78
BNB/USDT
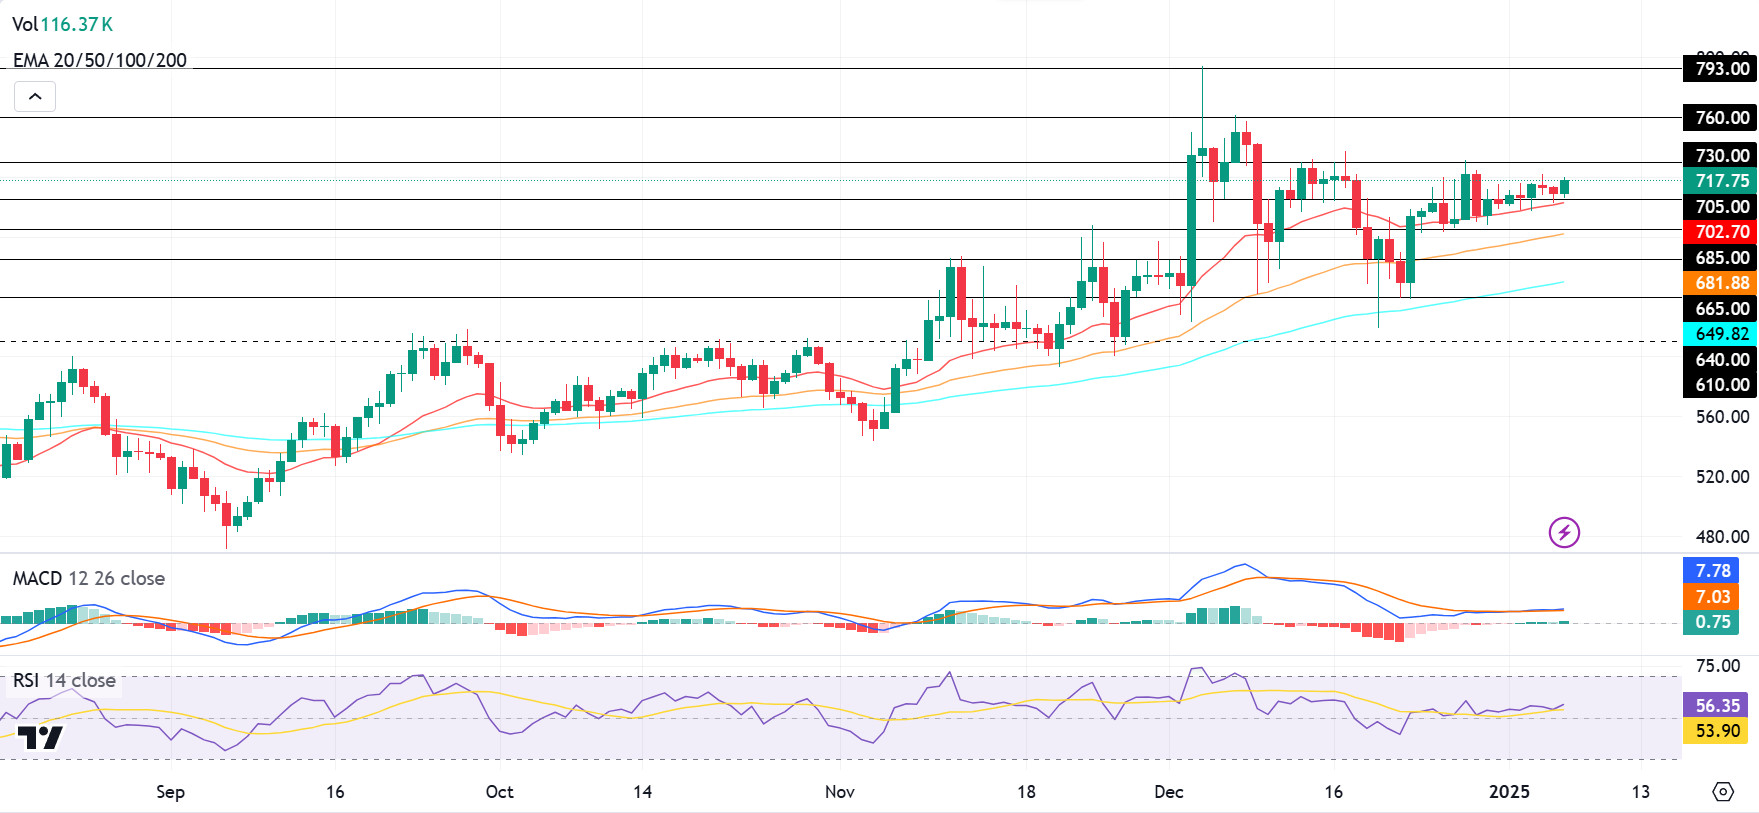
BNB/USDT, which caught a strong positive momentum with the support it received from 640 levels at the beginning of the previous week, continued to rise up to 730 levels. Despite experiencing significant pressure at this level on the last day of the week, the asset managed to maintain its positive position above the EMA 20 (red line). The asset, which continued its positive movement with the support it received from the EMA 20 region at the beginning of last week, made a positive start above the EMA 20 and 705 levels in the new week.
With the accelerated positive movement on December 23, the RSI indicator rose above the 50 level and maintained its persistence in this region. Maintaining the RSI above these levels may contribute to the continuation of the positive outlook. MACD indicator shows that positive candles reflect the buying appetite. However, it is stated that the trading volume should increase in order to strengthen the positive momentum.
In this context, if the positive momentum continues, a rise towards the 730 level is expected first. If the 730 level is broken upwards, a rise up to 760 and 793 levels may be observed, respectively. However, as a result of a possible selling pressure from the 730 level, the price is likely to retreat back towards the 705 level. If the 705 level is broken downwards, 680 and 665 levels can be followed as support zones.
Overall, BNB/USDT’s strong stance above the EMA levels and the positive signals in technical indicators suggest that the positive outlook may be sustained in the short term.
Supports 705- 680- 665
Resistances 730- 760- 793
ADA/USDT
Cardano, the ninth largest cryptocurrency, has seen a 4% increase in the last 24 hours, pushing its price above $0.959 and its market capitalization above $33 billion. This momentum points to a potential continuation of the uptrend in 2025.
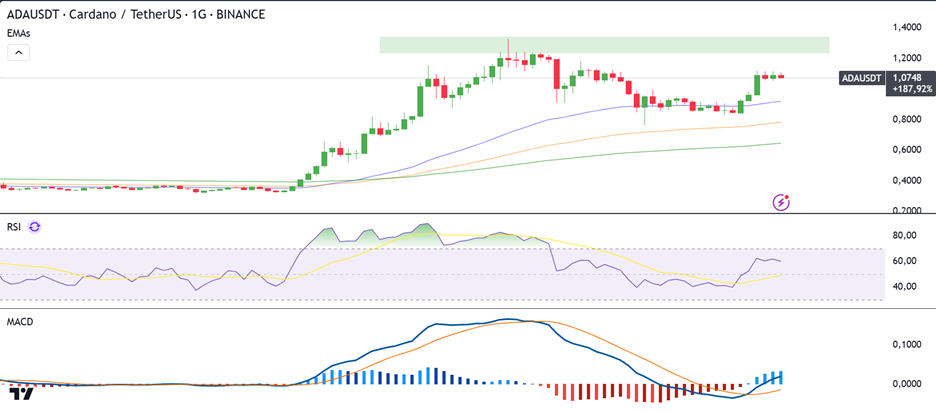
ADA, which opened at 0.8662 last week, rose as high as 1.1331 and closed the week at 1.1175. Having started the new week with a rise, the negative trend in ADA since December 19 has turned flat and started to maintain its positive effect
When we look at the technical indicators, Moving Average Convergence/Divergence (MACD) data continues to stay above the positive zone (0.0257) in ADA, which continues its horizontal trend. Momentum is seen strong in the histogram. Relative Strength Index (RSI 14) is showing a strong momentum at 61. If ADA tests the 0.9217 support level and then the 200-period Exponential Moving Average (EMA200) level and breaks it downwards, the $0.7749 and $0.8116 levels can be targeted. If ADA breaks the 1.2006 resistance (Green Line) level and rises with the possible purchases, resistance levels of 1.3117 and 1.3694 can be followed.
(EMA50: Blue Line , EMA100: Orange Line , EMA200: Green Line)
Supports: 0.7749 – 0.8116 – 0.9217
Resistances 1.2006 – 1.3117 – 1.3694
LEGAL NOTICE
The investment information, comments and recommendations contained in this document do not constitute investment advisory services. Investment advisory services are provided by authorized institutions on a personal basis, taking into account the risk and return preferences of individuals. The comments and recommendations contained in this document are of a general type. These recommendations may not be suitable for your financial situation and risk and return preferences. Therefore, making an investment decision based solely on the information contained in this document may not result in results that are in line with your expectations.


