MARKET SUMMARY
Latest Situation in Crypto Assets
| Assets | Last Price | 24h Change | Dominance | Market Cap. |
|---|---|---|---|---|
| BTC | 99,365.22 | 1.65% | 55.80% | 1,97 T |
| ETH | 3,648.87 | 0.87% | 12.48% | 439,47 B |
| XRP | 2.396 | 1.09% | 3.91% | 137,57 B |
| SOLANA | 217.97 | 2.58% | 2.99% | 105,28 B |
| DOGE | 0.3863 | 1.62% | 1.61% | 56,87 B |
| CARDANO | 1.0755 | -1.79% | 1.07% | 37,77 B |
| TRX | 0.2662 | 1.14% | 0.65% | 22,93 B |
| AVAX | 44.01 | 5.54% | 0.51% | 18,04 B |
| LINK | 23.94 | 3.50% | 0.43% | 15,22 B |
| SHIB | 0.00002418 | 1.92% | 0.40% | 14,23 B |
| DOT | 7.704 | 1.80% | 0.34% | 11,81 B |
*Prepared on 1.6.2025 at 14:00 (UTC)
WHAT’S LEFT BEHIND
MicroStrategy Resumes Classic Monday Purchases
MicroStrategy announced that the company purchased 101 Bitcoins at a total cost of approximately $1,070 million and an average purchase price per Bitcoin of $94,004. As of January 5, 2025, the company’s total Bitcoin holdings reached 447,470, with a total purchase cost of approximately $27.97 billion and an average purchase price per Bitcoin of $62,503.
MiCA May Attract More Crypto Investments Despite Overregulation Concerns
European retail investors will likely feel the biggest impact of MiCA regulations through stricter data collection and the potential introduction of crypto taxation laws.
Michael Saylor Says He Would Be Happy to Serve the Trump Administration as Crypto Advisor
Bitcoin.com MicroStrategy Chief Executive Officer Michael Saylor said he is willing to serve as a cryptocurrency advisor in the upcoming Trump administration. In an interview with Bloomberg, Saylor revealed that he has been in contact with several members of the new government, but did not confirm whether he has met with Trump.
Trump aides working on tariff plan targeting ‘every country’
Aides to US President-elect Trump are reportedly working on a tariff plan targeting “every country”, according to the Washington Post. The potential tariff plan would only target key imported goods.
New Bitcoin Step by Trump Supporter Ramaswamy
Strive Asset Management, the company of Vivek Ramaswamy, one of the biggest backers of Donald Trump in the US presidential election, has filed an application with the SEC for a new Bitcoin ETF. This fund will invest in companies that have issued/will issue bonds to buy Bitcoin in the style of MicroStrategy.
Microsoft halts construction of some OpenAI data centers in Wisconsin
Microsoft (MSFT.O) has suspended construction of a portion of the Wisconsin artificial intelligence data center that OpenAI plans to use. Microsoft said it needs to evaluate “the scope and recent technological changes” and “how this will impact the design of our facilities.”
HIGHLIGHTS OF THE DAY
Important Economic Calender Data
| Time | News | Expectation | Previous |
|---|---|---|---|
| 14:45 | US Final Services PMI (Dec) | 58.5 | 56 |
INFORMATION
*The calendar is based on UTC (Coordinated Universal Time) time zone.
The economic calendar content on the relevant page is obtained from reliable news and data providers. The news in the economic calendar content, the date and time of the announcement of the news, possible changes in the previous, expectations and announced figures are made by the data provider institutions. Darkex cannot be held responsible for possible changes that may arise from similar situations
MARKET COMPASS
Positive sentiment in European stock markets, positive figures in Wall Street futures and the retreat in the US dollar were the highlights of the traditional markets on the first trading day of the week. US indices are expected to recover some of the losses of recent days, with rises led by technology companies.
The news flow that the Trump administration is considering softer tariff measures was the main reason for the pressure on the dollar. According to Washington Post, Donald Trump’s aides are exploring tariff plans that would apply to every country but only cover critical imports. On the other hand, concerns that the Trump administration will reignite inflation and expectations that the US Federal Reserve (FED) will not rush for new interest rate cuts led to higher yields in the bond market. US 30-year bond yields rose to the highest level since 2023.
This week, US employment data to be released on Friday will be closely monitored. Among the macro indicators to be released ahead of it, we will see the services PMI data today. Whether the depreciation in the US dollar will continue or not will depend on this data and other developments.
On the digital assets front, expectations regarding the policies to be implemented by Trump, who will take over the White House on January 20, are more influential on prices. Cryptocurrencies started the week, when we expect volumes and pricing behaviors to return to normal, with an upward trend with these expectations. We anticipate that this trend may continue with intermediate respites in the rest of the day.
From the short term to the big picture…
The victory of former President Trump on November 5, which was one of the main pillars of our bullish expectation for the long-term outlook in digital assets, produced a result in line with our predictions. Afterwards, the appointments made by the president-elect and the increasing regulatory expectations for the crypto ecosystem in the US and the emergence of BTC as a reserve continued to take place in our equation as positive variables. Although it is expected to continue at a slower pace, the FED’s signal that it will continue its interest rate cut cycle and the volume in crypto asset ETFs indicating an increase in institutional investor interest (in addition to MicroStrategy’s BTC purchases, BlackRock’s BTC ETF options starting to trade…) support our upward forecast for the big picture for now. In the short term, given the nature of the market and pricing behavior, we think it would not be surprising to see occasional pause or pullbacks in digital assets. However, at this point, it is worth emphasizing again that the fundamental dynamics remain bullish.
TECHNICAL ANALYSIS
BTC/USDT
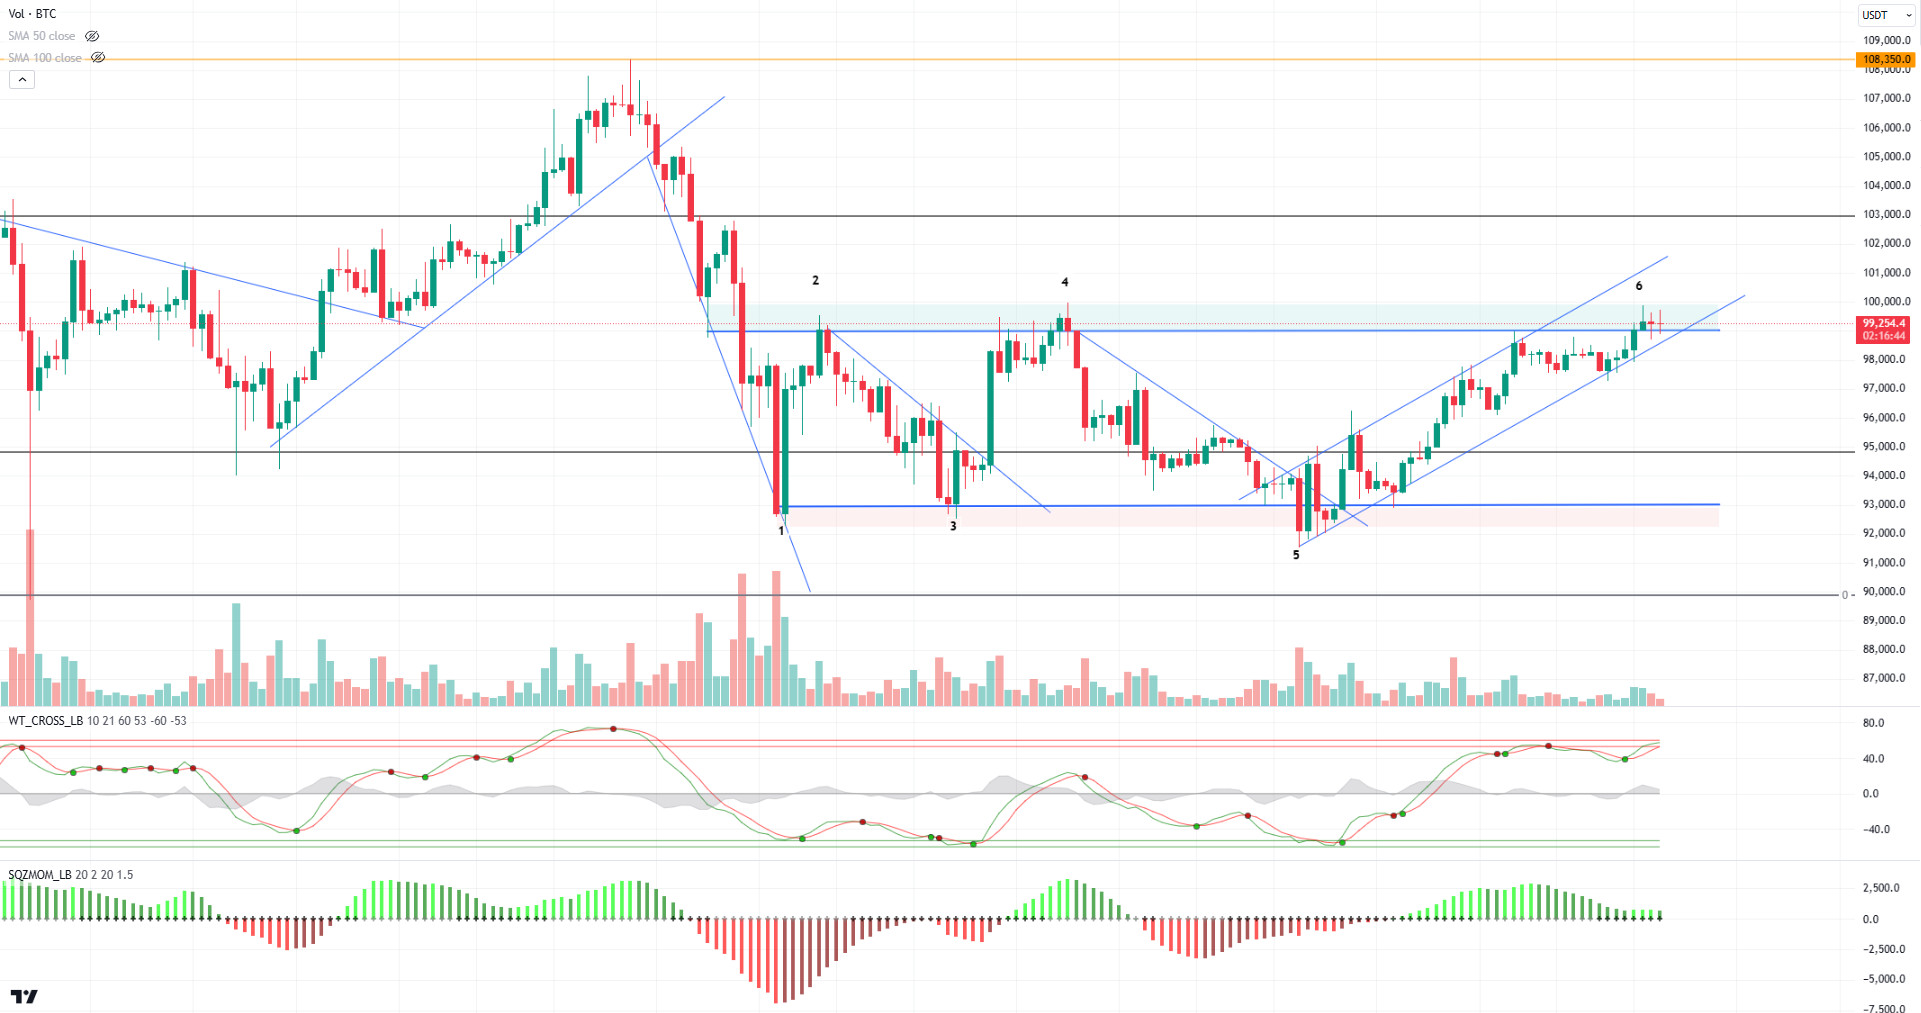
According to CoinShares’ latest report, global digital asset investment product inflows reached a record high of $44.2 billion in 2024, nearly four times the record set in 2021. Among them, Bitcoin attracted inflows of $38 billion, with assets accounting for 29% of total assets under management. The week that included the last two trading days of 2024 saw net outflows of $75 million. But in 2025, it started strongly, with inflows of $585 million in the first three days. On the other hand, Microstrategy bought 94,000 Bitcoin this Monday, as it does every Monday, with an average of about 1070.
Looking at the technical outlook with the latest developments, BTC continues to push six-digit levels within the rising trend channel. While technical oscillators continue to maintain the buy signal in BTC, which is currently trading at 99,500 above the resistance level of 99,100, the momentum indicator draws a weak picture. BTC, which was previously rejected and retreated from levels 2 and 4, seems likely to exceed this level this time. When we look at the weekly liquidation chart, short transactions between 100,000 and 103,000 levels attract attention, while these levels can be targeted in the continuation of the rise. In a possible pullback, we can say that the rectangle pattern may work again and the bullish channel structure may be disrupted. In this direction, we will follow the minor support levels of 98,000 and then 97,200.
Supports 99,100 – 98,000 – 97,200
Resistances 101,400 – 103,800 – 105,000
ETH/USDT
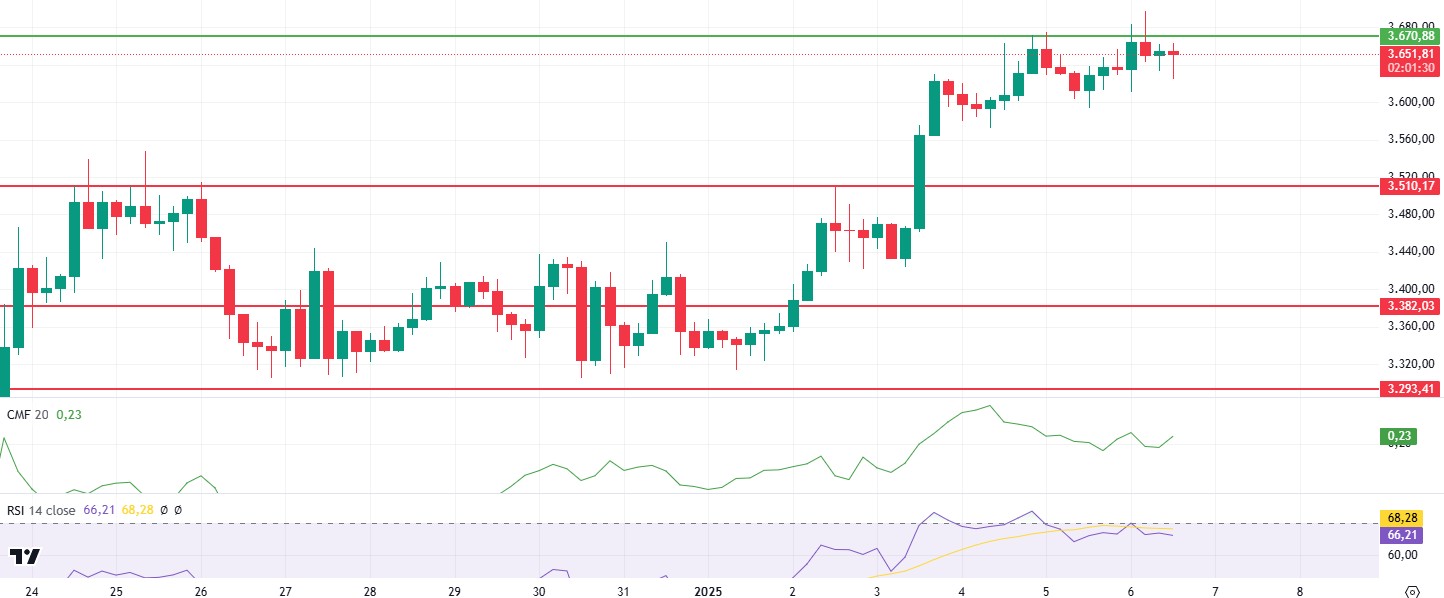
After losing the 3,670 level during the day, Ethereum retreated to 3,640 levels with the effect of selling pressure. Among the main reasons for this movement, the effect of the low demand seen on the spot market in Cumulative Volume Delta (CVD) data stands out.
Negative divergence is observed in the Chaikin Money Flow (CMF) indicator. This confirms that the market money flow is concentrated in the direction of selling and the downward pressure on the price continues. Negative divergence is also evident in Relative Strength Index (RSI) data. RSI shows that the price is losing momentum and the downward trend continues. When critical levels are analyzed, the $3,670 level stands out as a strong resistance point. In case the price cannot exceed this level in volume, it seems likely that downward movements will continue. Below this level, $3,510 is followed as intermediate support. If the $3,510 level is also lost, it can be assessed that selling pressure will increase and the price will test lower levels.
On the other hand, for an upward movement, the price needs to break the $3,670 level in a voluminous way and maintain its permanence above this zone. However, current technical indicators and spot market data suggest that the bearish trend continues in the short term
Supports 3,510 – 3,382- 3,293
Resistances 3,670 – 3,841 – 4,001
XRP/USDT
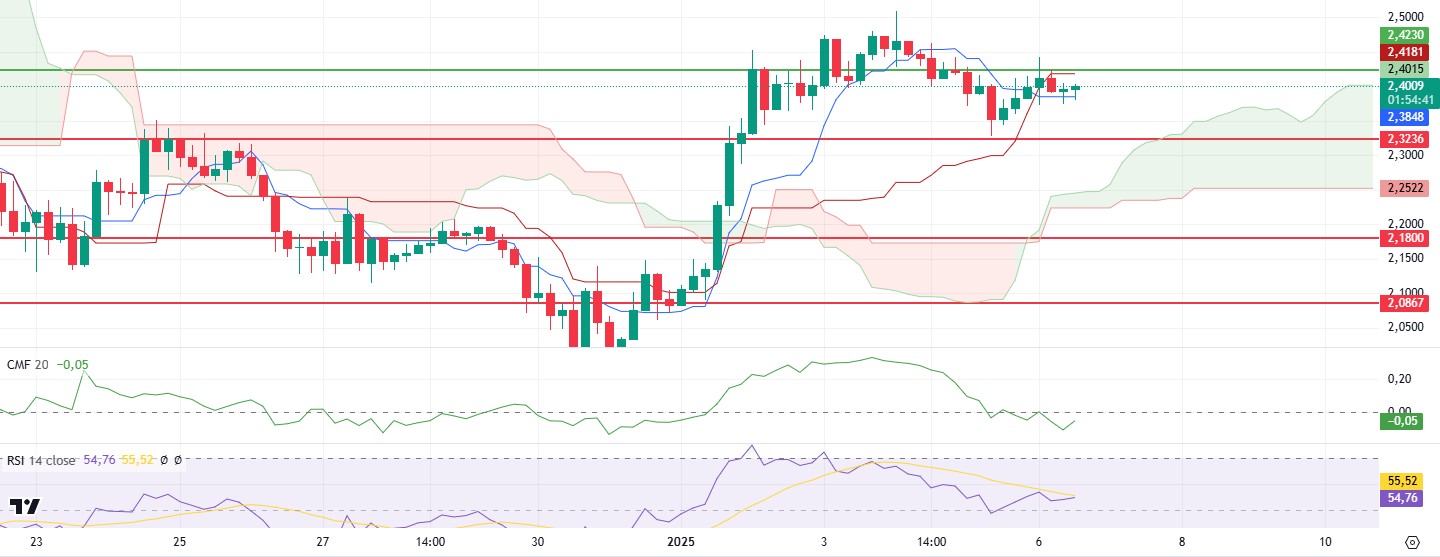
XRP retested this level in the morning hours after losing the critical $2.42 level with the fall it experienced over the weekend. However, the failure to break through this level, which works as resistance, causes the price to remain in a sideways movement. The “sell” signal, which is still valid on the Ichimoku indicator, indicates that the downward pressure on the market continues. The RSI indicator is far from the overbought zone and remains bearish, indicating that the price is struggling to gain upside momentum. The ongoing negative trend in the Chaikin Money Flow (CMF) indicator confirms that capital flows are concentrated on the sell side. Buyer interest in the spot market is seen to be weak.
The $2.42 level, which works as XRP’s current resistance point, is decisive for price action in the short term. If this level is exceeded in volume, the negative outlook on the market can be broken and upward momentum movements can be seen. However, if it stays below this level, XRP can be expected to continue its downward movement. In this scenario, the price is likely to test the next support zones
Supports 2.3236 – 2.1800 – 2.0867
Resistances 2.4230 – 2.6180 – 2.8528
SOL/USDT
Solayer, one of Solana’s leading restaking applications, officially announced the decentralization of its protocol.
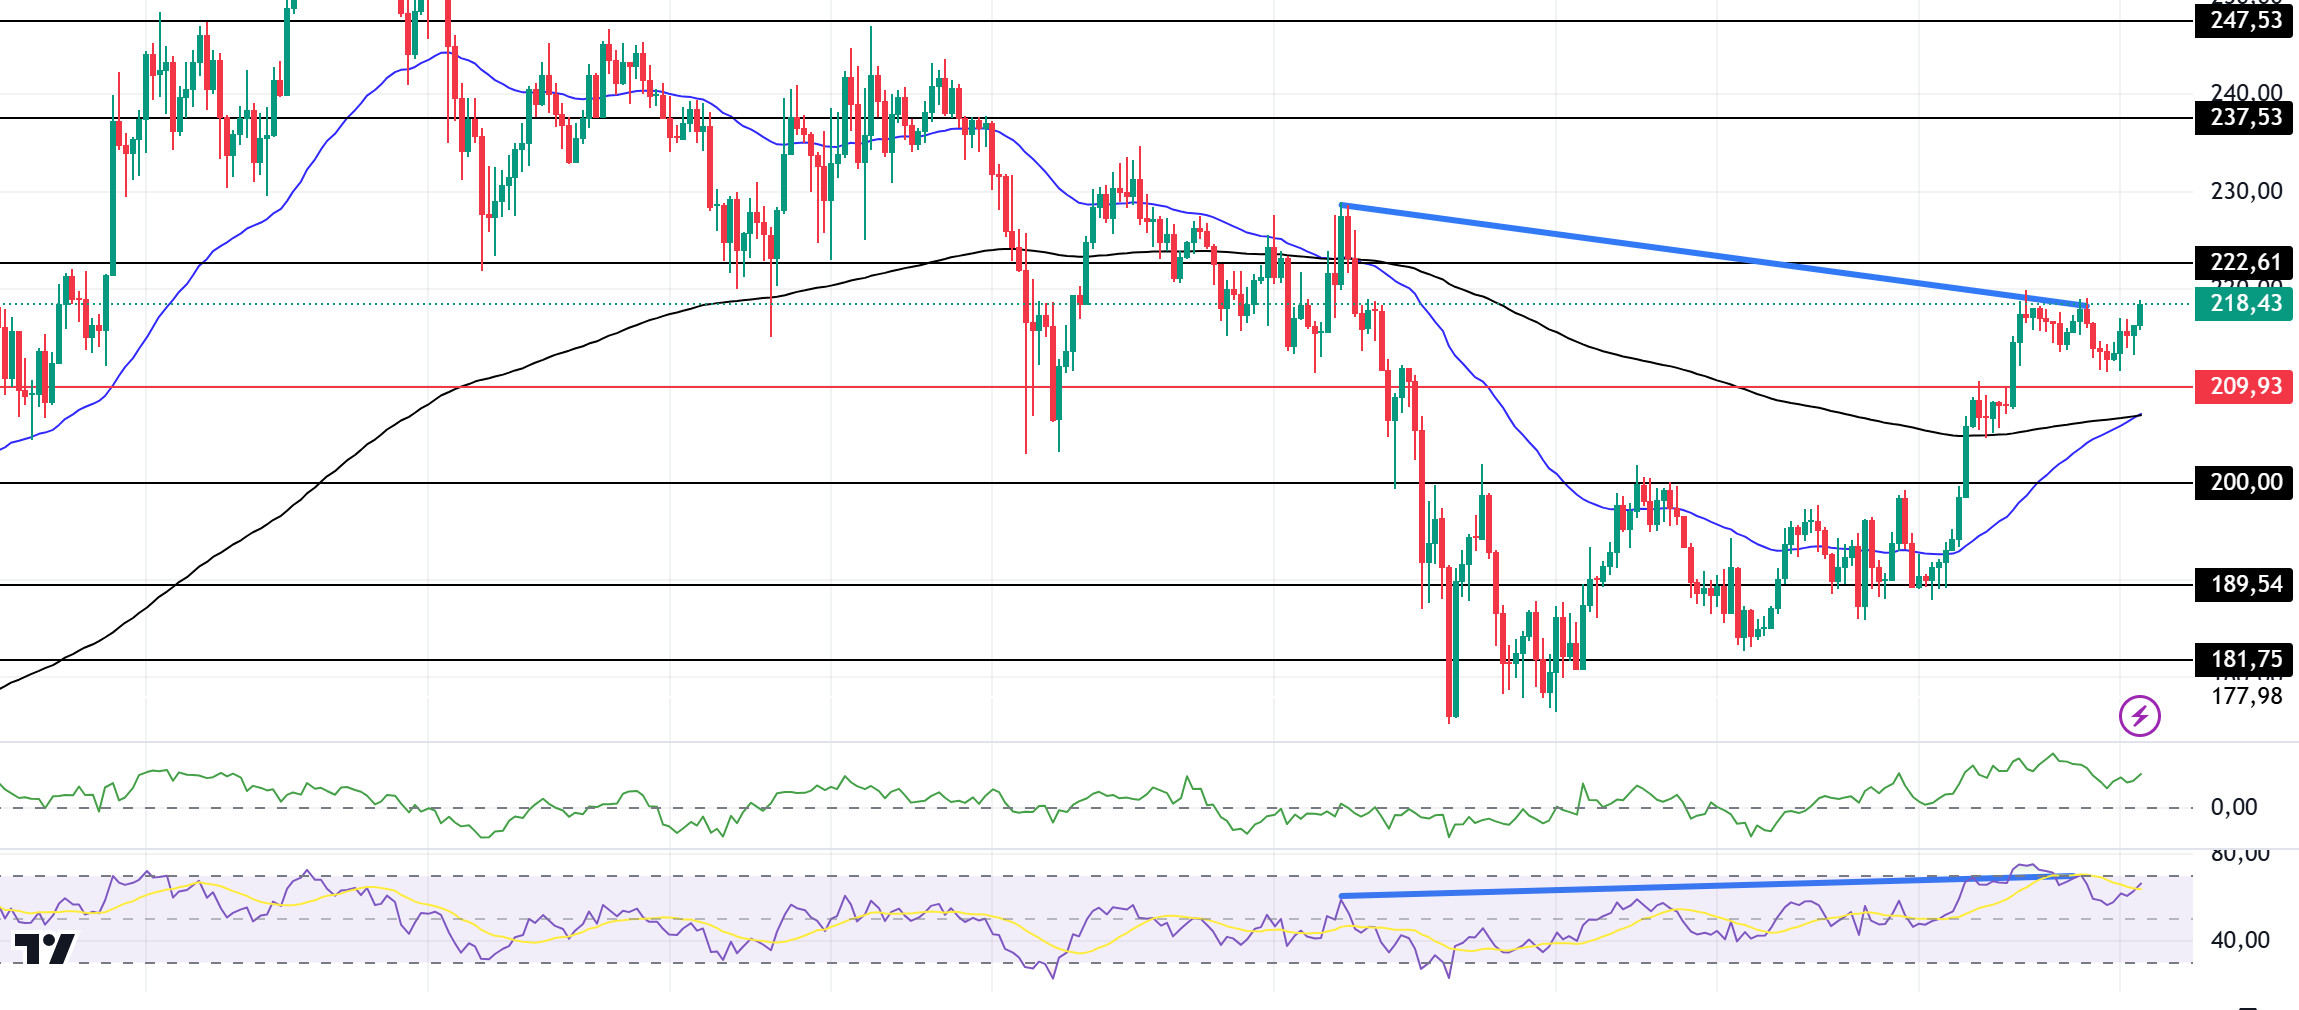
SOL broke the major resistance level of 209.93 with a voluminous candle. On the 4-hour timeframe, the 50 EMA (Blue Line) is at the same level as the 200 EMA (Black Line). If the 50 EMA breaks the 200 EMA to the upside, it could start a medium-term uptrend. Chaikin Money Flow (CMF)20 indicator is in positive territory and money inflows seem to have increased. However, the Relative Strength Index (RSI)14 indicator reached the overbought level. At the same time, bearish divergence should be taken into account. This may start the decline again. The 247.53 level appears to be a very strong resistance point in the rises driven by both the upcoming macroeconomic data and the news in the Solana ecosystem. If it breaks here, the rise may continue. In case of retracements for the opposite reasons or due to profit sales, the 200.00 support level can be triggered. If the price reaches these support levels, a potential bullish opportunity may arise if momentum increases.
Supports 209.93 – 200.00 – 189.54
Resistances 222.61 – 237.53 – 247.53
DOGE/USDT
Elon Musk aims to pay for the X platform with DOGE. According to Forbes, leaked information suggests that X Money will launch soon without approval from all states in the US. Alex Finn noted that changes to the platform code indicate that the launch is being accelerated.
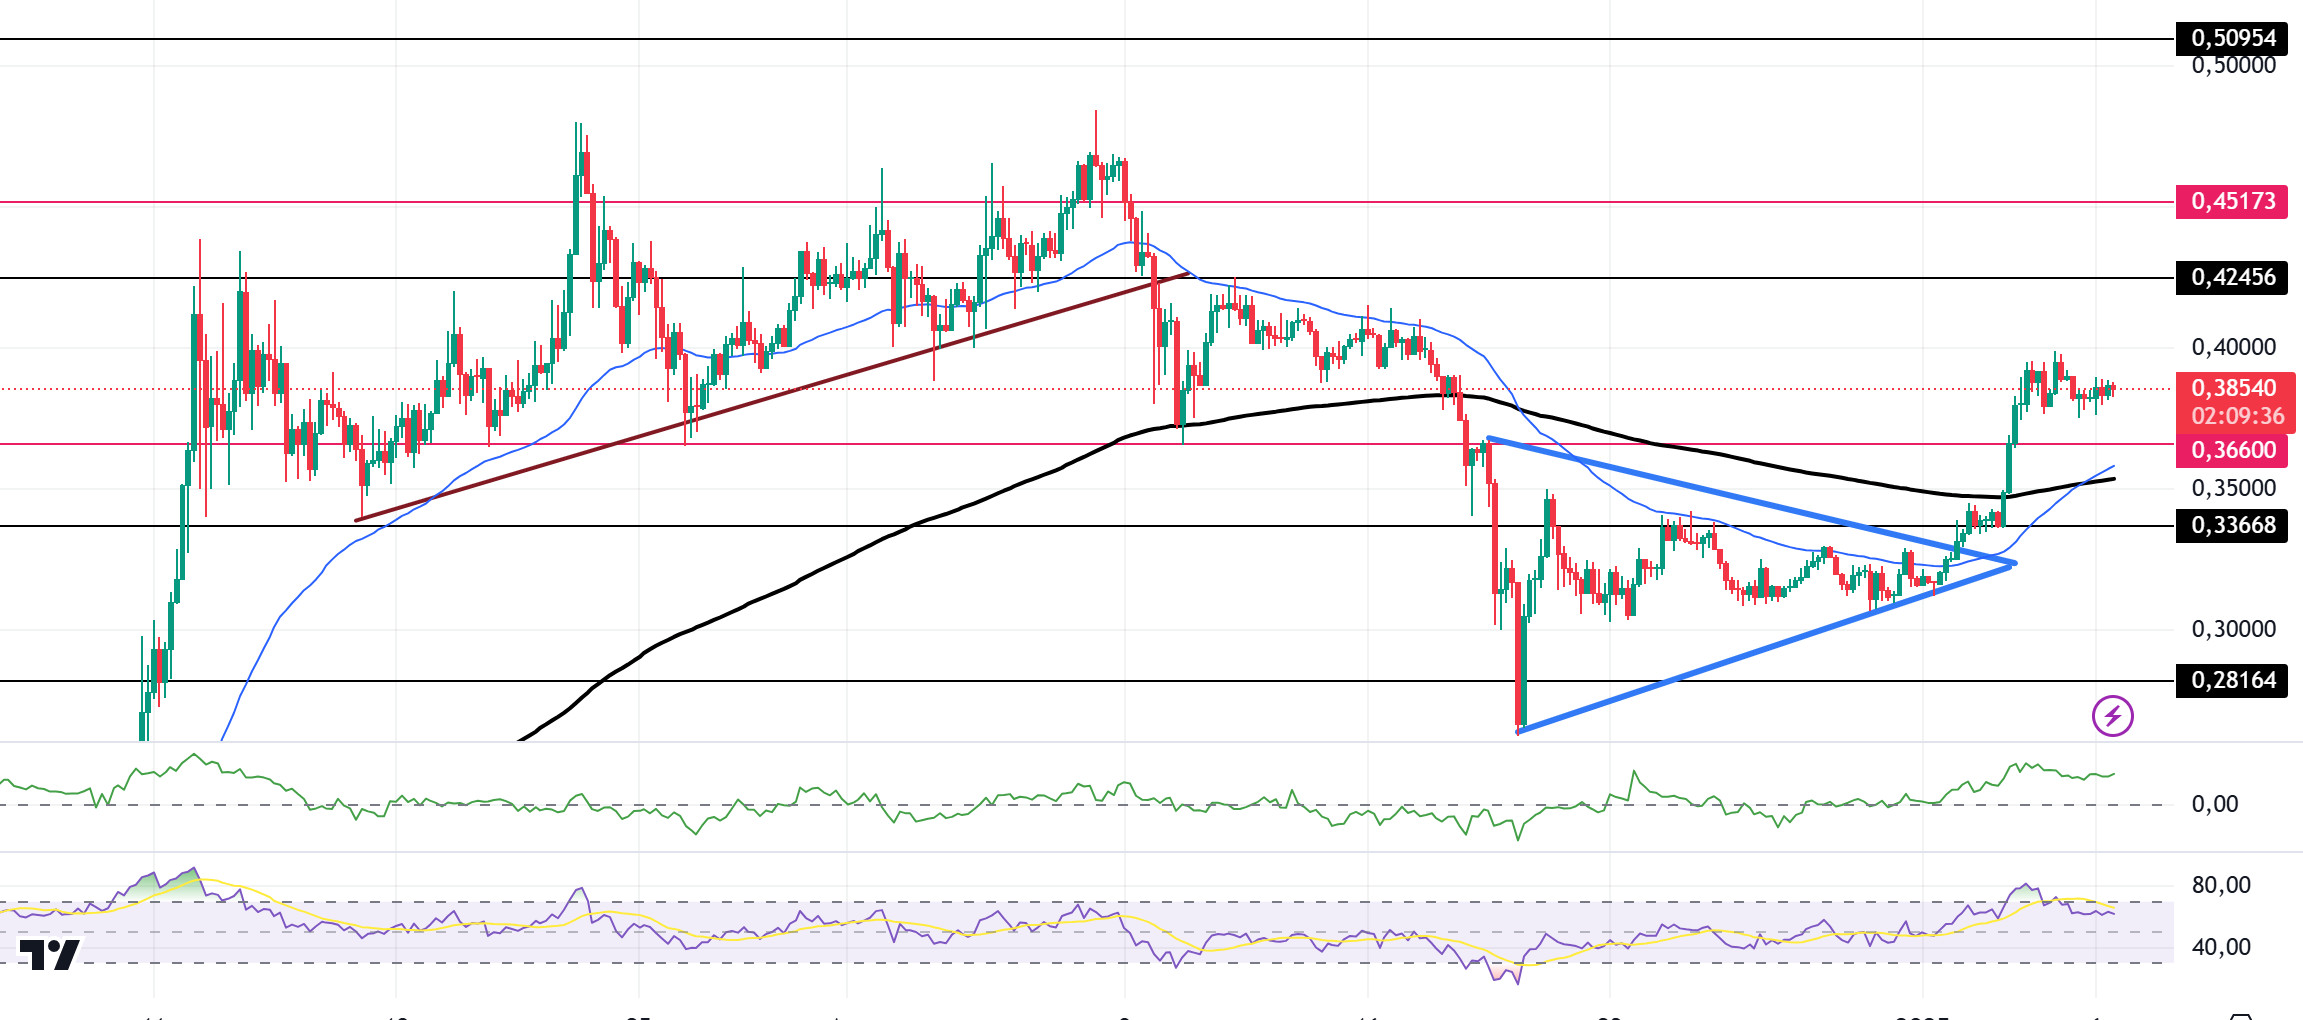
When we look at the chart, the asset, which has been moving horizontally since December 20, gained momentum with the increase in volume and broke both the 0.33668 resistance, which is the ceiling of the horizontal level, and the symmetrical triangle pattern upwards. Since our analysis in the morning, the horizontal asset has moved away from the overbought zone by accumulating the swelling RSI indicator. This could be a bullish harbinger. On the 4-hour timeframe, the 50 EMA (Blue Line) broke the 200 EMA to the upside. This may reinforce the uptrend. When we examine the Chaikin Money Flow (CMF)20 indicator, it is in positive territory and money inflows are also increasing. However, Relative Strength Index (RSI)14 is in positive territory. The 0.42456 level stands out as a very strong resistance point in the rises driven by both the upcoming macroeconomic data and the innovations in the Doge coin. If DOGE catches a new momentum and rises above this level, the rise may continue strongly. In case of possible pullbacks due to macroeconomic reasons or negativity in the ecosystem, the 0.33668 level, which is the base level of the trend, is an important support. If the price reaches these support levels, a potential bullish opportunity may arise if momentum increases.
Supports 0.36600 – 0.33668 – 0.28164
Resistances 0.42456 – 0.45173 – 0.50954
LEGAL NOTICE
The investment information, comments and recommendations contained herein do not constitute investment advice. Investment advisory services are provided individually by authorized institutions taking into account the risk and return preferences of individuals. The comments and recommendations contained herein are of a general nature. These recommendations may not be suitable for your financial situation and risk and return preferences. Therefore, making an investment decision based solely on the information contained herein may not produce results in line with your expectations.


