MARKET SUMMARY
Latest Situation in Crypto Assets
| Assets | Last Price | 24h Change | Dominance | Market Cap. |
|---|---|---|---|---|
| BTC | 95,340.92 | -6.34% | 56.79% | 1,89 T |
| ETH | 3,311.81 | -9.88% | 11.99% | 398,97 B |
| XRP | 2.274 | -7.07% | 3.93% | 130,88 B |
| SOLANA | 193.85 | -10.40% | 2.82% | 93,93 B |
| DOGE | 0.3412 | -12.63% | 1.51% | 50,32 B |
| CARDANO | 0.9654 | -12.10% | 1.02% | 33,95 B |
| TRX | 0.2467 | -8.87% | 0.64% | 21,29 B |
| AVAX | 37.62 | -14.71% | 0.47% | 15,44 B |
| LINK | 20.57 | -12.90% | 0.40% | 13,15 B |
| SHIB | 0.00002125 | -11.82% | 0.38% | 12,52 B |
| DOT | 6.734 | -13.90% | 0.31% | 10,32 B |
*Prepared on 1.8.2025 at 07:00 (UTC)
WHAT’S LEFT BEHIND
US CFTC Chairman Warns Crypto Regulator
US Commodity Futures Trading Commission (CFTC) Chairman Rostin Behnam emphasized that the regulation of digital assets, including Bitcoin and other cryptocurrencies, is insufficient, the Financial Times reported. Behnam stated that there is a regulatory “vacuum” in the US crypto market and that digital assets need to be more tightly regulated. He also announced that he will step down on January 20, 2025, when Donald Trump will be inaugurated as president.
Ripple CEO Shares Dinner Photo with Trump
Ripple CEO Brad Garlinghouse, along with Ripple Chief Legal Officer Stuart Alderoty, shared a photo taken during a dinner with US President-elect Donald Trump at Mar-a-Lago on the X platform. He captioned the photo as “A strong start to 2025”.
Ripple and Chainlink Collaborate on RLUSD Usage
Ripple announced that it will use Chainlink’s oracle network to integrate its stablecoin RLUSD into the DeFi ecosystem. Ripple made an official announcement about this collaboration that will enable the use of RLUSD in DeFi projects, stating that this step aims to spread the use of stablecoins to a wider ecosystem.
Backpack Exchange Acquires FTX EU: A New Era in Europe
Backpack Exchange announced the acquisition of FTX EU, the European arm of FTX. With this acquisition, Backpack Exchange will become a regulated platform for perpetual futures and other crypto derivatives in Europe. The platform is expected to be operational in the first quarter of 2025.
Former Vice President of the Bank of China on Trump’s Bitcoin Policy
Wang Yongli, former vice governor of the Bank of China, published an article on Bitcoin titled “A Rational View of Trump’s New Bitcoin Policy”. In the article, he stated that Bitcoin is perceived as a “digital gold” that imitates gold, but it is not a physical asset. Stating that the value of Bitcoin depends on the belief of users and the scope of application scenarios, Yongli warned that Bitcoin could quickly become worthless in case of loss of trust.
Pump.Fun’s Big SOL Transfer
Pump.Fun deposited another 98,593 SOLs worth $20 million on the Kraken exchange. With this investment, it sent a total of 1,662,648 SOL ($340 million) to Kraken. So far, it has earned 2,127,036 SOL ($431.51 million).
HIGHLIGHTS OF THE DAY
Important Economic Calender Data
| Time | News | Expectation | Previous |
|---|---|---|---|
| Yield Guild Games (YGG) | GAP Season 8 Extension Announcement | — | — |
| 13:15 | US ADP Nonfarm Employment Change (Dec) | 139K | 146K |
| 13:30 | US Unemployment Claims | 214K | 211K |
| 13:30 | US FOMC Member Waller Speaks | — | — |
| 19:00 | US FOMC Meeting Minutes | — | — |
INFORMATION
*The calendar is based on UTC (Coordinated Universal Time) time zone. The economic calendar content on the relevant page is obtained from reliable news and data providers. The news in the economic calendar content, the date and time of the announcement of the news, possible changes in the previous, expectations and announced figures are made by the data provider institutions. Darkex cannot be held responsible for possible changes that may arise from similar situations.
MARKET COMPASS
In global markets, US macro indicators shape expectations regarding the Federal Reserve’s (FED) interest rate cut course and shape asset prices. After yesterday’s positive data, bond yields rose and stock market indices fell. The markets were positioning themselves that the FED might not be in a hurry to cut interest rates again. After the sharp decline in Wall Street indices yesterday, futures contracts pointed to a slight rise, but European futures are slightly down.
Digital assets were affected by the short-term shift in global markets’ risk appetite and pricing behavior yesterday. After the recent pullbacks, we can expect a breather and a pause due to the nature of the market. However, at a time when markets are increasingly sensitive to US data and expectations regarding the FED, today’s news flow may be decisive in terms of direction.
US markets, which will be closed tomorrow due to the holiday, will monitor weekly jobless claims and ADP private sector employment figures today. In addition, the statements of Waller, one of the Federal Open Market Committee (FOMC) members, will be under the scrutiny of investors. Lastly, Atlanta Fed President Rapahel Bostic stated that he thinks the FED will adopt a cautious stance on interest rate cuts. Following these developments, the minutes of the last FOMC meeting will be published and markets will look for clues about the interest rate cut course between the lines.
Ahead of Friday’s critical employment data, if today’s ADP private sector employment change indicator is realized above expectations of 139 thousand, the recent declines in digital assets may continue. However, a data below the forecast may have a slight recovery effect on prices.
From the short term to the big picture.
The victory of former President Trump on November 5, which was one of the main pillars of our bullish expectation for the long-term outlook in digital assets, produced a result in line with our predictions. Afterwards, the appointments made by the president-elect and the expectations of increased regulation of the crypto ecosystem in the US continued to be a positive variable in our equation. Although it is expected to continue at a slower pace, the FED’s signal that it will continue its interest rate cut cycle and the volume in crypto asset ETFs indicating an increase in institutional investor interest (in addition to MicroStrategy’s BTC purchases, BlackRock’s BTC ETF options start trading…) support our upward forecast for the big picture for now. In the short term, given the nature of the market and pricing behavior, we think it would not be surprising to see occasional pauses or pullbacks in digital assets. However, at this point, it is worth emphasizing again that the fundamental dynamics continue to be bullish.
TECHNICAL ANALYSIS
BTC/USDT
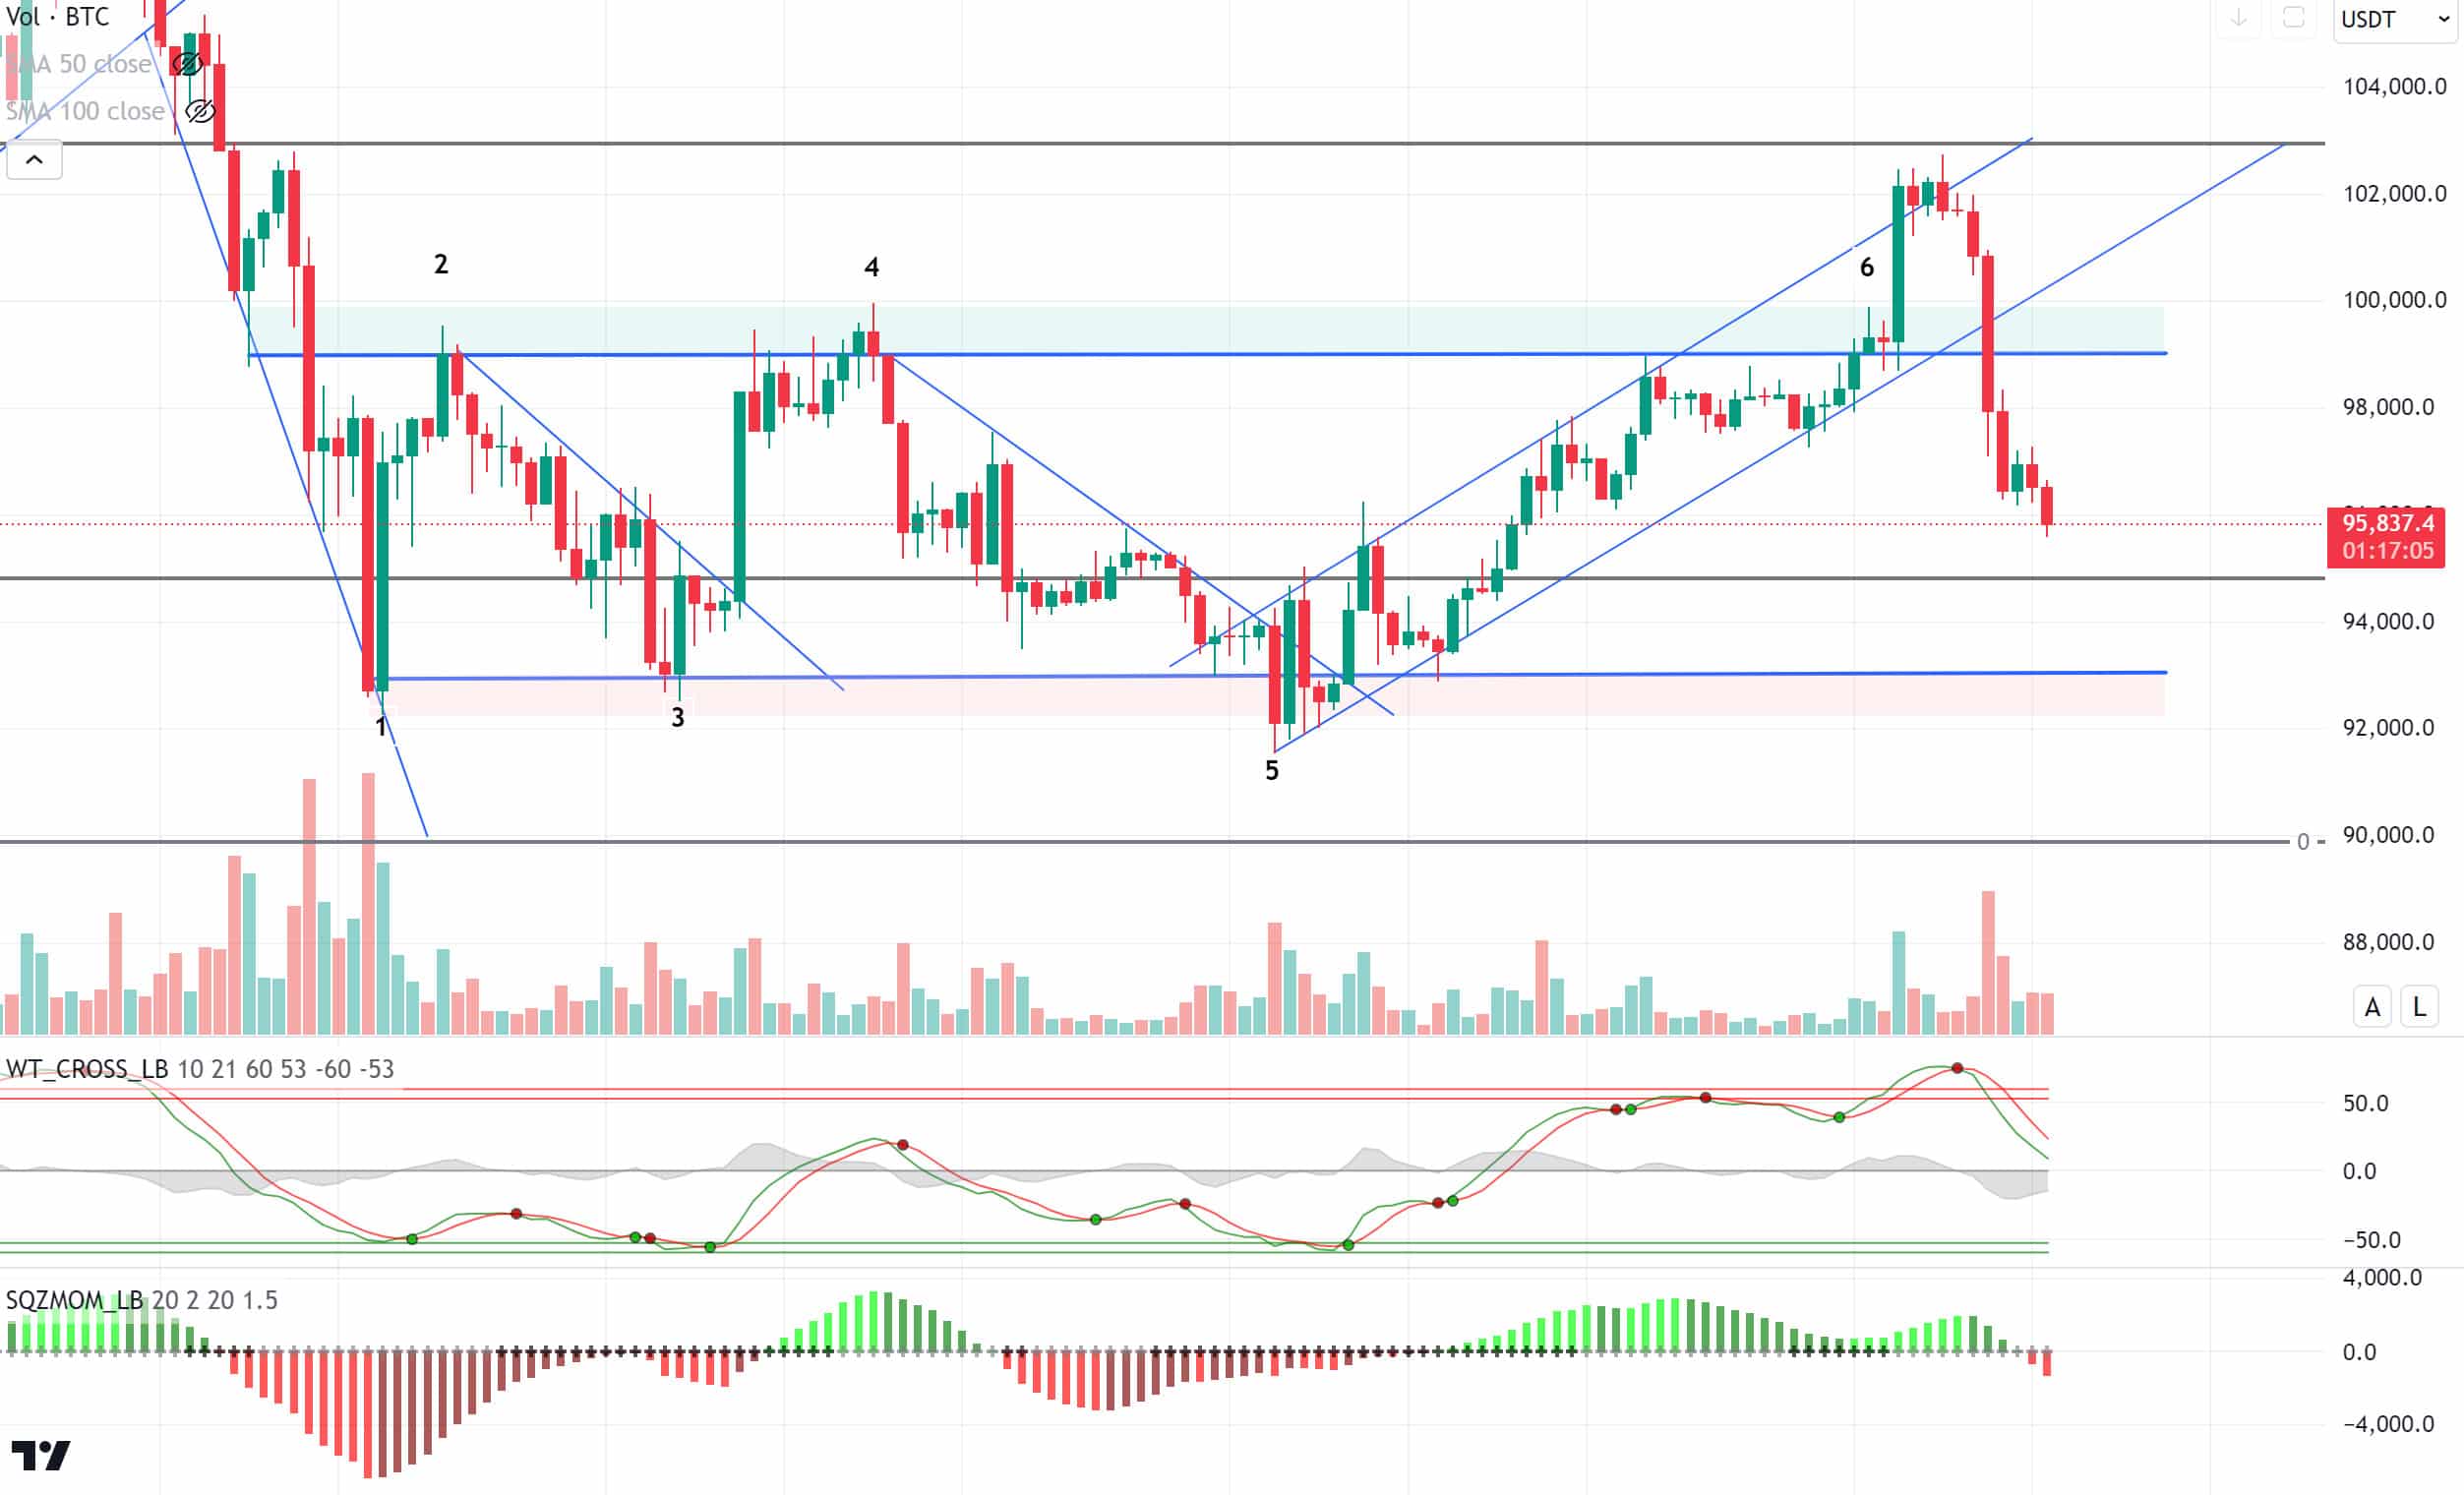
With the recent decline in Bitcoin, liquidations of long transactions opened on the weekly liquidation side took place, while Bitcoin spot ETFs continued to see a net inflow of $ 53.5 million. With yesterday’s decline, the decline to 95,800 in Bitcoin, which reached 102,700 from 91,700 in the first two weeks of the year, can be seen as a correction of the rally it started. While all these developments were taking place, D. Trump’s emphasis that interest rates were high could not prevent the correction.
Looking at the technical outlook, BTC, which tested and failed to cross the upper line of the uptrend, returned to the trend channel during the day. In response to the sell signal given by technical oscillators, the weakening seen in the momentum indicator heralded a decline in the price. The accumulation of long transactions at 96,000 and 97,000, which we mentioned in the previous analysis, brought these levels with the decline. The 95,000 level can be seen as critical support in BTC, which is currently trading at 95,800 and sales pressure continues. While persistence above this level is seen as important for recovery and regaining upward momentum, the support points of the rectangle pattern come back to the agenda in the down break.
Supports 95,000 – 92,800 – 91,700
Resistances 97,200 – 98,000 – 99,100
ETH/USDT
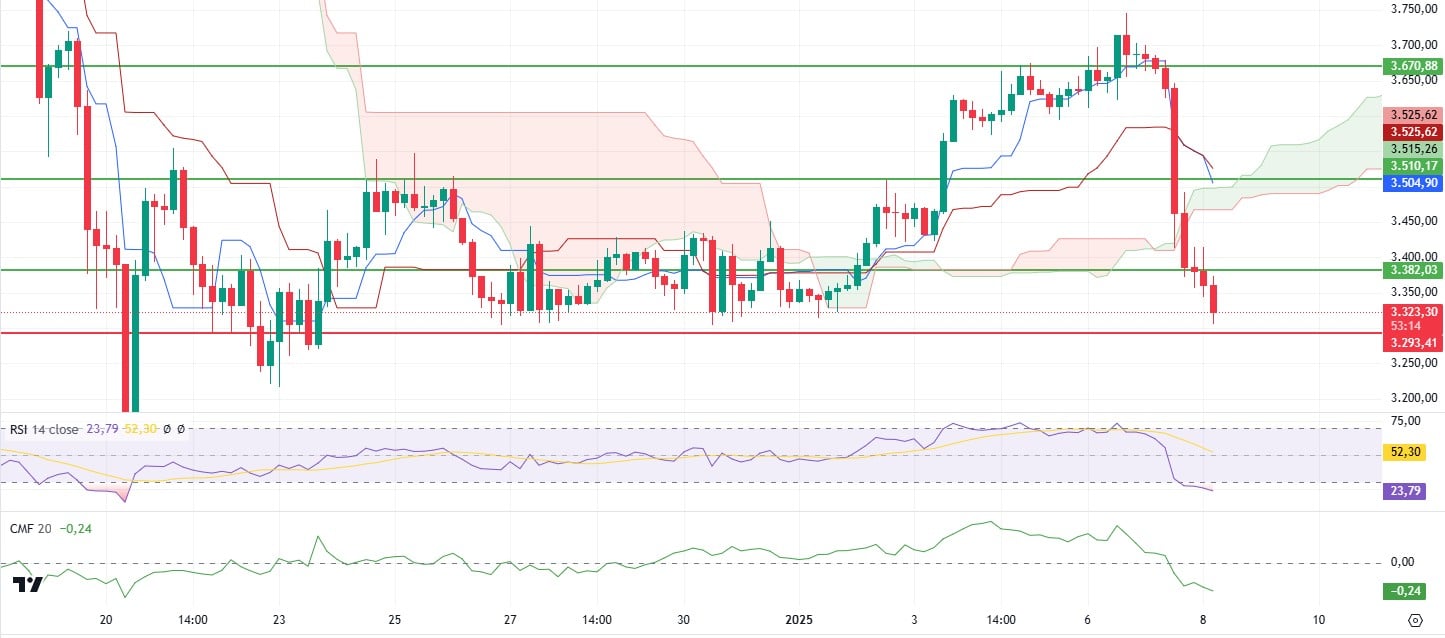
The higher-than-expected PMI and JOLTS data released yesterday evening created strong selling pressure for ETH, leading to the loss of critical support levels. After these developments, ETH is trying to hold on to the 3,330 levels, but technical indicators in the market indicate that the downtrend continues. The better-than-expected macroeconomic data reduced risk appetite in global markets and was an important catalyst that triggered sales in crypto markets.
The Ichimoku indicator shows that the market structure is weakening as ETH dips below the kumo cloud. The negative intersection between the Tenkan and Kijun lines supports the bearish movement. The loss of the kumo cloud makes the weakness signal even more pronounced in the short and medium term. On the other hand, the Relative Strength Index (RSI) continues its downtrend after entering the oversold territory. As of now, the RSI is not signaling any recovery, suggesting that the price may be subject to further selling pressure. Similarly, Chaikin Money Flow (CMF) is also in negative territory, indicating that selling pressure is still strong and buyers are struggling to step in.
The 3,293 level, one of the most critical support levels for ETH, is currently the focal point of the market. Although it seems technically possible to see a reaction buy from this level, if this support is broken, it is possible that the declines will harden and the price will fall to lower levels. In order for an upward movement to begin, it is critical to exceed the 3,382 level again. However, in the current situation, there is not enough momentum for a recovery in the market. A positive change in macroeconomic data or a strong catalyst to improve market perception may be needed for the market to change direction.
Supports 3,293 – 3,131 – 3,033
Resistances 3,382 – 3,510 – 3,670
XRP/USDT
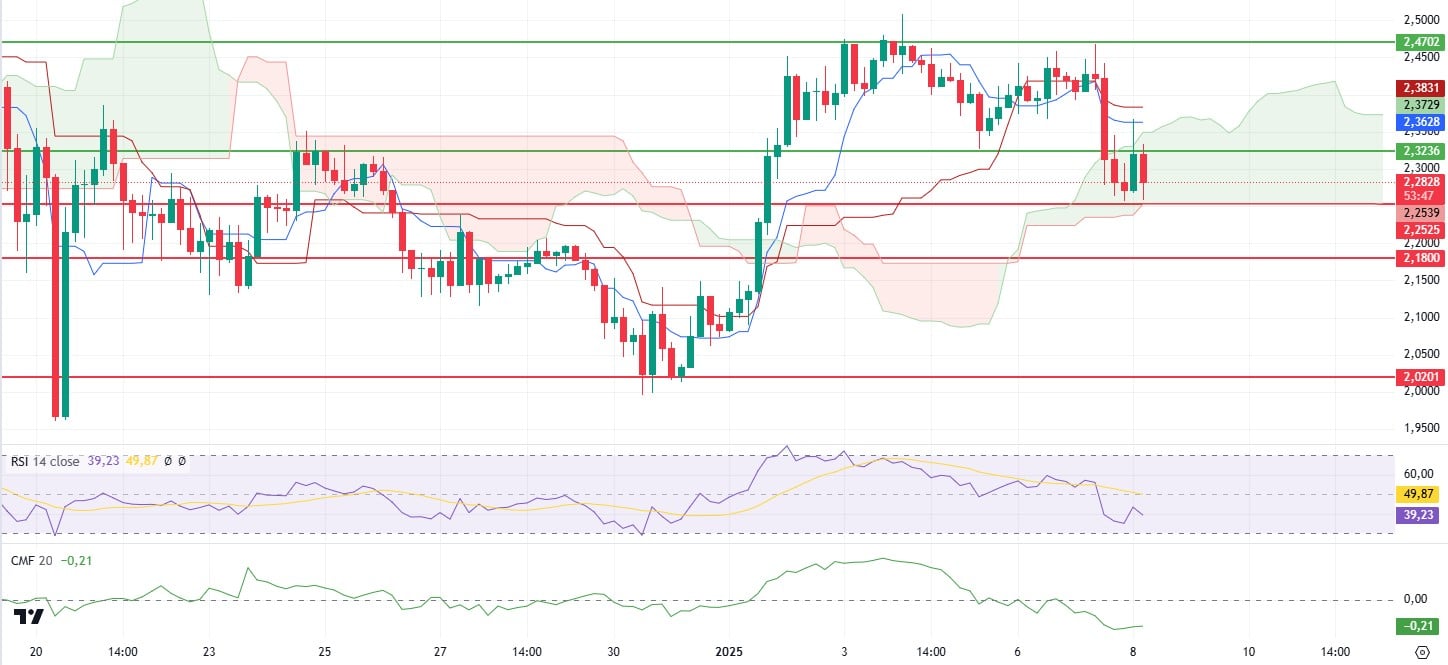
The general bearish trend in the markets caused XRP to lose the 2.32 support. While the effort to regain this level has failed, the price has been rejected and is trying to stabilize at 2.26. This indicates continued weakness in XRP’s technical outlook. At the same time, the price has fallen back to the limits of the kumo cloud and the 2.25 level stands out as an important cloud support in the short term.
Technical indicators also support the negative outlook. Chaikin Money Flow (CMF) indicates that the selling pressure in the market continues and capital inflows remain limited, while the Relative Strength Index (RSI) indicator remains weak. The current level of the RSI suggests that the market is far from recovery potential and downward pressure may continue.
If these technical weaknesses continue and the kumo cloud support at 2.25 is lost, a move towards lower support levels such as 2.18 could be seen in the XRP price. On the other hand, a close above 2.32 is critical for a bullish scenario. Regaining this level will be a fundamental step for XRP to enter a recovery trend and move towards the upper resistance levels. In summary, 2.25 support and 2.32 resistance for XRP stand out as levels to be closely monitored in the short term.
Supports 2.2525 – 2.1800 – 2.0201
Resistances 2.3236 – 2.4702 – 2.6180
SOL/USDT
Canadian firm Sol Strategies announced a strategic investment in Solana. Sol Strategies has invested 25 million Canadian dollars in Solana to increase blockchain staking and strategic acquisitions, aiming to enhance ecosystem growth. The Pumpdotfun platform on the Solana ecosystem has emerged as a dominant force in the Solana blockchain ecosystem, accounting for nearly 70% of all token launches in the last two days. Data from CoinGlass suggests that further declines could be coming, with around $300 million SOL flowing into exchanges over the past few weeks
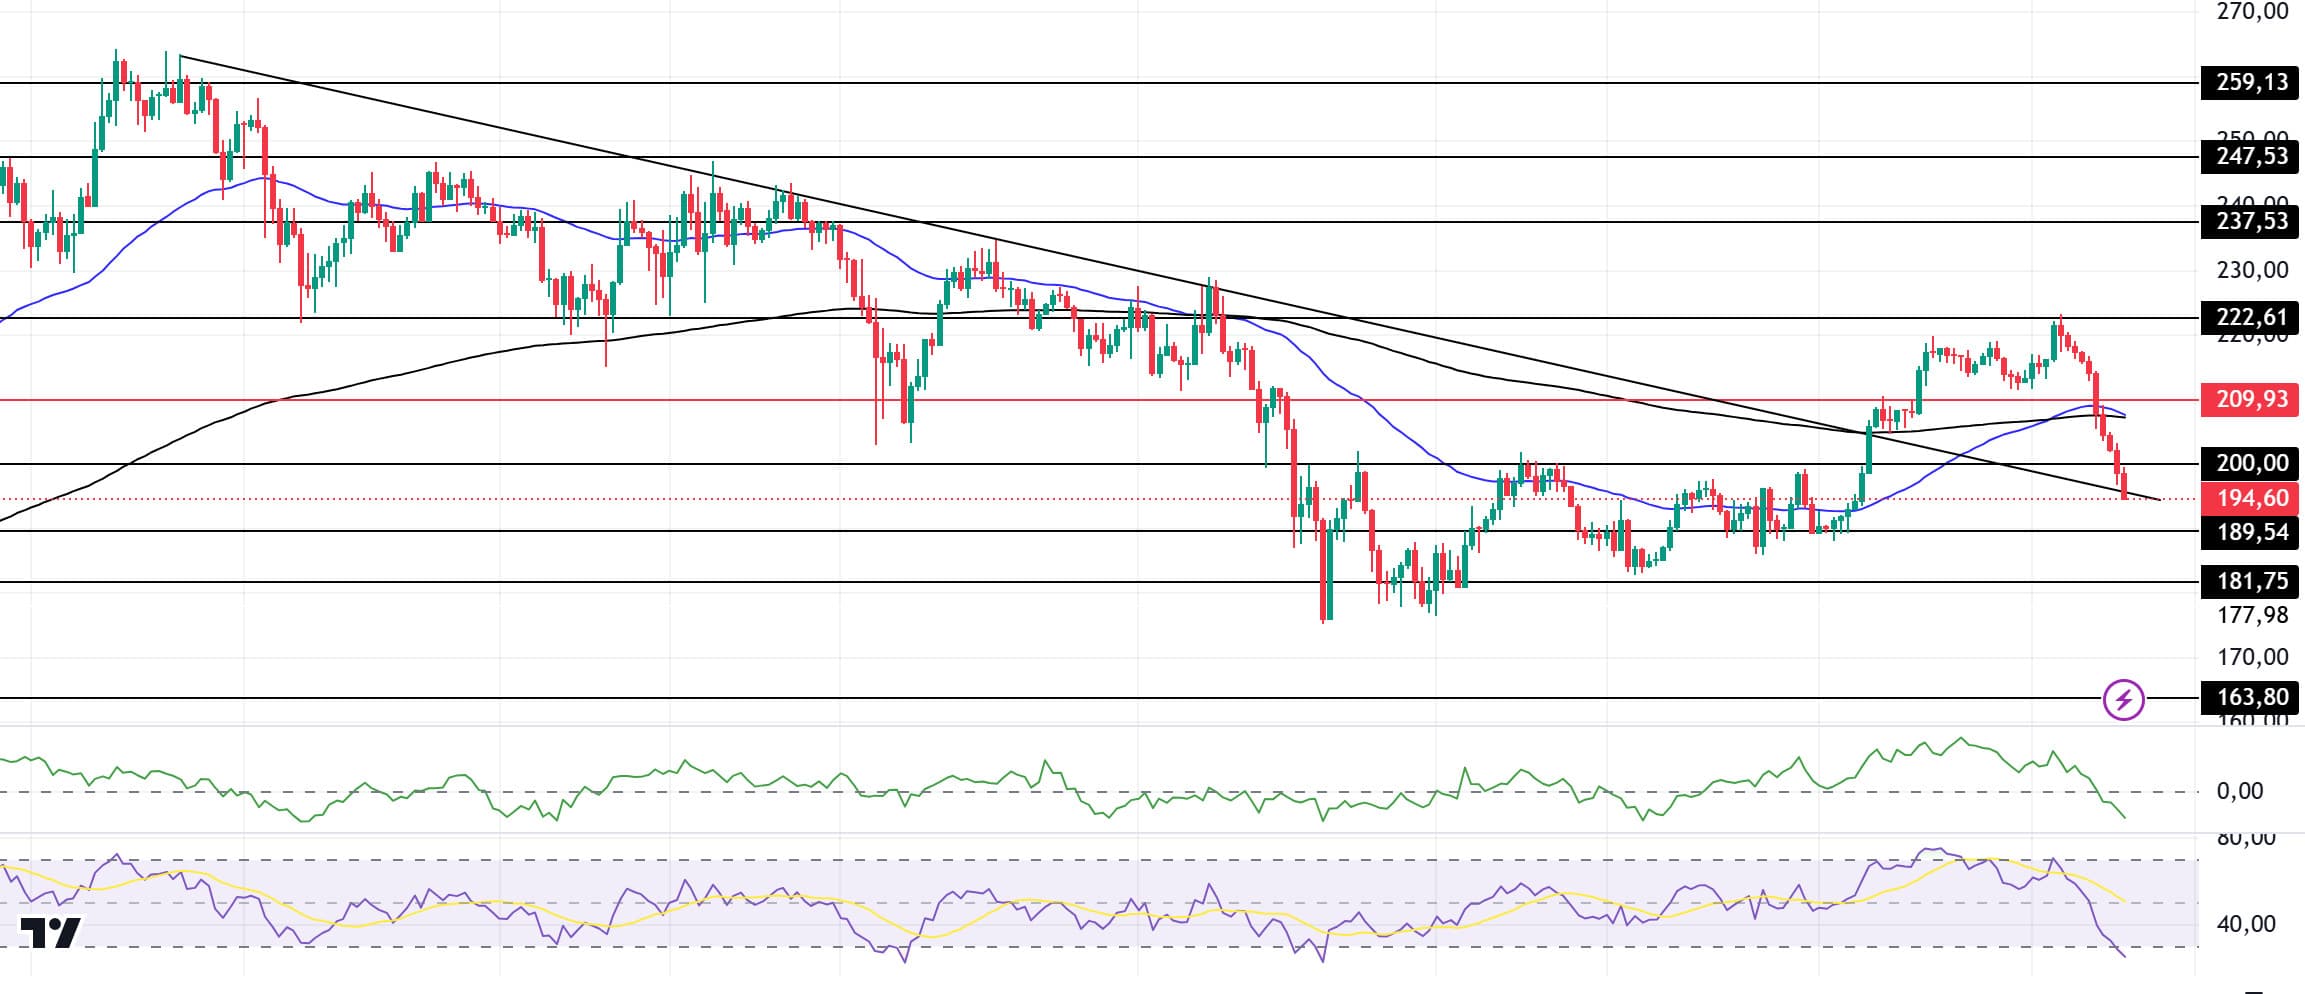
SOL has deepened the retreat since yesterday, falling 9.09% in 24 hours. On the 4-hour timeframe, the 50 EMA (Blue Line) continues to position above the 200 EMA (Black Line). This could start a medium-term uptrend. At the time of writing, the resistance of the downtrend that started on November 23rd is working as support and the asset is currently testing this support. The Chaikin Money Flow (CMF)20 indicator is in negative territory and outflows continue to increase. However, the Relative Strength Index (RSI)14 indicator has reached the oversold level. At the same time, the bearish mismatch in our analysis yesterday worked. The 247.53 level stands out as a very strong resistance point in the rises driven by both the upcoming macroeconomic data and the news in the Solana ecosystem. If it breaks here, the rise may continue. In case of retracements for the opposite reasons or due to profit sales, the 289.54 support level can be triggered. If the price reaches these support levels, a potential bullish opportunity may arise if momentum increases.
Supports 189.54 – 181.75 – 163.80
Resistances 200.00 – 209.93 – 222.61
DOGE/USDT
The transfer, valued at more than $27 million, was received by a mysterious whale from an unknown blockchain address yesterday evening at 70,081,124 DOGE and sent to a centralized exchange. According to IntoTheBlock, those who have held the asset for less than a month have increased their holding by 110% in the last month. On the other hand, Elon Musk X shared on his platform that “if dollar inflation is solved, the price in dollars to buy cryptocurrency will actually go down, other things being equal. The important thing is the ratio of dollar to crypto.
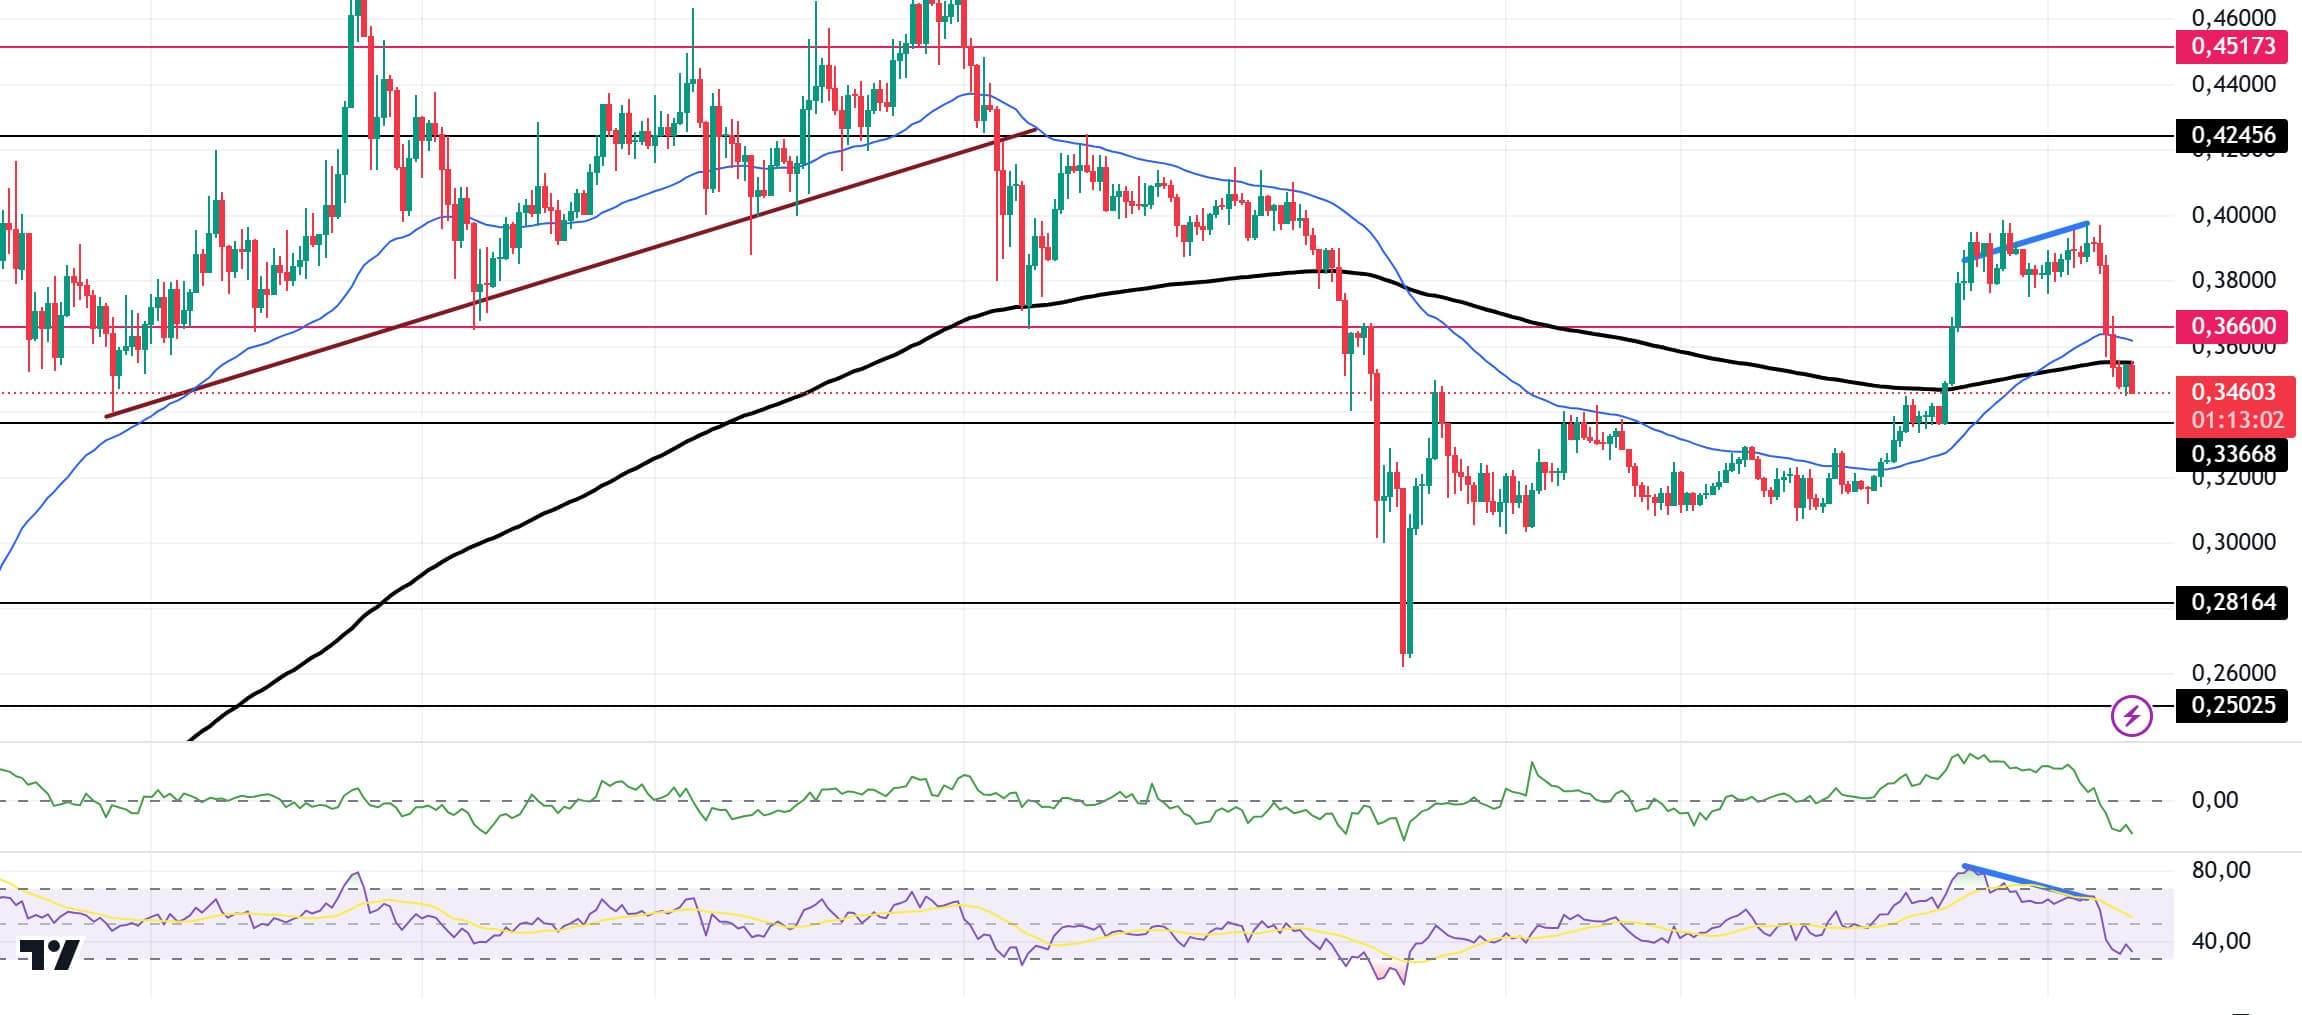
When we look at the chart, the retreat has deepened since yesterday. The downward asset continues to move in a negative direction. At the same time, the bearish mismatch in the Relative Strength Index (RSI)14 indicator seems to have worked. On the 4-hour timeframe, the 50 EMA (Blue Line) broke the 200 EMA to the upside. This may reinforce the uptrend. The Chaikin Money Flow (CMF)20 indicator is in negative territory, but money outflows are increasing. However, Relative Strength Index (RSI)14 is in oversold territory. The asset has broken both the 50 EMA and the 200 EMA to the downside. This may increase the selling pressure. The 0.42456 level is a very strong resistance point in the uptrend due to the upcoming macroeconomic data and the innovations in the Doge coin. If DOGE catches a new momentum and rises above this level, the rise may continue strongly. In case of possible pullbacks due to macroeconomic reasons or negativity in the ecosystem, the 0.33668 level, which is the base level of the trend, is an important support. If the price reaches these support levels, a potential bullish opportunity may arise if momentum increases.
Supports 0.33668 – 0.28164 – 0.25025
Resistances 0.36600 – 0.42456 – 0.45173
LEGAL NOTICE
The investment information, comments and recommendations contained herein do not constitute investment advice. Investment advisory services are provided individually by authorized institutions taking into account the risk and return preferences of individuals. The comments and recommendations contained herein are of a general nature. These recommendations may not be suitable for your financial situation and risk and return preferences. Therefore, making an investment decision based solely on the information contained herein may not produce results in line with your expectations.


