MARKET SUMMARY
Latest Situation in Crypto Assets
| Assets | Last Price | 24h Change | Dominance | Market Cap. |
|---|---|---|---|---|
| BTC | 95,315.02 | -5.40% | 56.68% | 1,89 T |
| ETH | 3,359.76 | -7.68% | 12.14% | 404,69 B |
| XRP | 2.322 | -4.29% | 4.00% | 133,32 B |
| SOLANA | 197.07 | -7.94% | 2.86% | 95,31 B |
| DOGE | 0.3468 | -10.25% | 1.54% | 51,18 B |
| CARDANO | 0.9728 | -14.03% | 1.03% | 34,21 B |
| TRX | 0.2504 | -7.10% | 0.65% | 21,59 B |
| AVAX | 38.00 | -11.71% | 0.47% | 15,60 B |
| LINK | 20.68 | -11.34% | 0.40% | 13,20 B |
| SHIB | 0.00002151 | -9.62% | 0.38% | 12,68 B |
| DOT | 6.812 | -12.93% | 0.31% | 10,48 B |
*Prepared on 1.8.2025 at 14:00 (UTC)
WHAT’S LEFT BEHIND
Jobless Claims in the US
Applications for unemployment benefits in the US fell to 201 thousand, the lowest level since February. According to seasonally adjusted data released by the US Department of Labor, 211 thousand people applied for unemployment benefits in the week ending December 28.
South Korea Institutional Crypto Trading
South Korea is preparing to gradually lift its practice of banning institutions from trading cryptocurrencies. The Financial Services Commission (FSC), South Korea’s financial regulator, aims to allow local institutions to open trading accounts on cryptocurrency exchanges, Yonhap News Agency reported.
Trump Considers Declaring a National Economic Emergency
US President Donald Trump is working on a plan to declare a national economic emergency and impose broad general tariffs, CNN reports. This step would authorize Trump to unilaterally manage imports using the International Emergency Economic Powers Act (IEEPA).
Fed Governor Waller Announces Interest Rate Cut
Fed Governor Christopher Waller expressed his support for further rate cuts in anticipation of inflation continuing to fall in 2025. Waller pointed out that although inflation will remain “stagnant” above the 2% target until the end of 2024, long-term prospects are positive.
Elon Musk Supports Canada’s Cryptographer Prime Minister Candidate
Elon Musk shared a speech on inflation by Pierre Poilievre, who was named as the prime minister after Justin Trudeau’s resignation in Canada, on the social media platform X. Musk added the note “Excellent comment” to his post.
Blockchain Breakthrough From China, Which Banned Crypto
China, which bans cryptocurrencies, plans to build its national data infrastructure on blockchain technology. Expected to be completed by 2029, this project aims to transform the country’s economic and technological infrastructure.
HIGHLIGHTS OF THE DAY
Important Economic Calender Data
| Time | News | Expectation | Previous |
|---|---|---|---|
| 19:00 | US FOMC Meeting Minutes | — | — |
INFORMATION:
*The calendar is based on UTC (Coordinated Universal Time) time zone. The economic calendar content on the relevant page is obtained from reliable news and data providers. The news in the economic calendar content, the date and time of the announcement of the news, possible changes in the previous, expectations and announced figures are made by the data provider institutions. Darkex cannot be held responsible for possible changes that may arise from similar situations
MARKET COMPASS
Global markets continue to monitor the US agenda and macro indicators. After yesterday’s better-than-expected data set, today’s ADP private sector non-farm payroll change data indicated that the US economy added fewer jobs than expected last month. Ahead of the critical employment data to be released on Friday, we don’t see this leading to a new pricing in the US Federal Reserve’s (FED) rate cut course. On the other hand, FED member Chris Waller said that he expects inflation to continue to fall to 2% and argued that further rate cuts would be appropriate.
Wall Street futures erased their gains after reports that Trump is considering declaring a national economic emergency. The combination of Federal Open Market Committee (FOMC) member Waller’s remarks, macro indicators and news about Trump did not increase the markets’ appetite for risk. The news on the International Economic Emergency Powers Act, which unilaterally gives a president the authority to manage imports, had a more pronounced impact on pricing behavior. However, we think that it is too early to say whether this will have a lasting effect and we emphasize that the agenda should be monitored, considering that new news flows on the subject may also come.
In the recent period, when FED expectations shaped by macro indicators were effective on prices, we have seen that the rise in bond yields reflected negatively on the value of digital assets. Although today’s data does not seem to have triggered a new pricing behavior, the minutes of the FOMC’s December meeting to be published today may be remarkable. Markets will look for clues about the interest rate cut course between the lines.
From the short term to the big picture.
The victory of former President Trump on November 5, which was one of the main pillars of our bullish expectation for the long-term outlook in digital assets, produced a result in line with our predictions. Afterwards, the appointments made by the president-elect and the increasing regulatory expectations for the crypto ecosystem in the US and the emergence of BTC as a reserve continued to take place in our equation as positive variables. Although it is expected to continue at a slower pace, the FED’s signal that the interest rate cut cycle will continue and the volume in ETFs based on crypto assets indicating an increase in institutional investor interest support our upward forecast for the big picture for now. In the short term, given the nature of the market and pricing behavior, we think it would not be surprising to see occasional pauses or pullbacks in digital assets. However, at this point, it is worth emphasizing again that the fundamental dynamics continue to be bullish.
TECHNICAL ANALYSIS
BTC/USDT
Although there is relatively no significant news flow for the market, Elon Musk’s support for pro-crypto Pierre Poilievre for the Canadian prime ministership came to the fore today. In China, known for its crypto bans, announced that it will also use blockchain technology in national data infrastructure developments. South Korean regulators, on the other hand, reportedly continue to discuss the approval of corporate crypto trading amid the country’s ongoing leadership crisis.
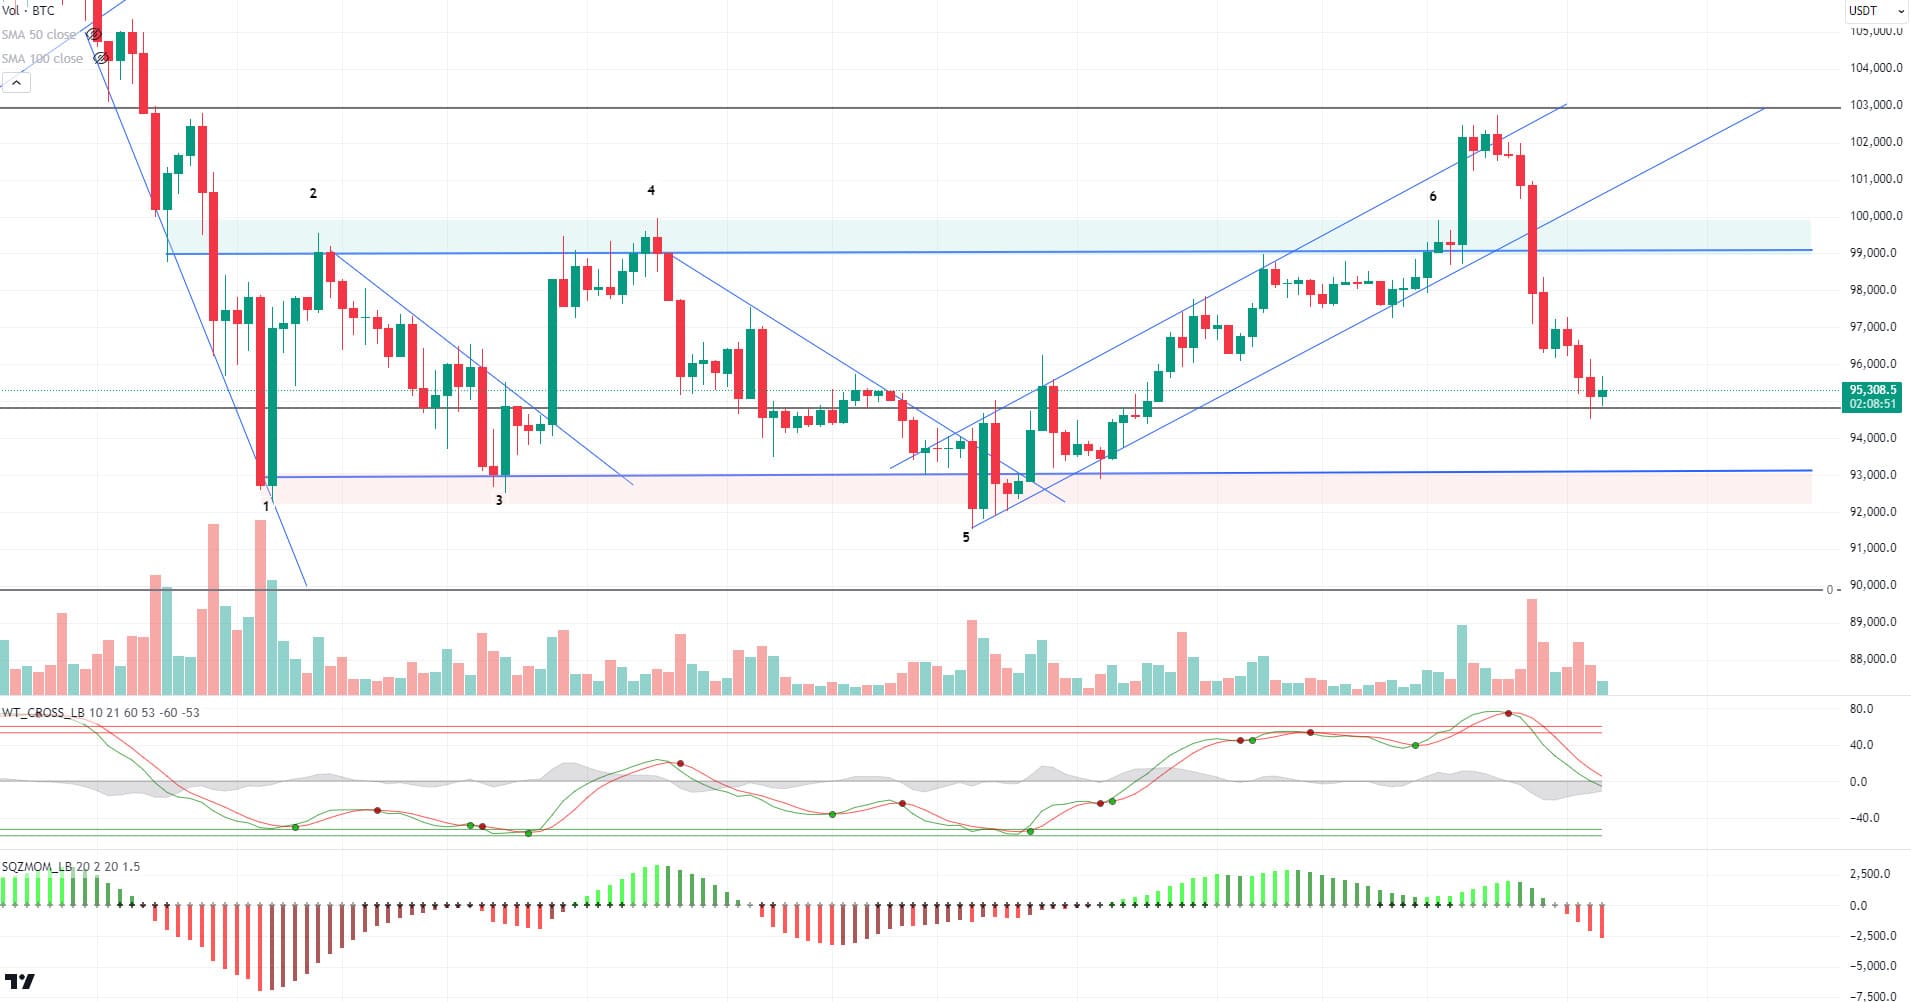
With all these developments, when we look at the BTC Technical outlook, the price, which broke the bottom line of the rising trend structure, retreated sharply to 95,000, the major support level. Reacting from here, BTC is currently trading at 95,400. When we look at the technical oscillators, we see that the sell signal is starting to weaken, while the momentum indicator is in the negative zone. In case the declines deepen, closures below the 95,000 level will be followed and the point that will meet us may be the 92,800 support level. If the price regains momentum from this level, we will follow the minor resistance levels of 97,200 and then 98,000. The fact that US markets will be closed tomorrow due to the national day may cause volatility to fall slightly.
Supports 95,000 – 92,800 – 91,
Resistances 97,200 – 98,000 – 99,100
ETH/USDT
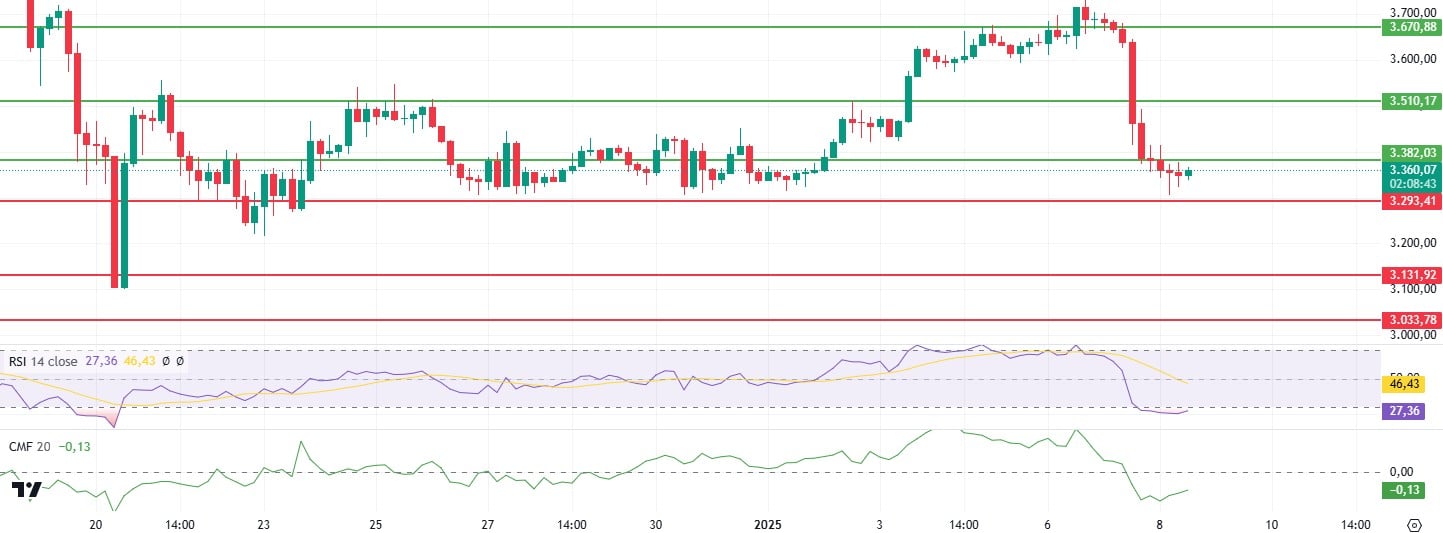
Ethereum (ETH) has fallen to the critical 3,300 support zone after the recent bearish move and continues to follow a sideways trend in this region.
When we look at technical indicators to assess the current dynamics of price action, we see that recovery signals are starting to attract attention. The Relative Strength Index (RSI) has turned up from the oversold zone, indicating that buyers may return to the market. This upward momentum in the RSI increases the likelihood of a short-term rebound in price action. Similarly, Chaikin Money Flow (CMF), although still in negative territory, has gained upward momentum, indicating that capital inflows have started to regain strength and buyers are moving in.
Currently, the resistance zone at 3,382 stands out as a critical threshold for the short-term direction of ETH. If the rebound in technical indicators continues, a break of this resistance level could see the price enter a short-term uptrend. However, another factor to be considered at this point is the protection of the main support zone at 3,293. It should be noted that if this level is broken to the downside, the selling pressure may deepen further and the price may experience a sharp decline towards the next support levels.
Supports 3,293 – 3,131 – 3,033
Resistances 3,382 – 3,510 – 3,670
XRP/USDT
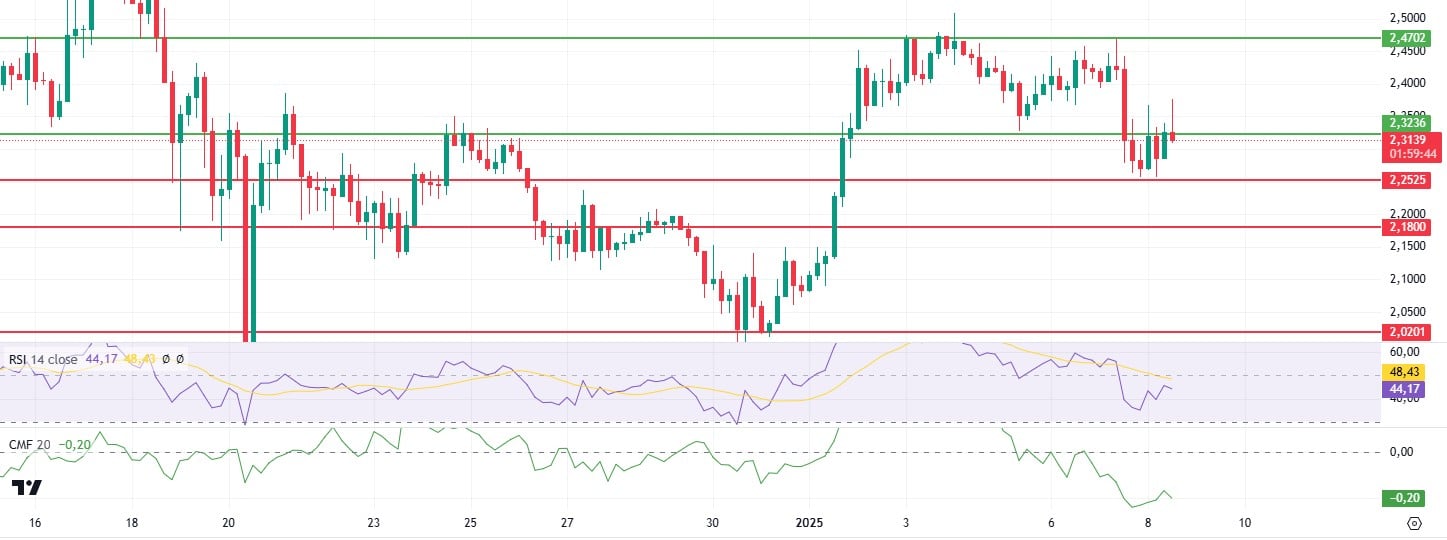
XRP managed to get a strong reaction from the 2.25 support zone after its decline. The price, which rose as high as 2.37 during the day, fell back below 2.32 as Bitcoin retreated. Despite the high volatility, Cumulative Volume Delta (CVD) data shows that demand in the spot market is quite high, indicating that XRP could quickly gain momentum and create new highs in the event of a possible market recovery.
When technical indicators are analyzed, it is observed that the Relative Strength Index (RSI) exhibits a slight upward trend with the price, but this movement is quite limited. This trend in RSI signals that buyers are gradually returning to the market. On the other hand, the Chaikin Money Flow (CMF) indicator remains in negative territory, suggesting that capital inflows are not strong enough and the market is cautious.
In light of this data, the 2.32 level is considered a critical threshold for the short-term direction of XRP. If it can be sustained above this level, the price is likely to quickly rise to the 2.47 resistance level. However, if the 2.25 key support level is broken, the current positive outlook is likely to deteriorate and a deeper downtrend is likely to begin.
Supports 2.2525 – 2.1800 – 2.0201
Resistances 2.3236 – 2.4702 – 2.6180
SOL/USDT
Solana Mobile will launch Seeker Mobile in mid-2025, featuring Web3 tools, NFTs and upgraded hardware for enhanced blockchain experiences. Pump.fun moved another 98,593 SOLs worth $20.49 million to a centralized crypto exchange. Due to Pump.fun’s active transfers, selling pressure on SOL may continue. Solana’s trading volume increased by 94.85% despite the 7.86% price drop in the last 24 hours. Open Interest (OI) fell by around 10.68% to $5.72 billion, indicating a decrease in leveraged positions.
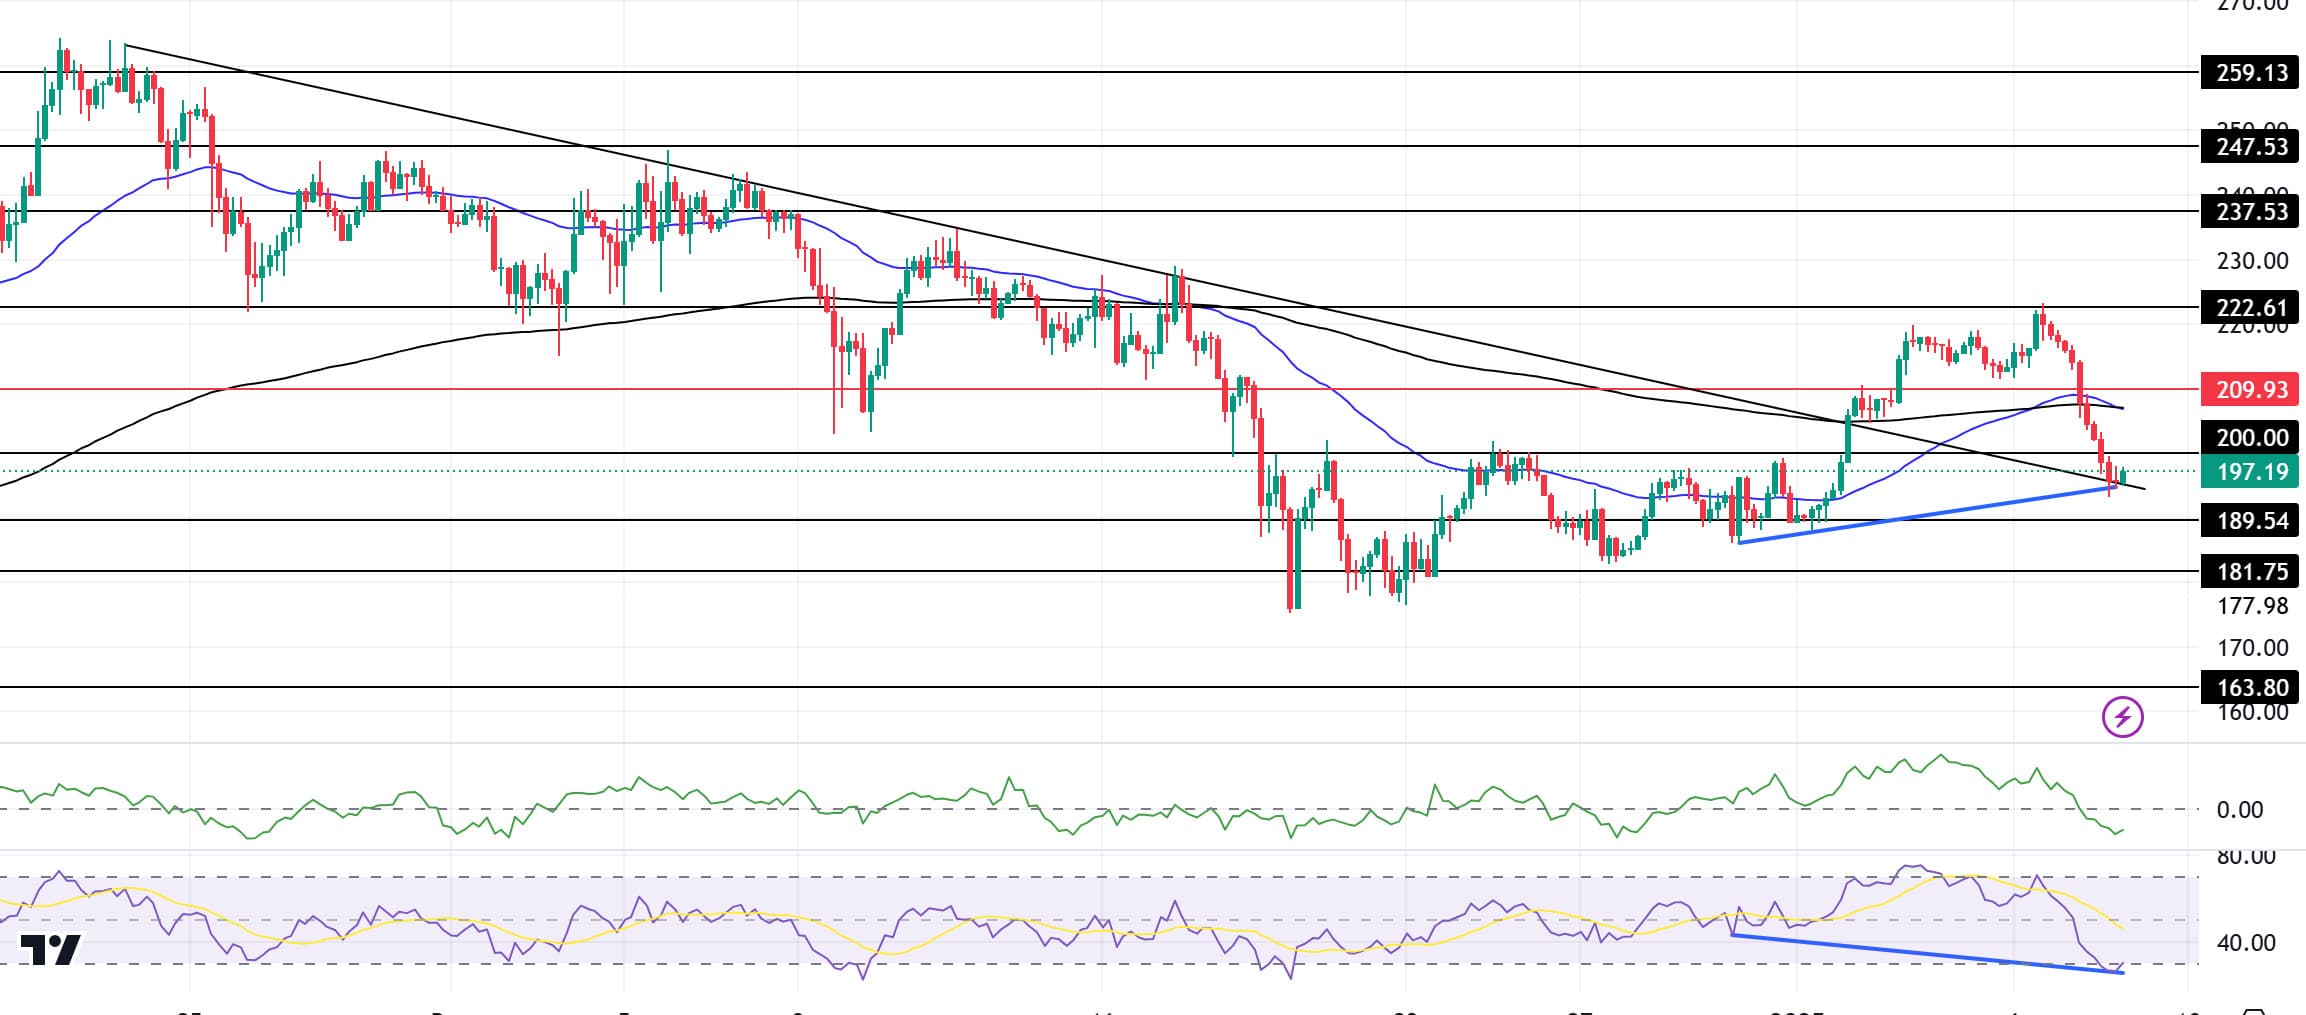
On the 4-hour timeframe, the 50 EMA (Blue Line) is in the same place as the 200 EMA (Black Line). This shows that the price is unstable at the moment. At the time of writing, the resistance of the downtrend that started on November 23rd is working as support and the asset is currently testing this support. The Chaikin Money Flow (CMF)20 indicator is in negative territory and inflows have started to increase. However, the Relative Strength Index (RSI)14 indicator reached the oversold level. However, there is a bullish mismatch. The 222.61 level appears to be a very strong resistance place in the rises driven by both the upcoming macroeconomic data and the news in the Solana ecosystem. If it breaks here, the rise may continue. In case of retracements for the opposite reasons or due to profit sales, the 189.54 support level can be triggered. If the price reaches these support levels, a potential bullish opportunity may arise if momentum increases.
Supports 189.54 – 181.75 – 163.80
Resistances 200.00 – 209.93 – 222.61
DOGE/USDT
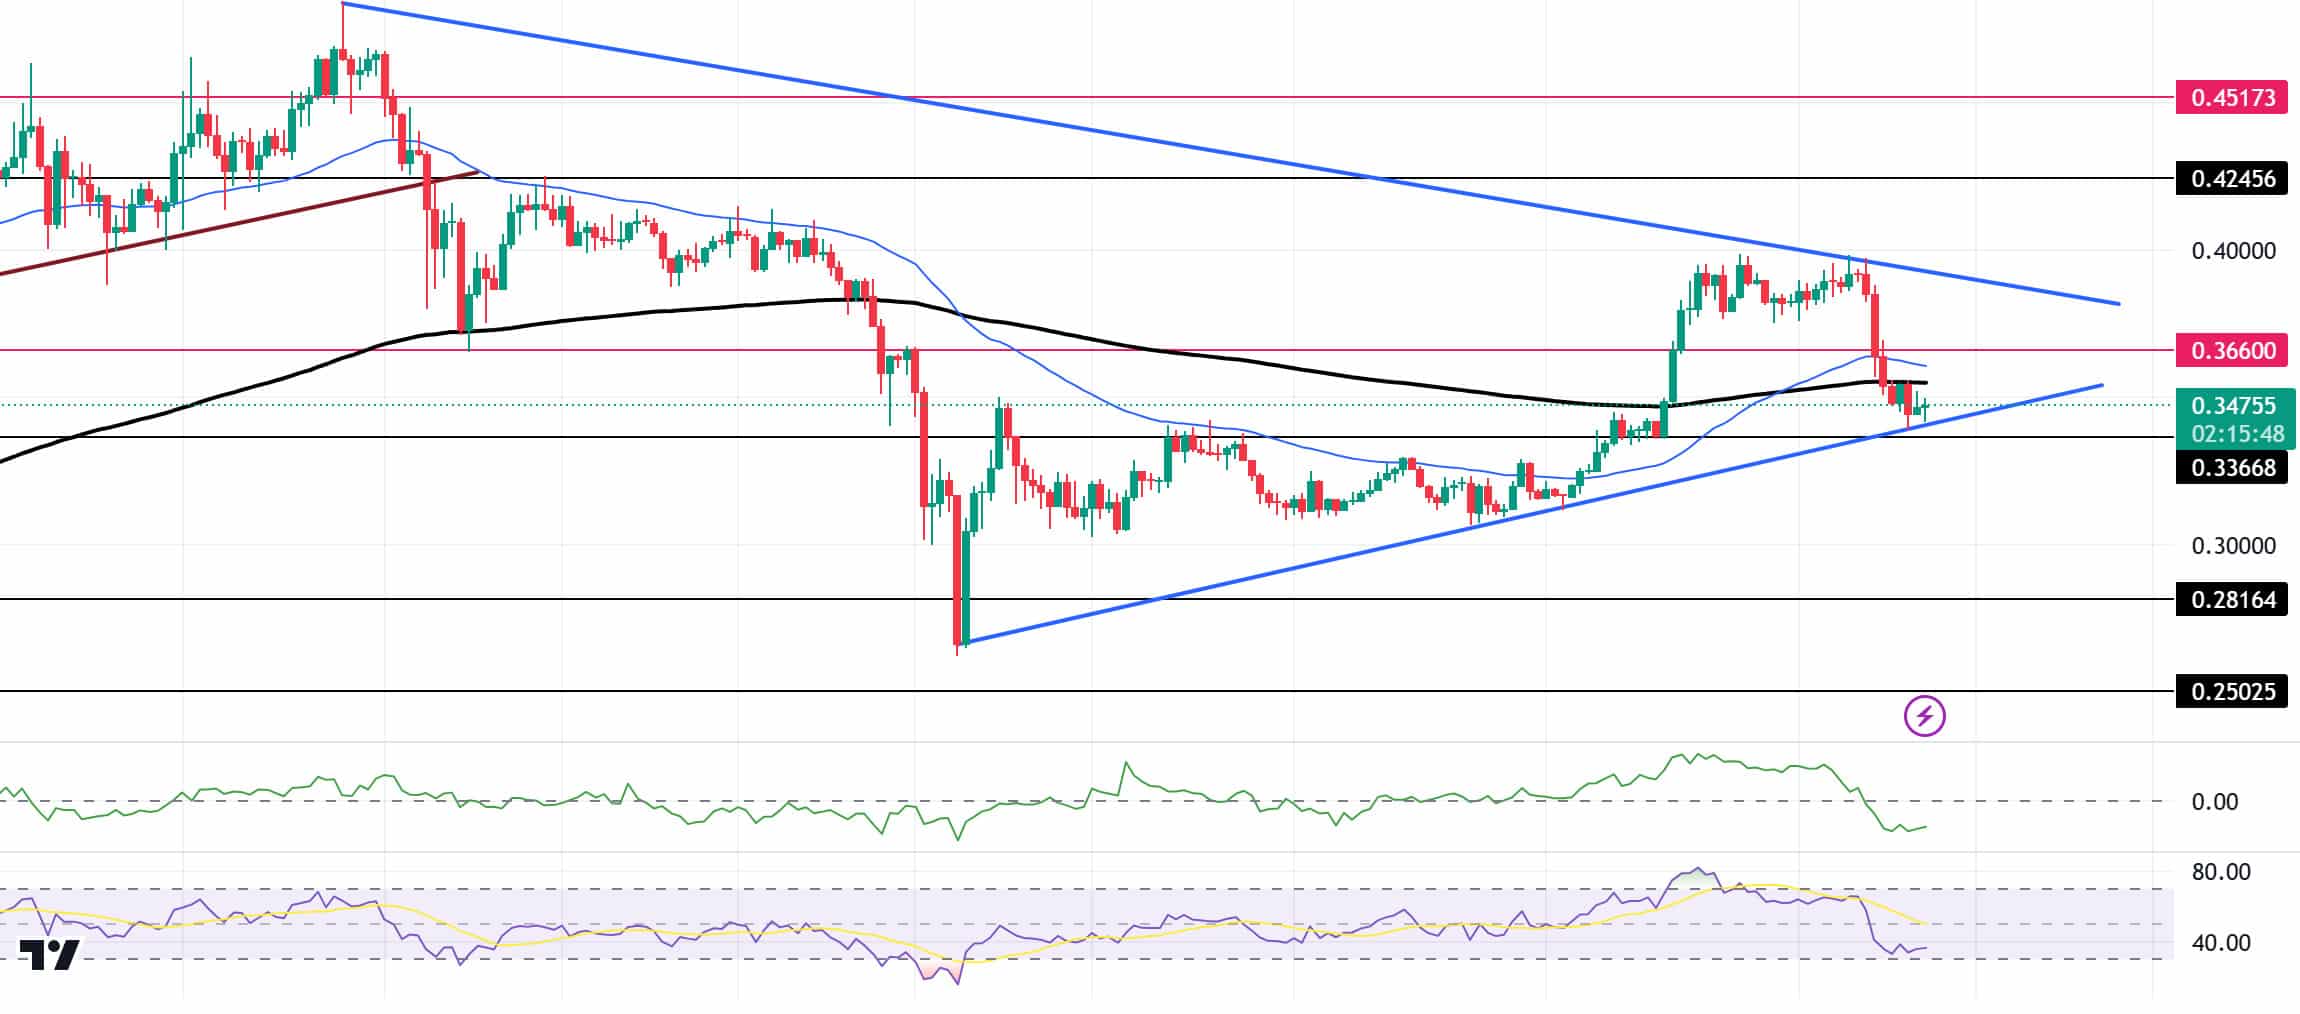
Looking at the chart, the asset has moved horizontally since our analysis in the morning, reaching the rising support that has been in place since December 20. At the same time, the asset is at the base level of the symmetrical triangle pattern. On the 4-hour timeframe, the 50 EMA (Blue Line) broke the 200 EMA to the upside. This may reinforce the uptrend. The Chaikin Money Flow (CMF)20 indicator is in negative territory, but money inflows and outflows are in balance. However, the Relative Strength Index (RSI)14 is in oversold territory. The price continues to be below both the 50 EMA and the 200 EMA. This may increase the selling pressure. The 0.42456 level is a very strong resistance point in the uptrend driven by both the upcoming macroeconomic data and the innovations in the DOGE coin. If DOGE catches a new momentum and rises above this level, the rise may continue strongly. In case of possible pullbacks due to macroeconomic reasons or negativity in the ecosystem, the 0.33668 level, which is the base level of the trend, is an important support. If the price reaches these support levels, a potential bullish opportunity may arise if momentum increases.
Supports 0.33668 – 0.28164 – 0.25025
Resistances 0.36600 – 0.42456 – 0.45173
LEGAL NOTICE
The investment information, comments and recommendations contained herein do not constitute investment advice. Investment advisory services are provided individually by authorized institutions taking into account the risk and return preferences of individuals. The comments and recommendations contained herein are of a general nature. These recommendations may not be suitable for your financial situation and risk and return preferences. Therefore, making an investment decision based solely on the information contained herein may not produce results in line with your expectations.


