
MARKET SUMMARY
Latest Situation in Crypto Assets
| Assets | Last Price | 24h Change | Dominance | Market Cap. |
|---|---|---|---|---|
| BTC | 104,120.29 | -0.48% | 57.16% | 2,07 T |
| ETH | 3,284.25 | -0.38% | 10.99% | 397,34 B |
| XRP | 3.183 | 1.25% | 5.07% | 183,28 B |
| SOLANA | 260.16 | 7.65% | 3.52% | 127,16 B |
| DOGE | 0.3614 | -1.93% | 1.48% | 53,39 B |
| CARDANO | 0.9939 | -0.40% | 0.97% | 34,96 B |
| TRX | 0.2542 | 5.30% | 0.61% | 21,89 B |
| LINK | 25.48 | -0.83% | 0.45% | 16,27 B |
| AVAX | 36.81 | 0.88% | 0.42% | 15,19 B |
| SHIB | 0.00002034 | -1.52% | 0.33% | 12,00 B |
| DOT | 6.514 | -0.58% | 0.28% | 10,06 B |
WHAT’S LEFT BEHIND
Dogecoin, Trump and BONK ETFs Could Leave XRP and Solana Behind
REX Shares’ spot ETF application for Dogecoin ($DOGE), Trump ($TRUMP) and Bonk ($BONK) continues to reverberate. James Seyffart, an ETF analyst at Bloomberg, noted that the application was made in accordance with the 1940 law, which provides a different advantage. Eric Balchunas said this increases the likelihood that Dogecoin, Trump and BONK ETFs will be approved before Solana ($SOL), XRP ($XRP) and Litecoin ETFs.
Coinbase CEO Turkey Statement
Coinbase CEO Brian Armstrong stated that they are looking forward to getting permission to operate in Turkey. Armstrong said, “We want to start working in Turkey immediately. However, this depends entirely on the process of obtaining permits,” Armstrong said.
Decentralization Reaction to Vitalik Buterin
Ethereum founder Vitalik Buterin announced that he currently has the sole say in the decisions of the Ethereum Foundation. While this statement caused criticism of decentralization on social media, Buterin responded to the criticism by saying, “The Ethereum network is completely decentralized, the foundation management is a different structure.”
HIGHLIGHTS OF THE DAY
Important Economic Calender Data
*There are no important calendar developments for the rest of the day.
INFORMATION:
*The calendar is based on UTC (Coordinated Universal Time) time zone.
The economic calendar content on the relevant page is obtained from reliable news and data providers. The news in the economic calendar content, the date and time of the announcement of the news, possible changes in the previous, expectations and announced figures are made by the data provider institutions. Darkex cannot be held responsible for possible changes that may arise from similar situations.
MARKET COMPASS
The first actions and statements of the new US President are closely monitored in global markets. Trump announced the establishment of an artificial intelligence initiative in partnership with Softbank, OpenAI and Oracle, and suggested that a 10% tax hike on China, which will start as soon as February 1st, could be implemented. While Chinese stock markets closed negative and diverged negatively, in parallel with these statements, we are seeing increases in European stock markets led by technology companies. Wall Street is expected to start the new day on a positive note as investors digest Donald Trump’s latest policy announcements while monitoring corporate balance sheets.
Digital assets are still reeling from the fact that Trump did not make any statements about the crypto world during his inauguration. In the middle of the week, when the economic calendar is calm, Trump’s moves will continue to be at the center of the markets. We think that price changes based on news flow will continue in digital assets and the upward trend will continue to dominate, even though the pressurized course has continued.
From the short term to the big picture…
The victory of former President Trump on November 5, which was one of the main pillars of our bullish expectation for the long-term outlook in digital assets, produced a result in line with our predictions. Afterwards, the appointments made by the president-elect and the increasing regulatory expectations for the crypto ecosystem in the US and the emergence of BTC as a reserve continued to take place in our equation as positive variables. Although Trump, who took over the presidency with the inauguration ceremony on January 20, did not say anything for the digital world, we maintain our expectations on the subject in the coming days. On the other hand, although it is expected to continue at a slower pace, the expectations that the FED will continue its interest rate cut cycle (for now) and the volume in ETFs based on crypto assets indicating an increase in institutional investor interest support our upward forecast for the big picture for now. In the short term, given the nature of the market and pricing behavior, we think it would not be surprising to see occasional pauses or pullbacks in digital assets. However, at this point, it is worth emphasizing again that we think that the fundamental dynamics continue to be bullish.
TECHNICAL ANALYSIS
BTC/USDT
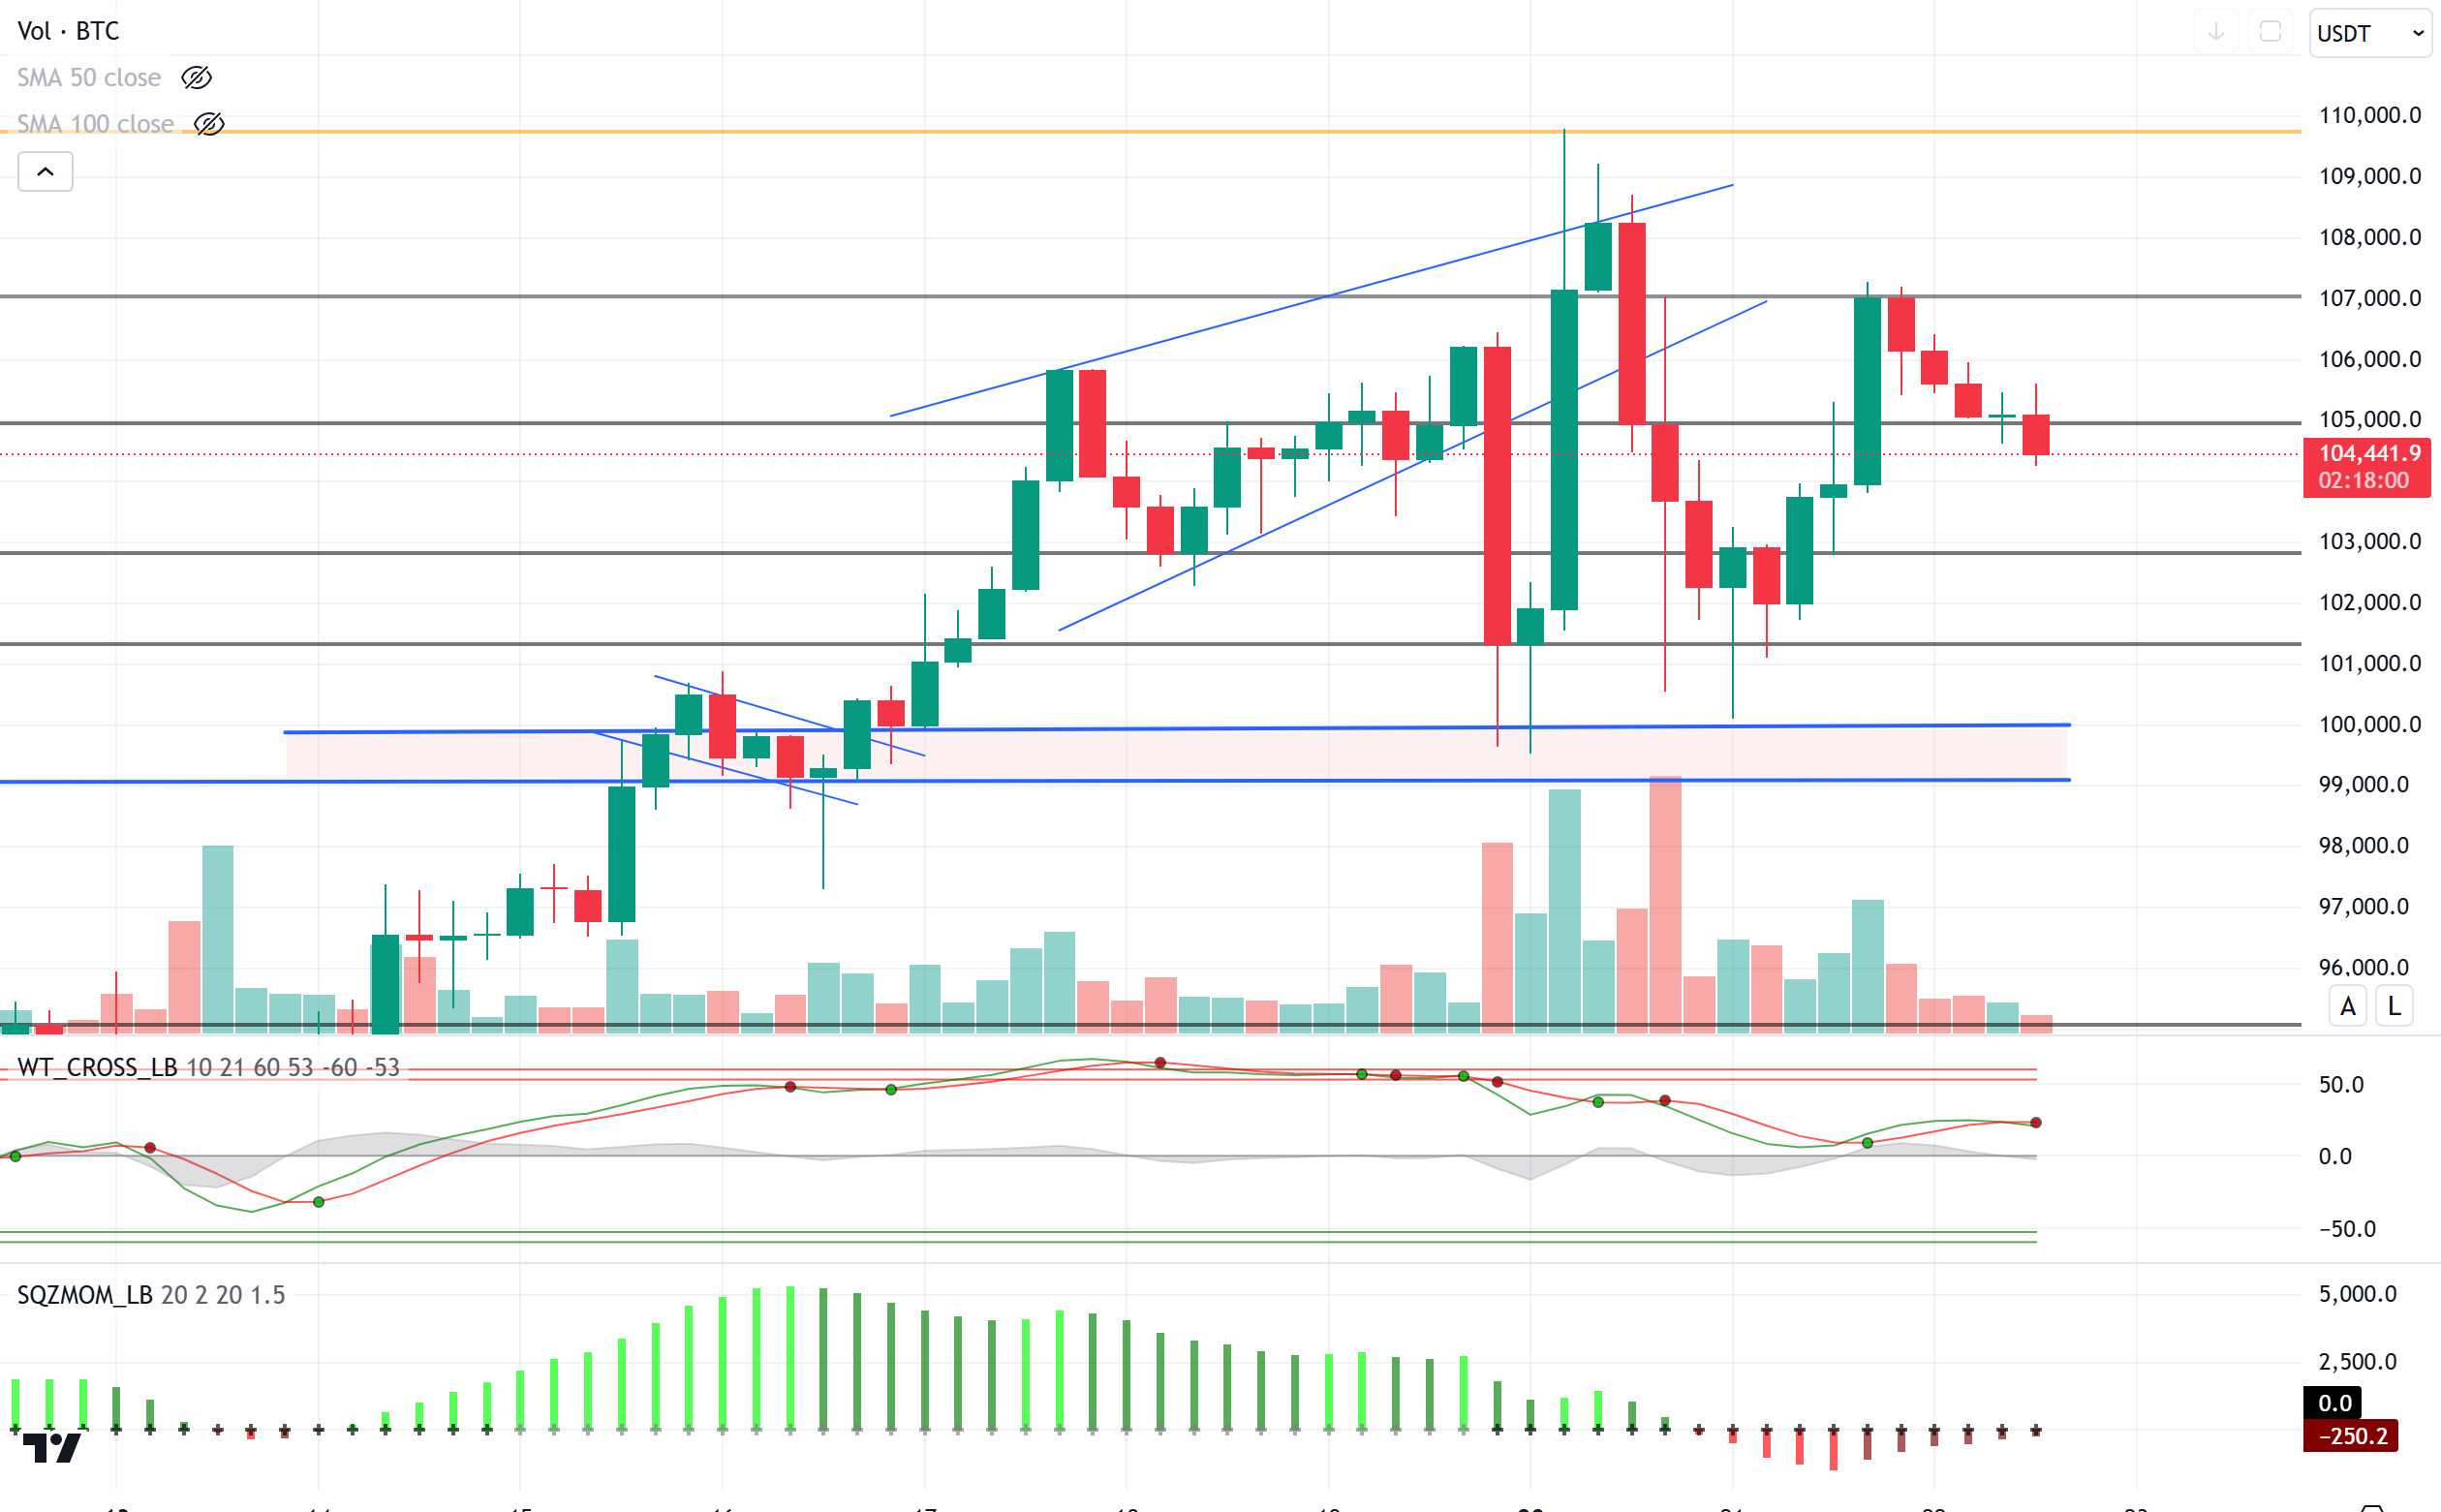
Bitcoin spot ETFs continued their streak of positive inflows as US markets opened, with $802.6 million in inflows for the fourth day in a row. This shows that institutional investor interest remains strong despite Donald Trump’s disregard for crypto markets. When we look at the daily liquidation heatmap, we see that the price encountered an intense accumulation of short positions after reaching the 107,000 level and then turned its direction down. In the chart, especially the long positions accumulated between 102,000 and 105,000 levels stand out.
When we look at the technical outlook, BTC 105,000 support zone, which exhibited a slightly sellers’ image during the day It is trading below 104.400. The short-term flag-pennant pattern stands out in BTC, which is preparing to erase its gains. When we look at the depth of the bullish correction, 102,800 appears as the next support level. When we look at our technical oscillators, we observe that the weakening buy signal in the morning analysis has been replaced by a sell signal. On the other hand, negative mismatch in the momentum indicator draws attention.
Supports 105,000 – 102,800 – 101,400
Resistances 106,800 – 108,250 – 109,700
ETH/USDT
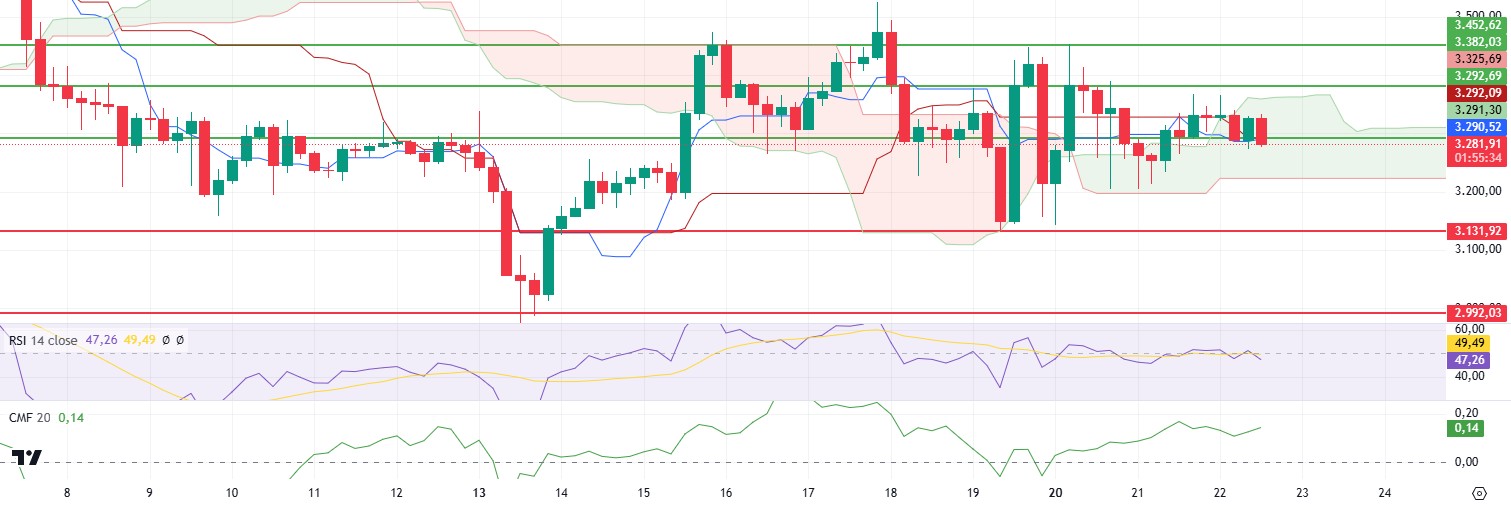
ETH, which followed a horizontal course during the day as expected, temporarily dipped below the 3,292 level and then quickly recovered by finding support at this level. During this recovery, the price first rose as high as 3,330 and then retreated back to the support level. This fluctuating movement of the price shows that short-term uncertainties and the balance of buyers and sellers continue in the market.
Analyzing the technical indicators, Chaikin Money Flow (CMF) remains in positive territory, indicating that buyers remain strong in the market. This indicates that buyer interest continues in the market and the declines are being utilized by buyers. Looking at the Ichimoku indicator, the upward trend of the tenkan line and the upward expansion of the kumo cloud support the medium and long-term positive outlook of the price. However, the Relative Strength Index (RSI) indicator remains flat and does not give a clear directional signal, suggesting that a dominant direction has not yet been determined in the market.
In light of this technical data, ETH is likely to make a move towards 3,382 in the evening hours if it can hold the support zone at 3,292. This move suggests that the price may regain upward momentum as buyers strengthen. However, a close below 3,292 could weaken the momentum in the market, leading the price to retreat towards lower levels.
Supports 3,292 – 3,131 – 2,992
Resistances 3,382 – 3,452 – 3,565
XRP/USDT
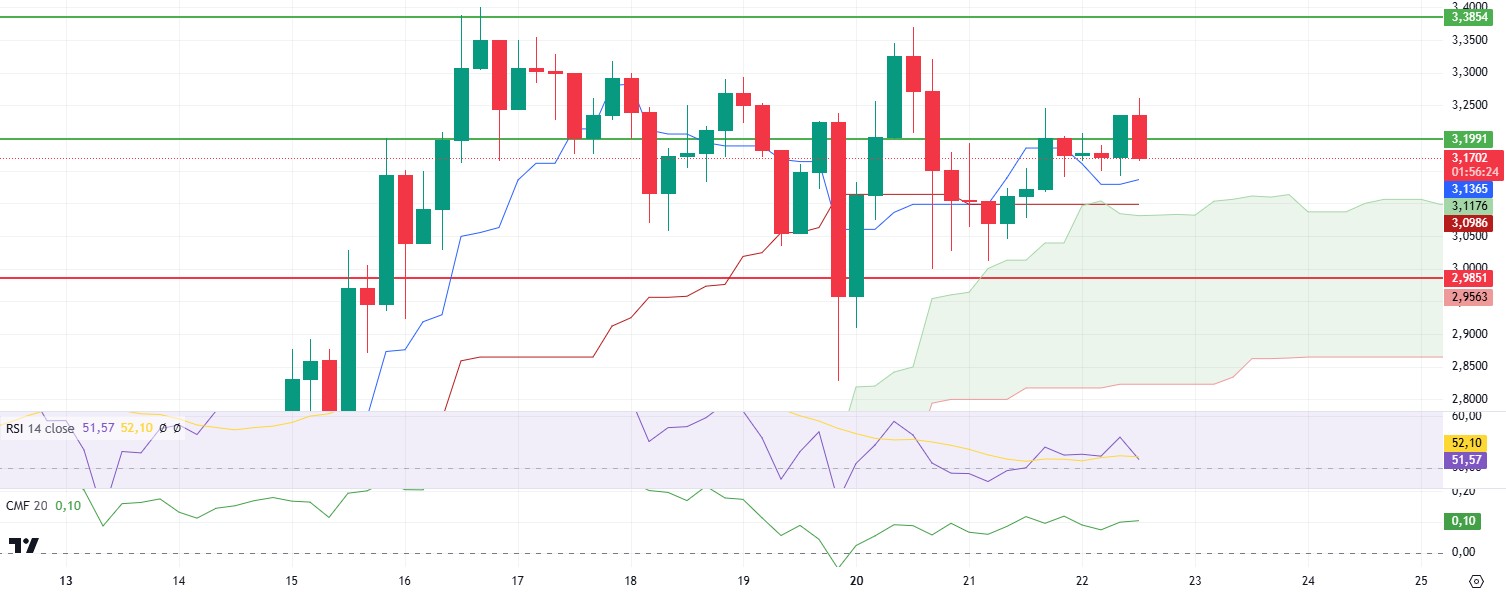
XRP managed to break through the 3.19 resistance level during the day and climbed up to 3.26 with a voluminous rise. However, selling pressure from this region caused the price to fall below 3.19 again.
When technical indicators are analyzed in detail, it is seen that there is no significant change in the general outlook. Chaikin Money Flow (CMF) remains in positive territory despite a slight pullback. This indicates that the market is generally under the control of buyers and demand continues despite the selling pressure. Looking at the Ichimoku indicator, the tenkan line continues to rise and the kumo cloud continues to expand, supporting the upside potential of the price. This outlook suggests that XRP has a strong technical structure at current levels.
Based on this data, if XRP holds above the 3.19 level, the price is likely to quickly rally towards the 3.38 levels. A move above this level could strengthen the control of buyers and bring higher price targets to the agenda. However, a close below 3.19 could lead to a loss of momentum, exposing the price to downward corrections. In this scenario, it is important for traders to keep a close eye on the 3.19 level and consider this area as a critical pivot point.
Supports 2.9851 – 2.7268 – 2.5500
Resistances 3.1991 – 3.3854 – 3.5039
SOL/USDT
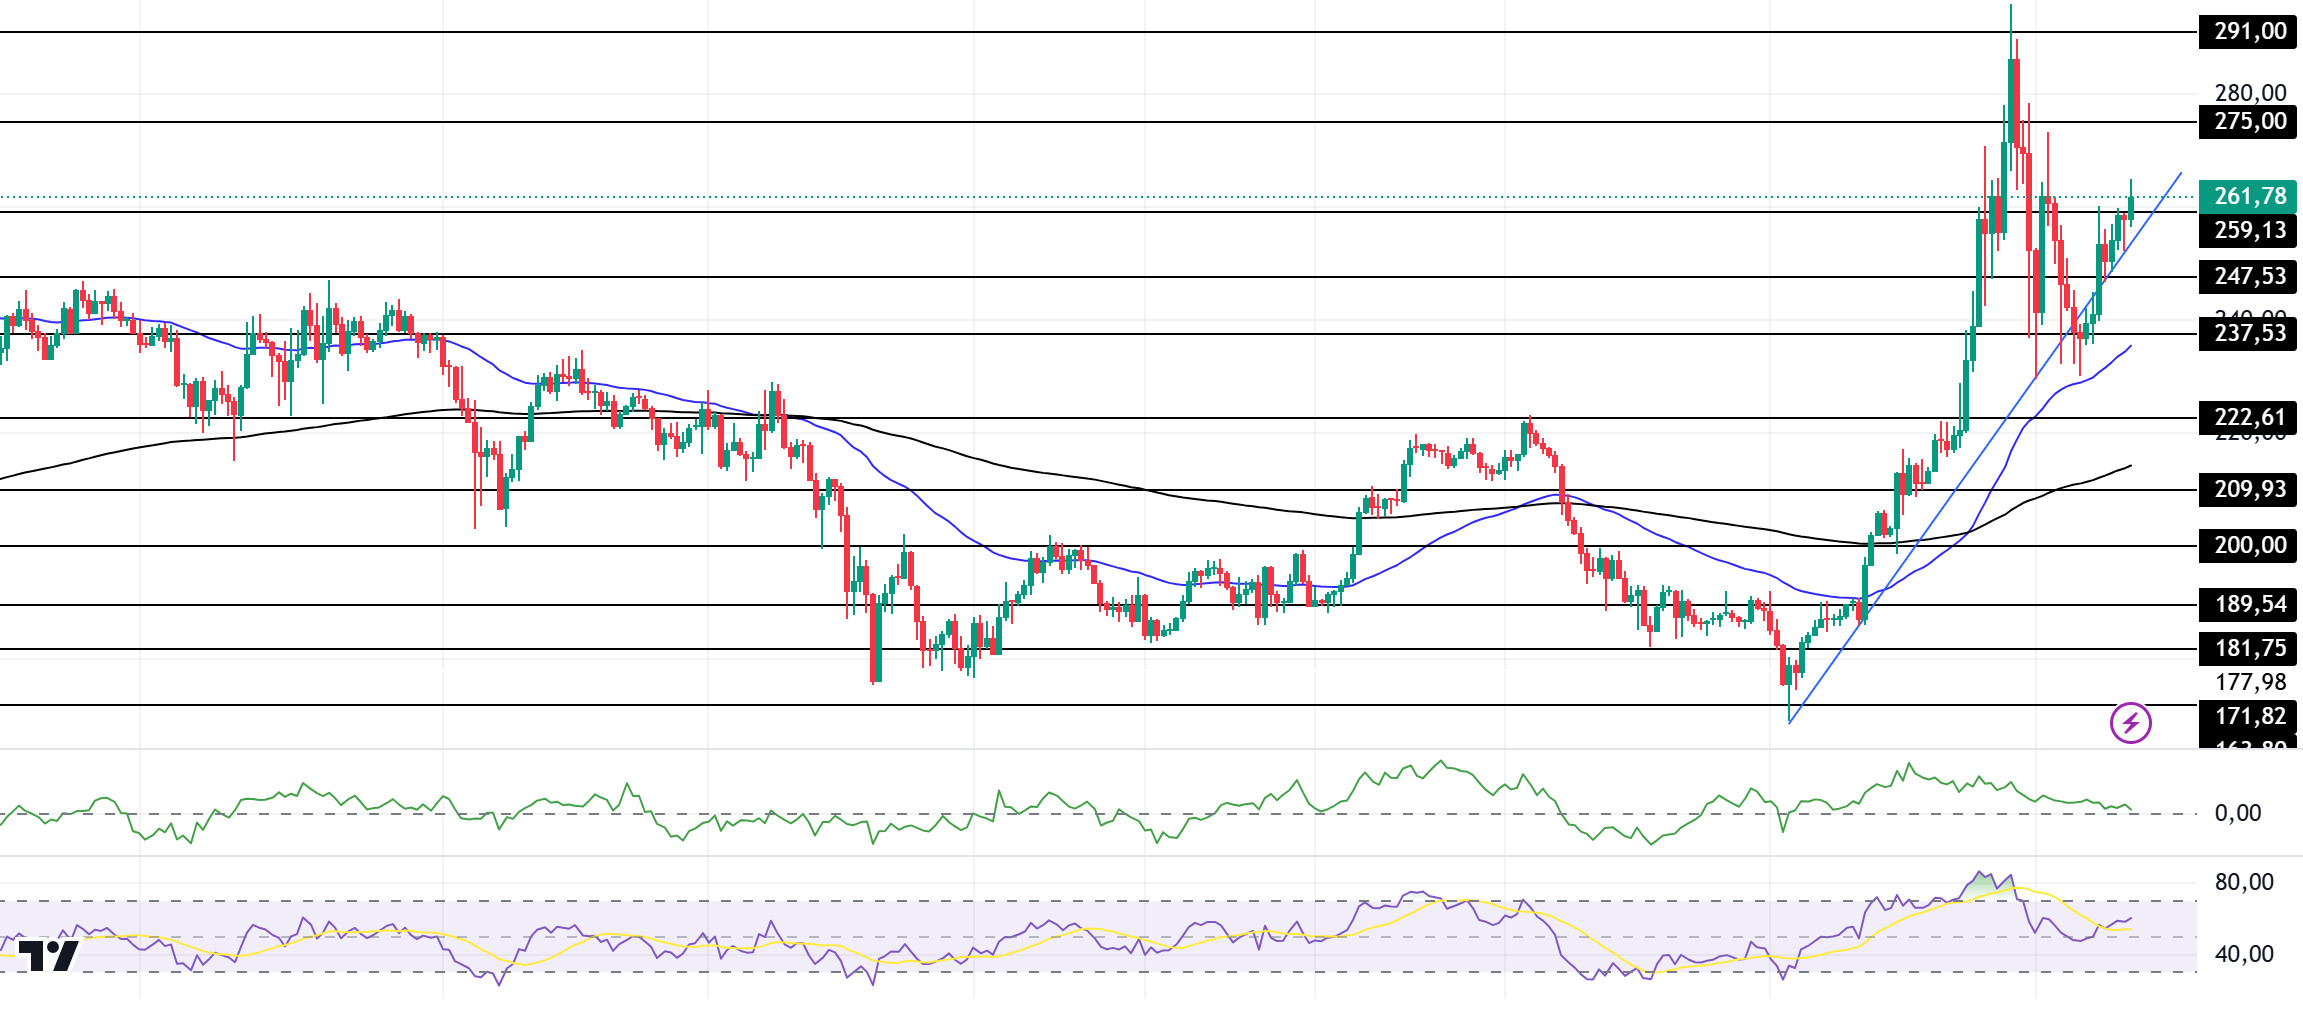
The asset has been slightly bullish since our analysis in the morning. Testing the 50 EMA (Blue Line) as support, the asset rallied from there and also broke the base of the uptrend since January 13 to the upside and re-entered the uptrend. The asset continues to be above the 50 EMA (Blue Line) 200 EMA (Black Line) on the 4-hour timeframe. This could mean that the uptrend will continue in the medium term. At the same time, the asset is above the 50 EMA and 200 EMA. When we examine the Chaikin Money Flow (CMF)20 indicator, it approached the neutral zone. However, the Relative Strength Index (RSI)14 indicator is in the middle of the positive zone. The 291.00 level stands out as a very strong resistance point in the rises driven by both the upcoming macroeconomic data and the news in the Solana ecosystem. If it breaks here, the rise may continue. In case of retracements for the opposite reasons or due to profit sales, the 209.93 support level can be triggered. If the price reaches these support levels, a potential bullish opportunity may arise if momentum increases.
Supports 247.53 – 237.53 – 222.61
Resistances 259.13 – 275.00 – 291.00
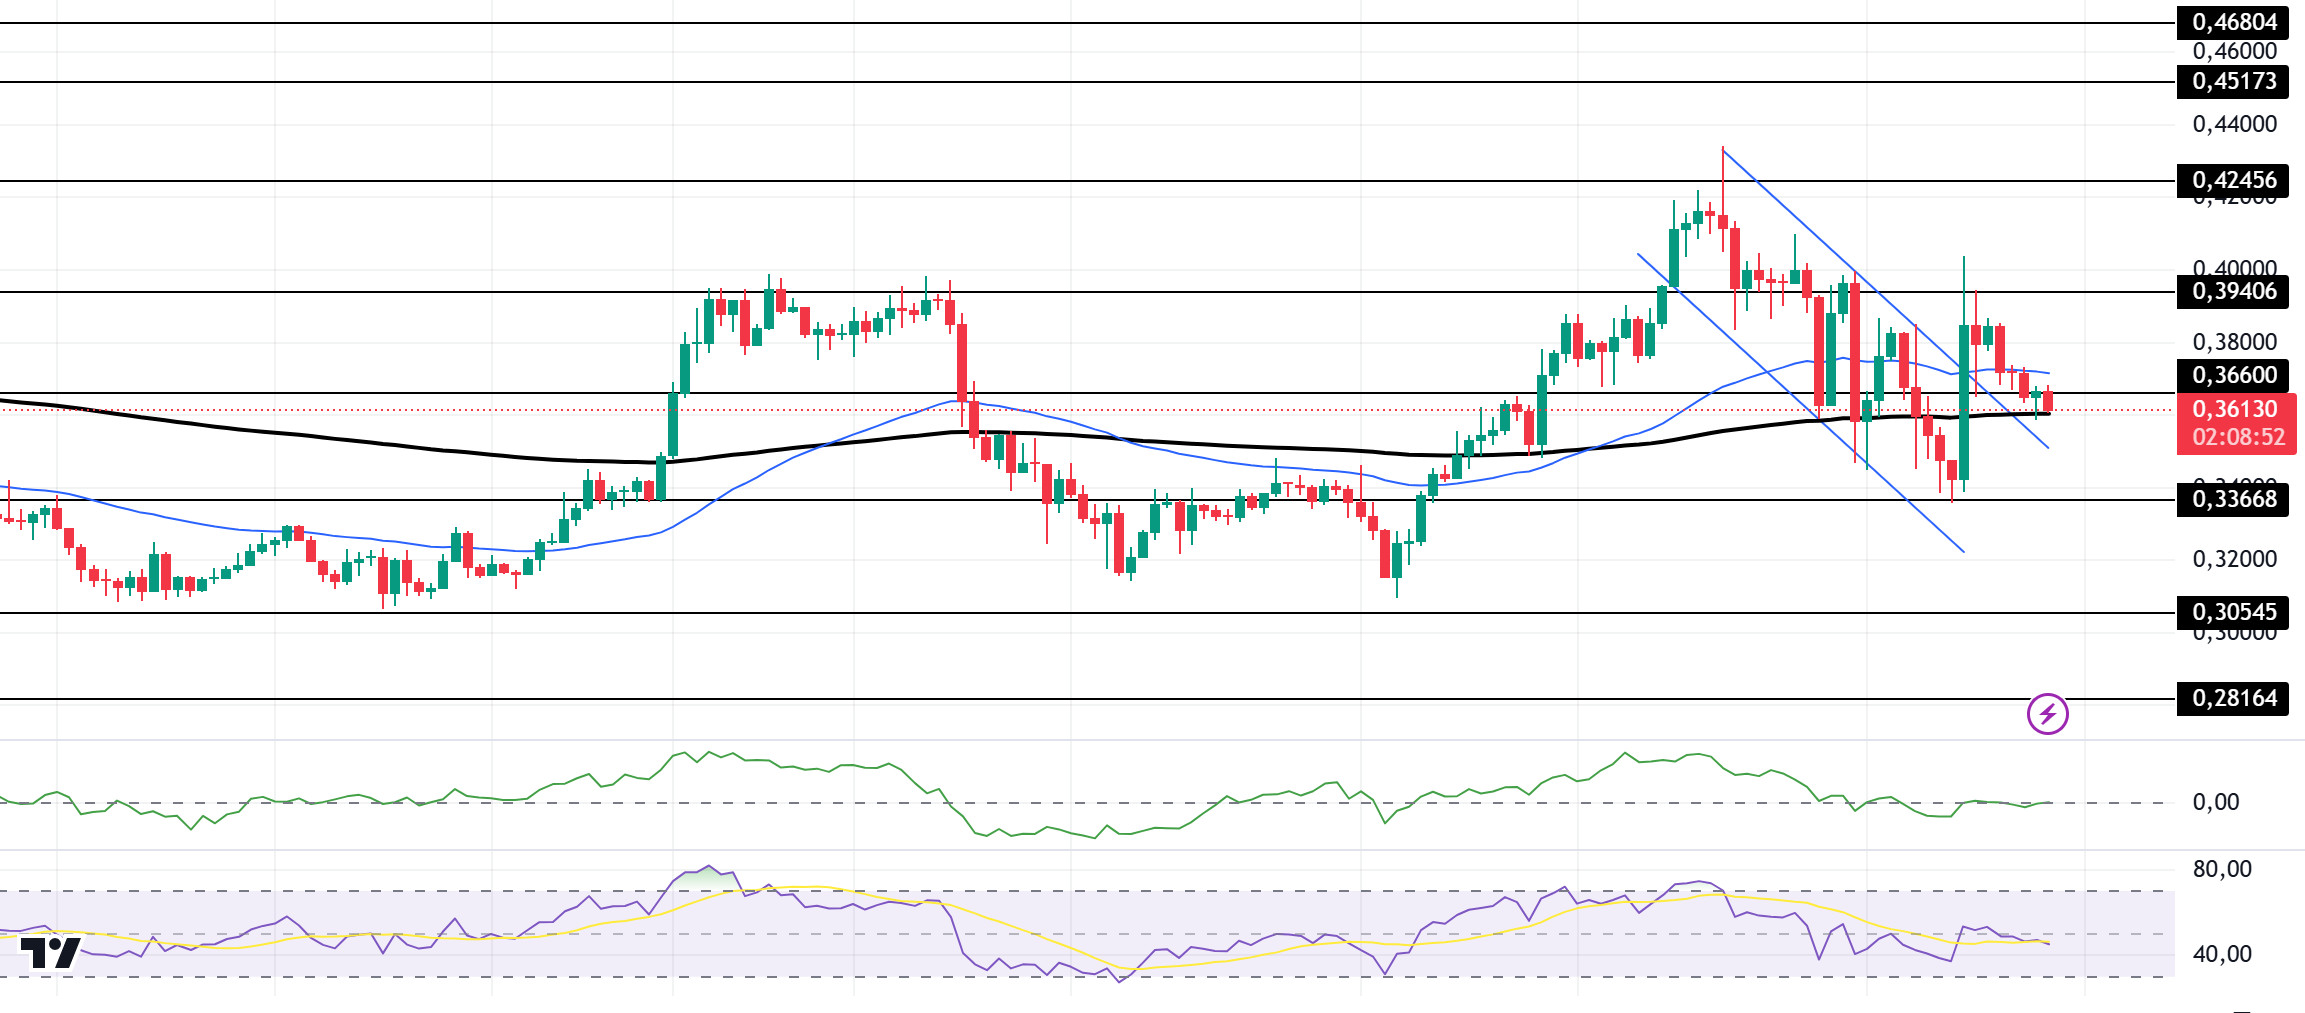
DOGE/USDT
After yesterday’s spike, Doge broke the downtrend that had been in place since January 18. However, it has pulled back and is testing the top line of the downtrend and also the 200 EMA (Black Line) at the time of writing. On the 4-hour timeframe, the asset is stuck between the 50 EMA (Blue Line) and the 200 EMA (Black Line). The 50 EMA continues to hover above the 200 EMA. This could be the beginning of a medium-term uptrend. When we examine the Chaikin Money Flow (CMF)20 indicator, it has moved to the neutral zone and money inflows are balanced. However, Relative Strength Index (RSI)14 is in negative territory. The 0.42456 level stands out as a very strong resistance point in the rises due to political reasons, macroeconomic data and innovations in the DOGE coin. In case of possible pullbacks due to political, macroeconomic reasons or negativities in the ecosystem, the 0.33668 level, which is the base level of the trend, is an important support. If the price reaches these support levels, a potential bullish opportunity may arise if momentum increases.
Supports 0.36600 – 0.33668 – 0.30545
Resistances 0.39406 – 0.42456 – 0.45173
LEGAL NOTICE
The investment information, comments and recommendations contained herein do not constitute investment advice. Investment advisory services are provided individually by authorized institutions taking into account the risk and return preferences of individuals. The comments and recommendations contained herein are of a general nature. These recommendations may not be suitable for your financial situation and risk and return preferences. Therefore, making an investment decision based solely on the information contained herein may not produce results in line with your expectations.
