
MARKET SUMMARY
Latest Situation in Crypto Assets
| Assets | Last Price | 24h Change | Dominance | Market Cap. |
|---|---|---|---|---|
| BTC | 98,888.84 | -5.81% | 58.01% | 1,96 T |
| ETH | 3,079.88 | -7.72% | 10.98% | 371,08 B |
| XRP | 2.865 | -8.52% | 4.88% | 164,79 B |
| SOLANA | 227.89 | -11.79% | 3.28% | 110,59 B |
| DOGE | 0.3160 | -10.75% | 1.38% | 46,63 B |
| CARDANO | 0.8956 | -9.28% | 0.93% | 31,46 B |
| TRX | 0.2368 | -6.55% | 0.60% | 20,38 B |
| LINK | 23.27 | -8.85% | 0.44% | 14,84 B |
| AVAX | 34.18 | -9.78% | 0.42% | 14,04 B |
| SHIB | 0.00001795 | -10.57% | 0.31% | 10,57 B |
| DOT | 5.762 | -9.34% | 0.26% | 8,89 B |
*Prepared on 1.27.2025 at 07:00 (UTC)
WHAT’S LEFT BEHIND
US President Trump’s Message of Support for Bitcoin Investors
US President Donald Trump sent a message of support to the Bitcoin community after a meeting with Bitcoin Magazine CEO David Bailey. Trump said that Bitcoin will move to much higher levels and countries like China will be left behind.
Trump’s Crypto Move Spurs Europe into Action
Trump’s decree to create a legal framework for stablecoins resonated in Europe. ECB Executive Board Member Piero Cipollone stated that this move makes the need for a digital euro even more evident.
Phemex Hack: 69.1 Million Dollar Loss
The balance sheet of the Phemex exchange, which is thought to have been attacked by North Korean hackers, has become clear. A total of $69.1 million in crypto assets were stolen, including Ethereum, Bitcoin and XRP. The exchange announced that it will launch USDT and USDC withdrawals.
Pump.fun Breaks Single Day Revenue Record
Meme coin platform Pump.fun broke a record on January 24 with daily fee revenue of $15.38 million. The platform attracted attention by achieving a transaction volume of $4 billion in the last two weeks.
USDC Treasury Prints 250 Million USDCs on the Solana Chain
According to Whale Alert, USDC Treasury minted 250 million USDC on the Solana chain. In total, Circle has produced 5.25 billion USDC since January 2.
DeepSeek Overtakes ChatGPT in the US
DeepSeek, developed by Hangzhou DeepSeek, has overtaken ChatGPT to top Apple’s free app download rankings in China and the US.
HIGHLIGHTS OF THE DAY
Important Economic Calender Data
| Time | News | Expectation | Previous |
|---|---|---|---|
| Chiliz (CHZ): Zurich Meetup | – | – | |
| Floki (FLOKI): AMA on X (Twitter) | – | – | |
| 15:00 | US New Home Sales (Dec) | 669K | 664K |
INFORMATION
*The calendar is based on UTC (Coordinated Universal Time) time zone.
The economic calendar content on the relevant page is obtained from reliable news and data providers. The news in the economic calendar content, the date and time of the announcement of the news, possible changes in the previous, expectations and announced figures are made by the data provider institutions. Darkex cannot be held responsible for possible changes that may arise from similar situations.
MARKET COMPASS
Global markets, which have been shaped by US President Trump’s statements and the policies he has put into force, are drawing attention this morning with the rise of China’s DeepSeek artificial intelligence application. The app topped Apple’s iPhone download charts and fueled concerns that it could shake the US leadership in artificial intelligence. On the other hand, this week all eyes will be on the results of the US Federal Reserve’s (FED) first meeting of the year and the balance sheets of major companies.
Digital assets lacked a new catalyst over the weekend, which would have been necessary for the continuation of the uptrend. Major cryptocurrencies lost value despite the positive news flow. For the long term, we remain bullish, as discussed below. For the short term, as we mentioned in Friday’s evening report, our last published daily analysis, we think that we are watching a price change in line with our forecast that the lack of bullish ground could bring pressure and that we may see intermediate rebounds.
From the short term to the big picture.
The victory of former President Trump on November 5, one of the main pillars of our bullish expectation for the long-term outlook in digital assets, produced a result in line with our predictions. In the aftermath, the appointments made by the president-elect and the increasing regulatory expectations for the crypto ecosystem in the US and the emergence of BTC as a reserve continued to be in our equation as positive variables. Then, 4 days after the new President took over the White House, he signed the decree of the Cryptocurrency Work Unit, which was among his election promises, and we think that the outputs that this will produce in the coming days will continue to reflect positively on digital assets.
On the other hand, although it is expected to continue at a slower pace, the expectations that the FED will continue its interest rate cut cycle (for now) and the fact that the volume in ETFs based on crypto assets indicates an increase in institutional investor interest support our upward forecast for the big picture for now. In the short term, given the nature of the market and pricing behavior, we think it would not be surprising to see occasional pauses or pullbacks in digital assets. However, at this point, it is worth emphasizing again that we think that the fundamental dynamics continue to support the rise.
TECHNICAL ANALYSIS
BTC/USD
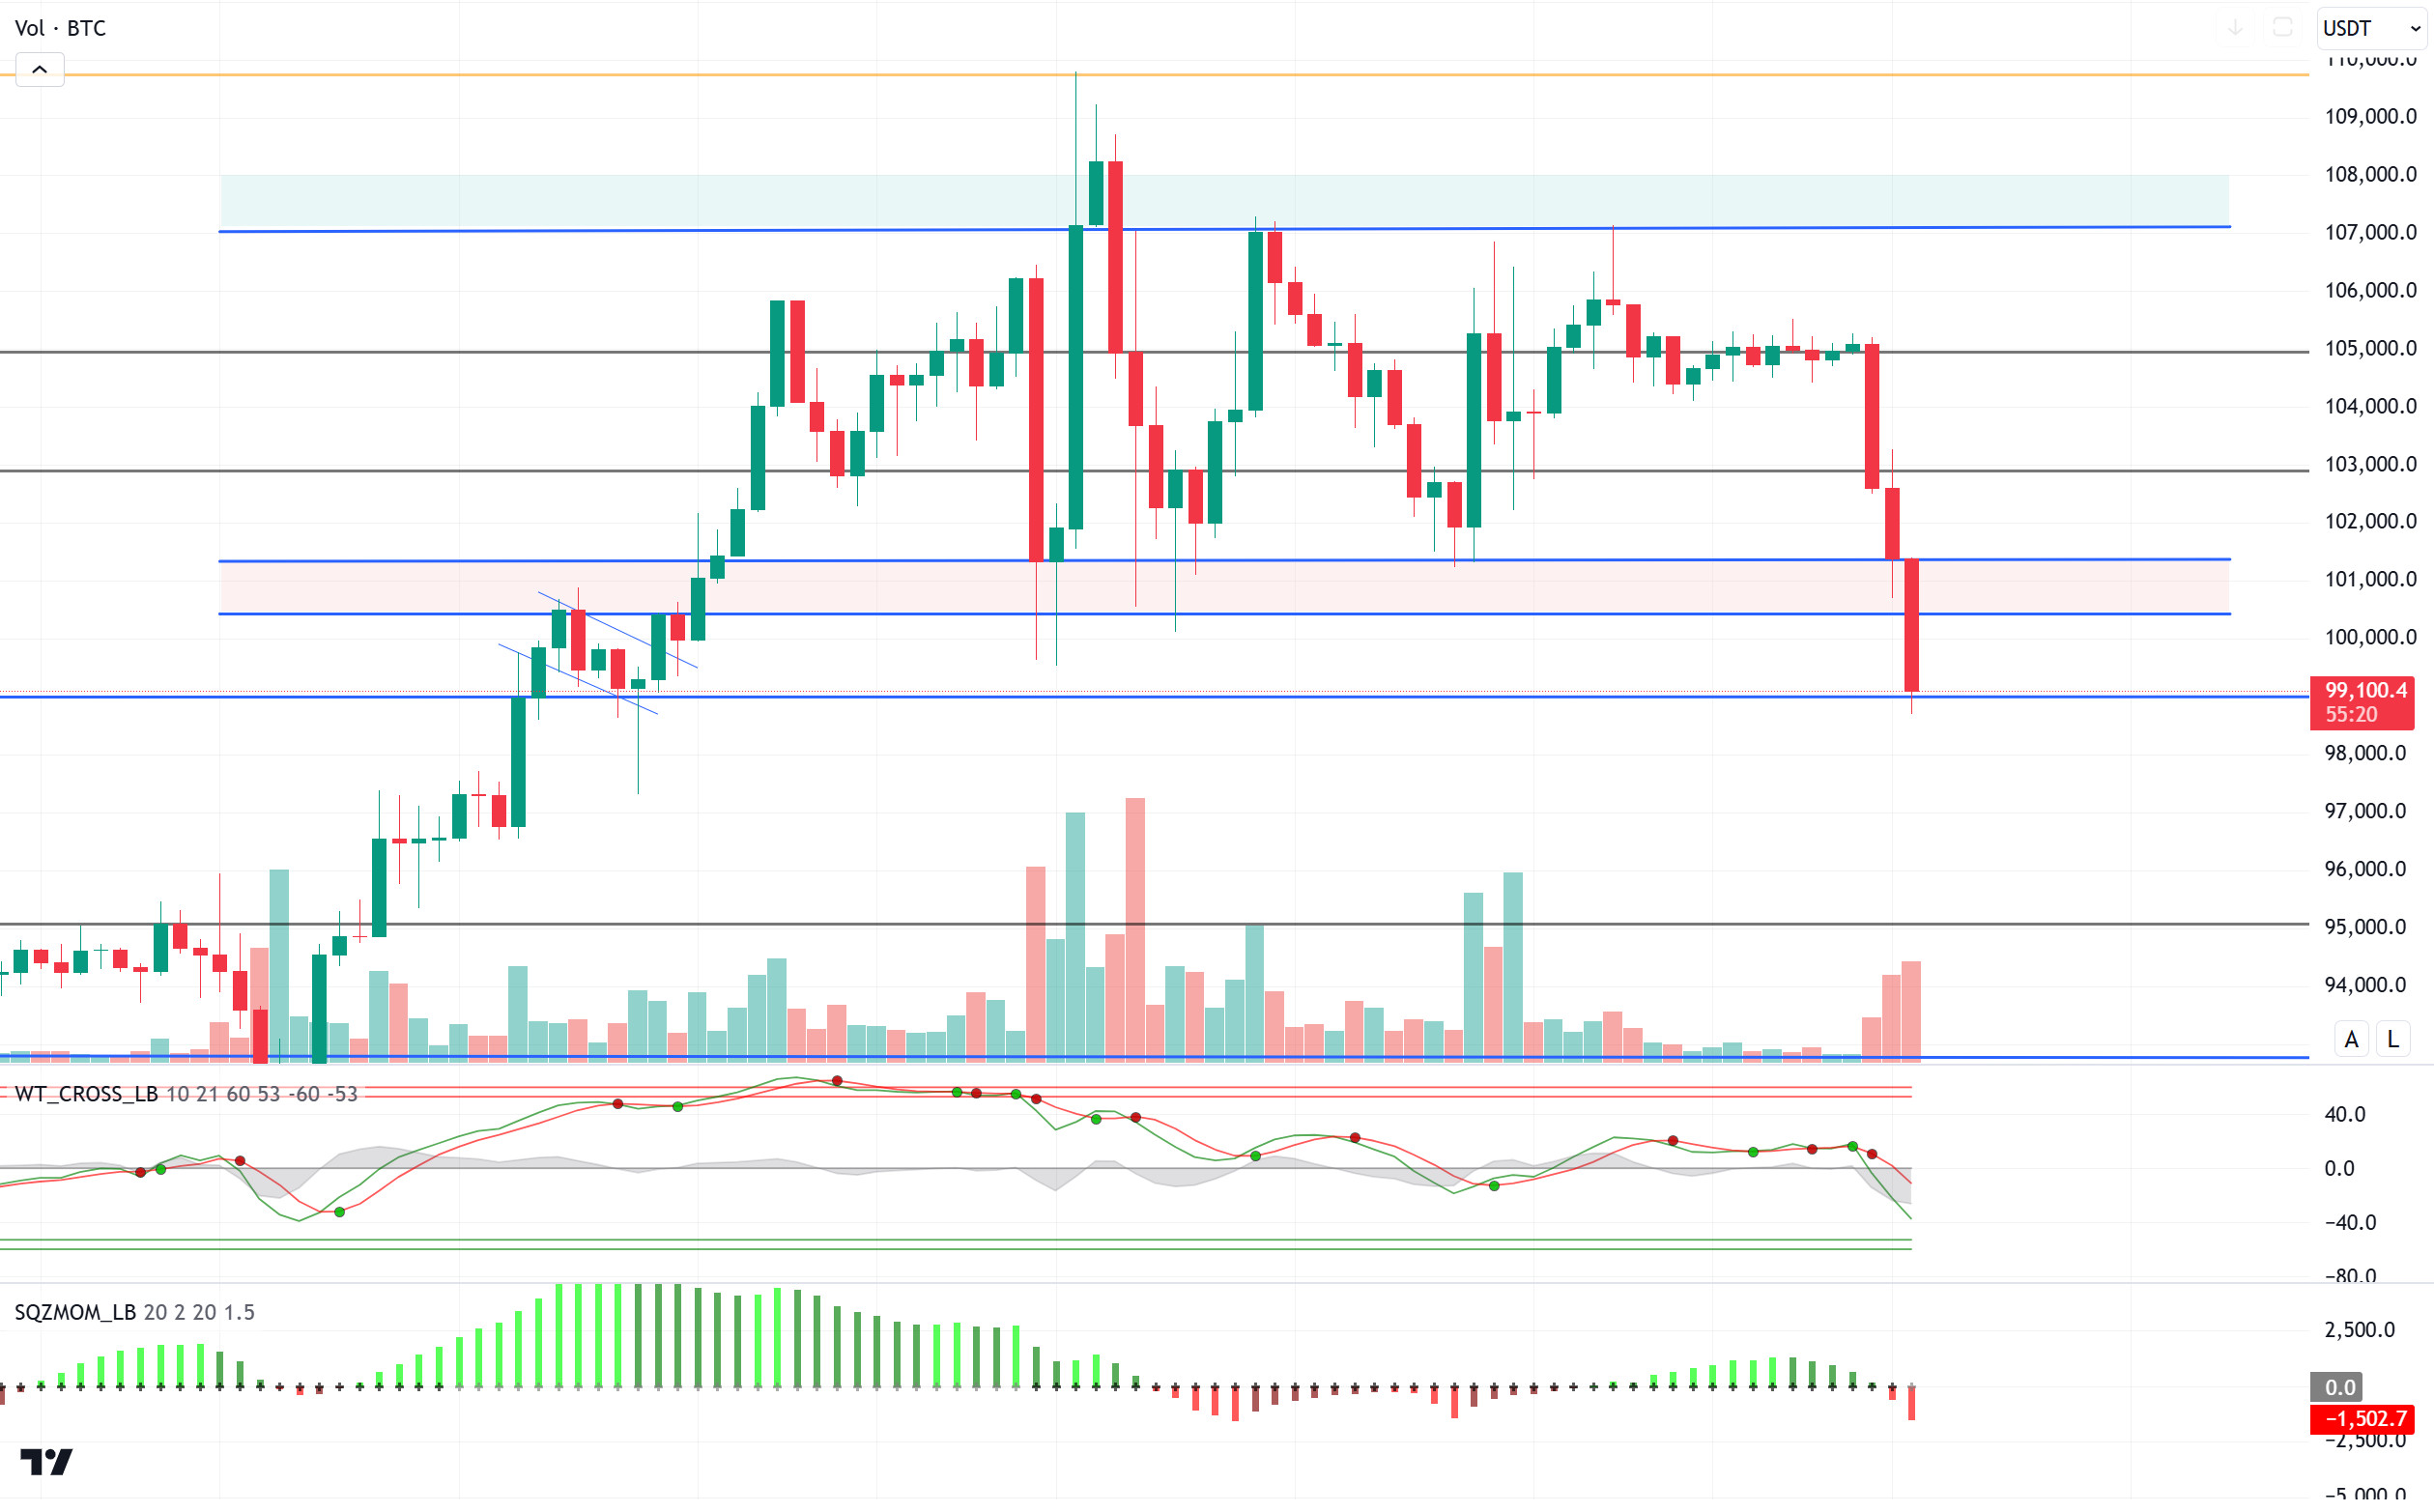
Bitcoin, which spent the weekend at 105,000 levels with low volatility, started the first day of the week with a sharp decline and fell below six-digit levels. President Donald Trump’s reiteration of his support for Bitcoin was not enough to stop this decline. According to weekly liquidation data, long positions concentrated between the 99,000 and 101,000 levels were liquidated.
Looking at the technical outlook, BTC, which moved at 105,000 resistance over the weekend, retreated sharply to 98,700 levels. As of now, technical oscillators continue to maintain the sell signal in BTC, which continues to be under selling pressure and is trading around 99,000. The momentum indicator is in negative territory again. Closures below the support point of 99,100 may deepen the selling pressure and bring the 97,200 level back to the agenda. In case of a correction of the decline, we will follow the price back above six-digit levels.
In BTC, where selling pressure continues before the FED interest rate decision, eyes will be on the Wednesday FED interest rate decision, although no interest rate cut is expected in the market, Trump’s low interest rate emphasis on FED members can give us a message about the direction of the market.
Supports 99,100 – 98,000 – 97,200
Resistances 101,400 – 102,800 – 105,000
ETH/USDT
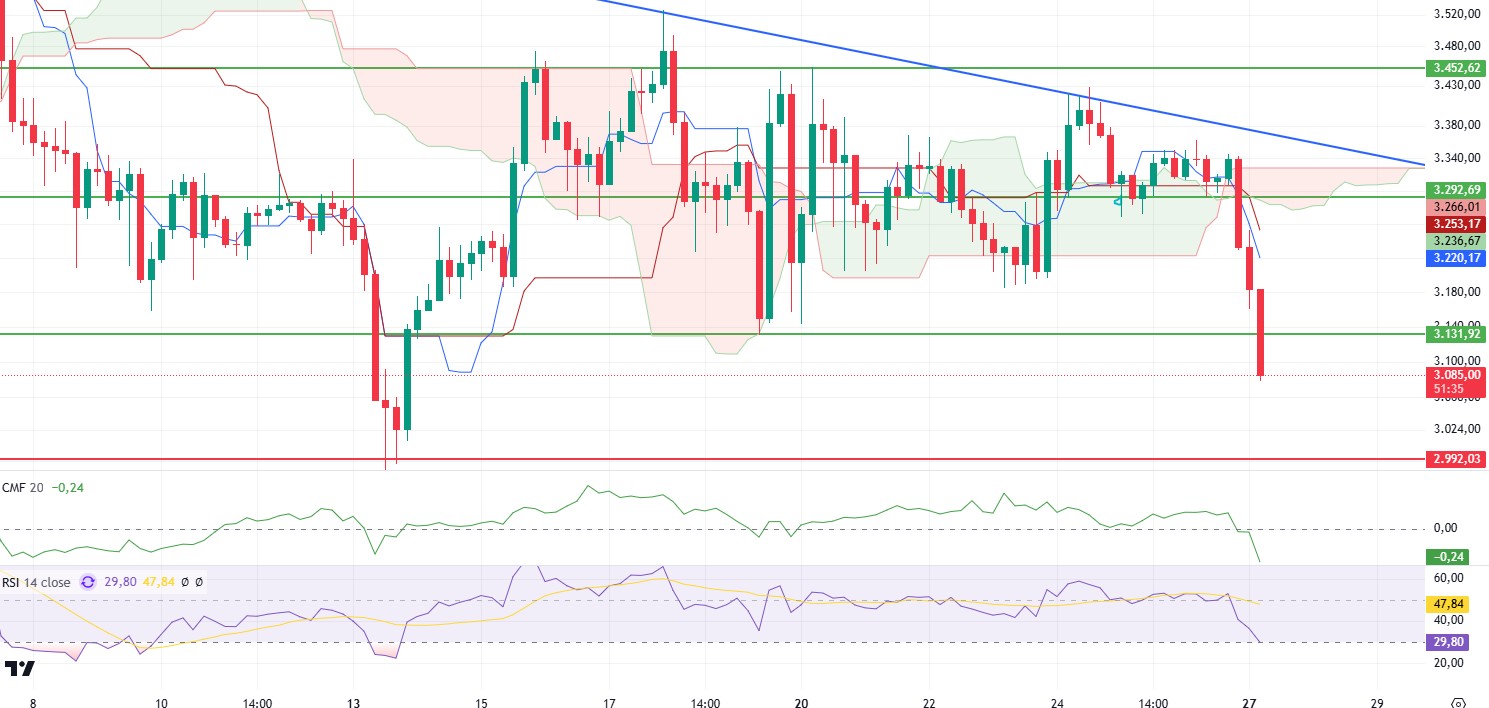
With the sharp drop last night, ETH has started the week below important support levels. With this move, the critically important 3,131 zone was also breached and the price continues to remain under downward pressure. Along with the decline, there were also significant changes in market dynamics. Open interest declined sharply after a long time, suggesting that market participants have shifted to a more cautious approach. However, Cumulative Volume Delta (CVD) data confirms that the selling pressure was mainly driven by futures.
Technical indicators also support the downtrend. Chaikin Money Flow (CMF) fell as low as -0.25, indicating that the selling pressure is quite strong. The Relative Strength Index (RSI), on the other hand, re-entered oversold territory, indicating that the market’s momentum is weakening, although it can be said that reaction buying may still remain weak as there is no positive divergence. When we look at the Ichimoku indicator, the tenkan line crossing the kijun line downwards and the loss of the kumo cloud stand out as another important signal that strengthens the negative outlook of the market.
The overall picture is that with this deep decline, market momentum has been severely weakened and critical resistance levels have been breached. If the 3,131 level cannot be regained, the price is likely to fall to the 2,992 support level. However, if a pricing above 3,131 can be achieved, the current negative outlook may end and the market may enter a slight recovery process.
Supports 2,992 – 2,890 – 2,781
Resistances 3,131 – 3,292 – 3,452
XRP/USDT
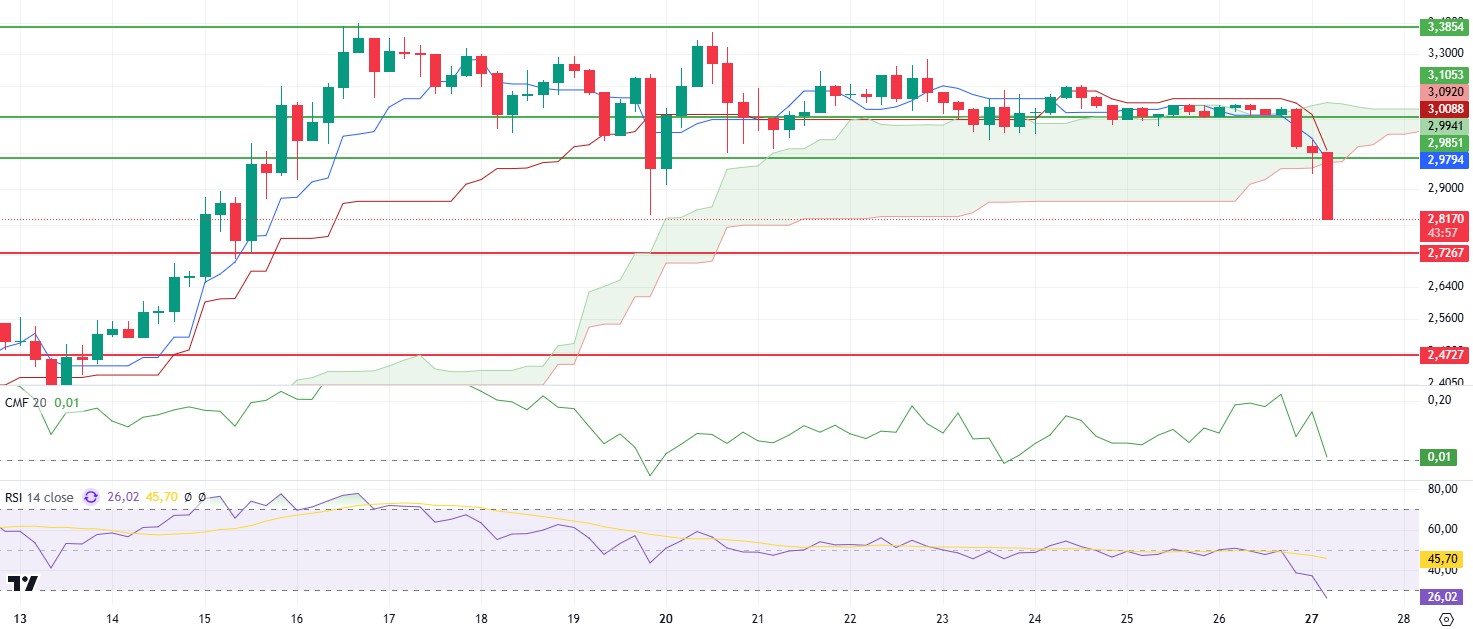
After the decline in the markets, XRP has also experienced a sharp decline, losing to the 2.98 level, which is a very important support zone. Technical indicators for XRP, which is currently pricing at 2.81, produce mixed signals.
First of all, looking at the ichimoku indicator, the loss of the kumo cloud contributes to the neagtive outlook. Chaikin Money Flow (CMF), on the other hand, managed to stay in the positive area despite the price decline, indicating that buyers remain relatively strong. Relative Strength Index (RSI) has entered the oversold zone and is at favorable levels for a potential reversal.
With this data, although we see that the price has retreated sharply, it seems likely that the price will get a reaction from here. Otherwise, a retracement to the 2.72 level seems possible. Violation of this region may bring much steeper declines.
Supports 3.7268 – 2.4727 – 2.1800
Resistances 2.9851 – 3.1053- 3.3854
SOL/USDT
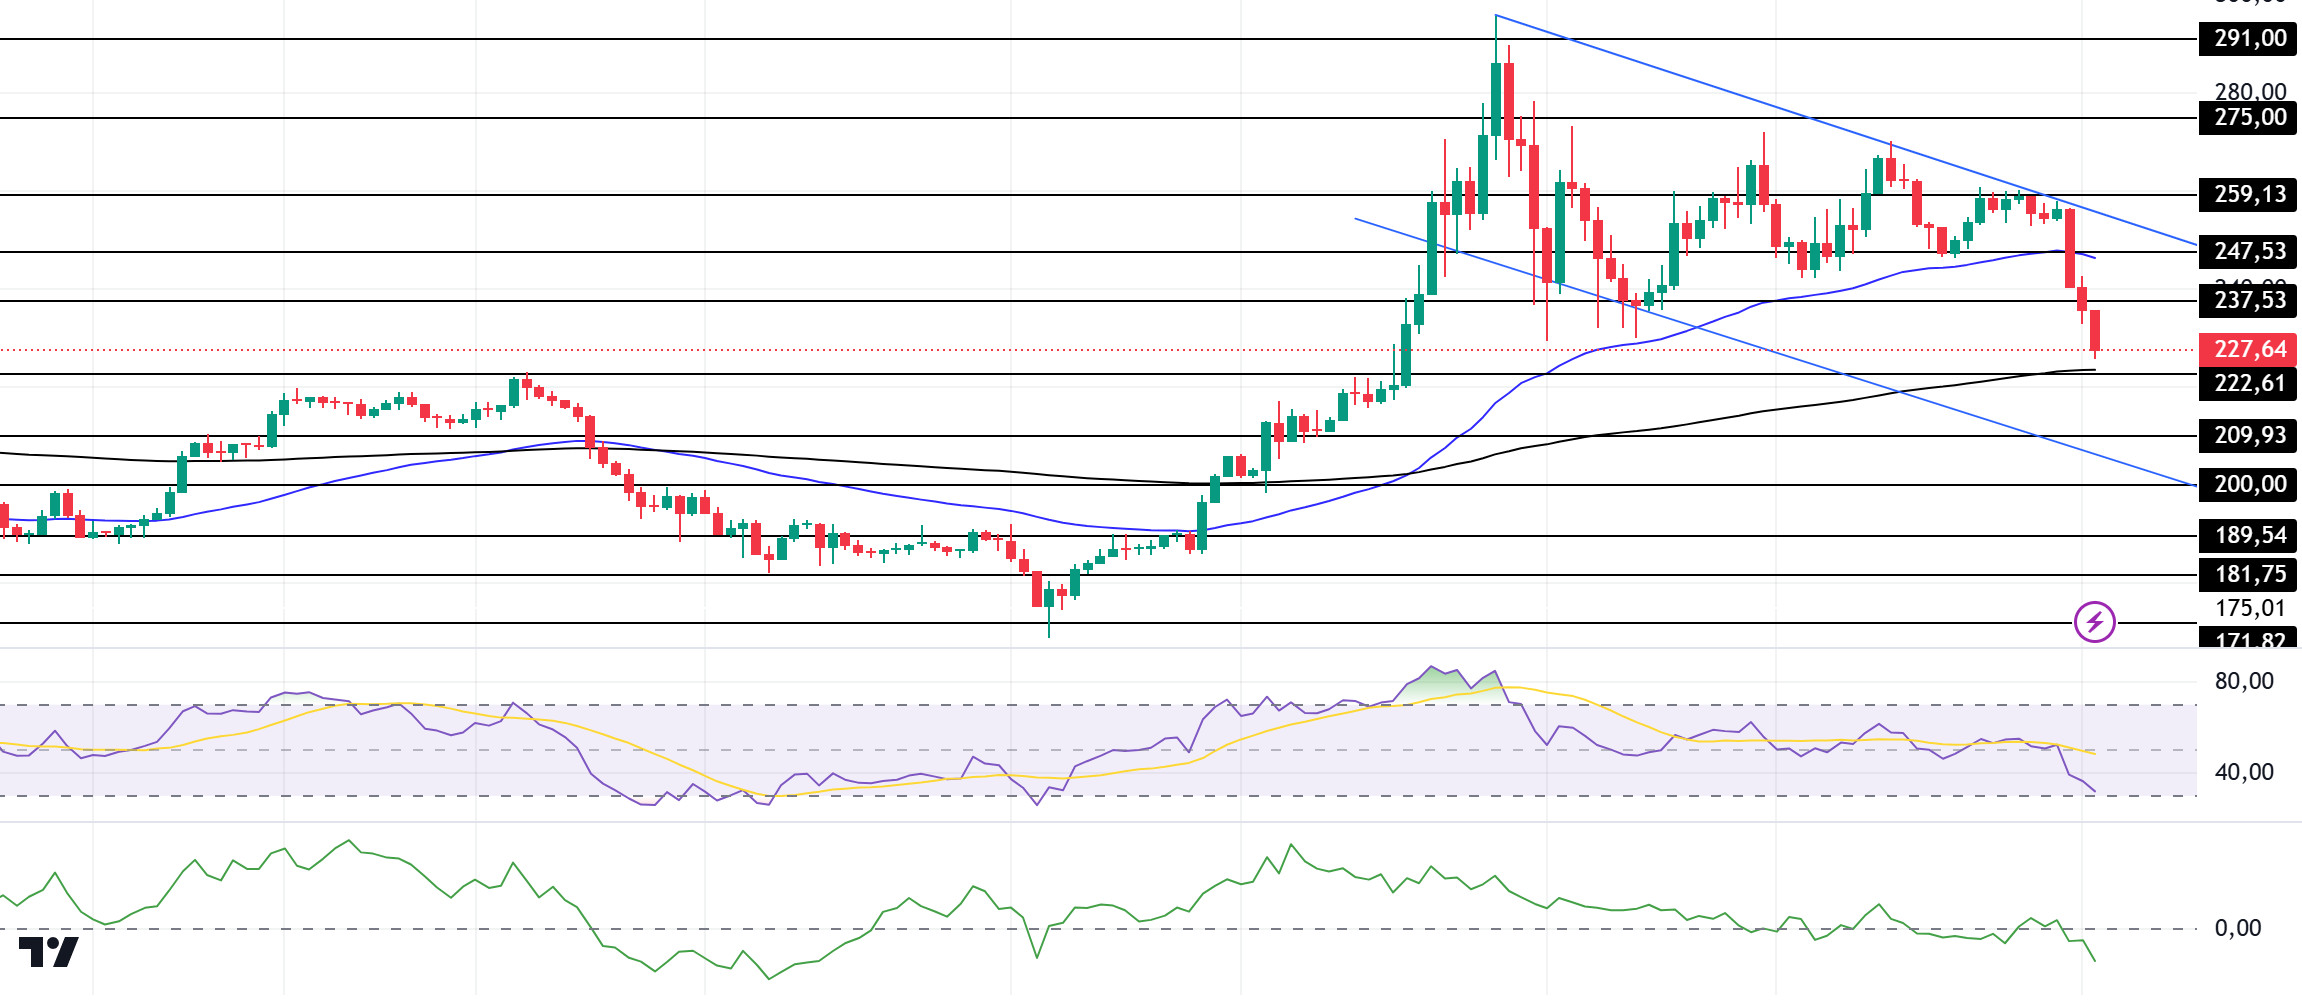
Solana’s market capitalization increased by $28 billion in 30 days on Trump’s crypto initiatives. But network congestion and 10x transaction fees revealed scalability issues. SVM blockchains were introduced to improve scalability and interoperability. Phantom wallet stated that it aims for user growth with smooth network migration. On the other hand, Solana’s price dropped by 12.17% and $14.98 million was liquidated, mostly from long positions. Trading volume fell 41.27%, indicating a decrease in market activity.
SOL continued to maintain the downtrend that started on January 19. On the 4-hour timeframe, the 50 EMA (Blue Line) remains above the 200 EMA (Black Line). This could mean that the uptrend will continue in the medium term. At the same time, the asset is located between the 50 EMA and the 200 EMA. When we examine the Money Flow (CMF)20 indicator, it came from the neutral zone to the middle levels of the negative zone and money outflows increased. However, the Relative Strength Index (RSI)14 indicator came to the oversold zone. This can be seen as a bullish opportunity. The 259.13 level appears to be a very strong resistance point in the rises driven by both the upcoming macroeconomic data and the news in the Solana ecosystem. If it breaks here, the rise may continue. In case of retracements for the opposite reasons or due to profit sales, the 209.93 support level can be triggered. If the price reaches these support levels, a potential bullish opportunity may arise if momentum increases.
Supports 222.61 – 209.93 – 200.00
Resistances 237.53 – 247.43 – 259.13
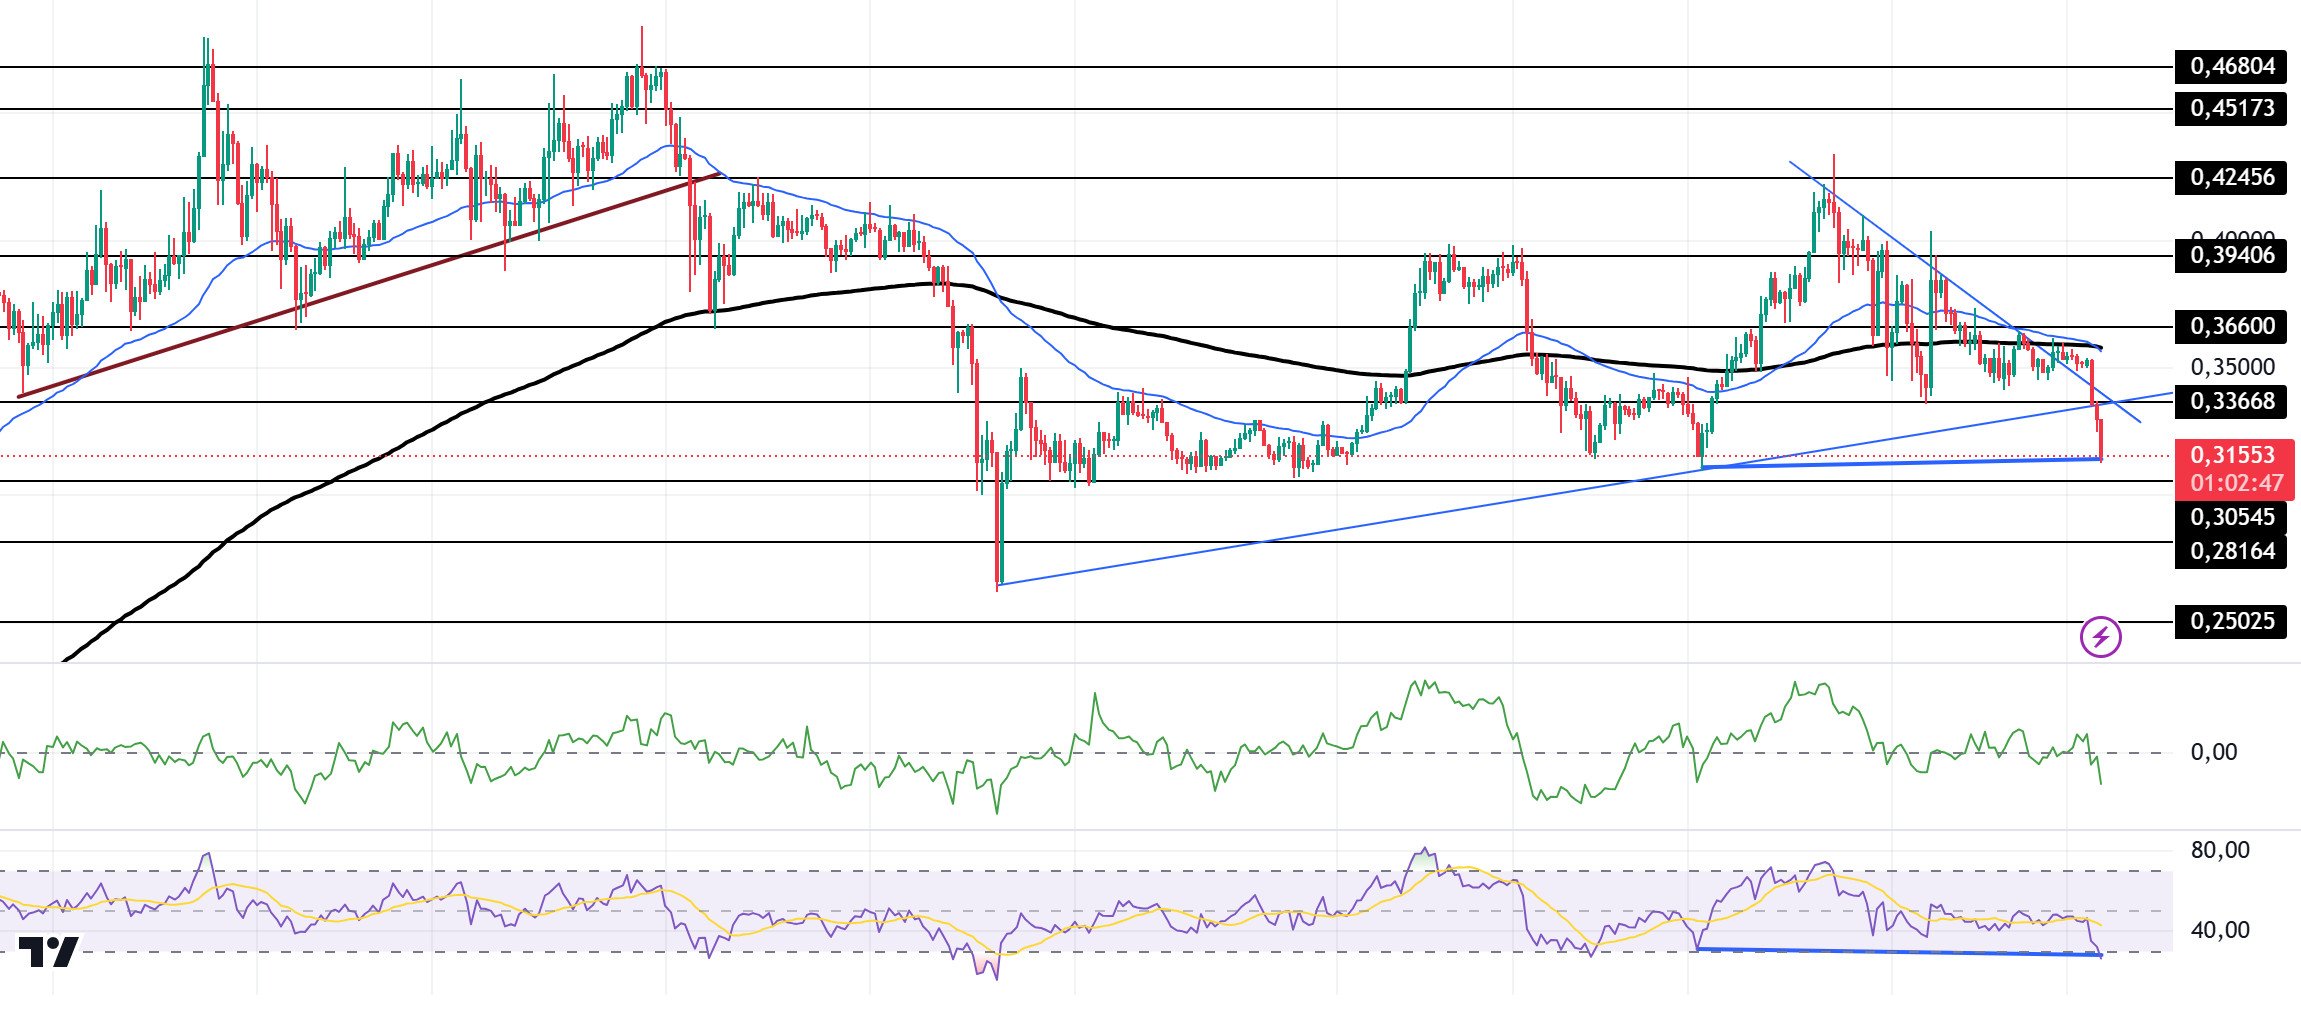
DOGE/USDT
Elon Musk’s DOGE Explores Blockchain for Government Efficiency: Bloomberg reported that the Department of Government Efficiency, or DOGE, is discussing the use of a public blockchain in its cost-cutting efforts.
DOGE broke the uptrend it started on December 20 with a strong downside candle. Facing strong resistance at the 50 EMA (Blue Line) and 200 EMA (Black Line), the asset failed to break it and started to decline. On the 4-hour timeframe, the 50 EMA is now below the 200 EMA. This may mean that the decline may deepen in the medium term. At the same time, the price is below the 50 EMA (Blue Line) and the 200 EMA (Black Line). When we examine the Chaikin Money Flow (CMF)20 indicator, it moved from positive to negative territory and money outflows increased. However, Relative Strength Index (RSI)14 is in oversold territory. On the other hand, the bullish mismatch is noticeable on the RSI. The 0.39406 level stands out as a very strong resistance point in the rises due to political reasons, macroeconomic data and innovations in the DOGE coin. In case of possible pullbacks due to political, macroeconomic reasons or negativities in the ecosystem, the 0.28164 level, which is the base level of the trend, is an important support. If the price reaches these support levels, a potential bullish opportunity may arise if momentum increases.
Supports 0.30545 – 0.28164 – 0.25025
Resistances 0.33668 – 0.36600 – 0.39406
LEGAL NOTICE
The investment information, comments and recommendations contained herein do not constitute investment advice. Investment advisory services are provided individually by authorized institutions taking into account the risk and return preferences of individuals. The comments and recommendations contained herein are of a general nature. These recommendations may not be suitable for your financial situation and risk and return preferences. Therefore, making an investment decision based solely on the information contained herein may not produce results in line with your expectations.

