
BTC/USDT
We left behind a week with high volatility in Bitcoin and sharp fluctuations in prices. During this period of important developments in the cryptocurrency world, the inauguration ceremony of President D. Trump, known for his pro-crypto stance, took place. Trump, who did not make a statement on cryptocurrencies at the ceremony, signed an executive order evaluating the creation of a national digital asset reserve and banning CBDC the day after the ceremony. He also reiterated his goal of making the US a world center for cryptocurrency.
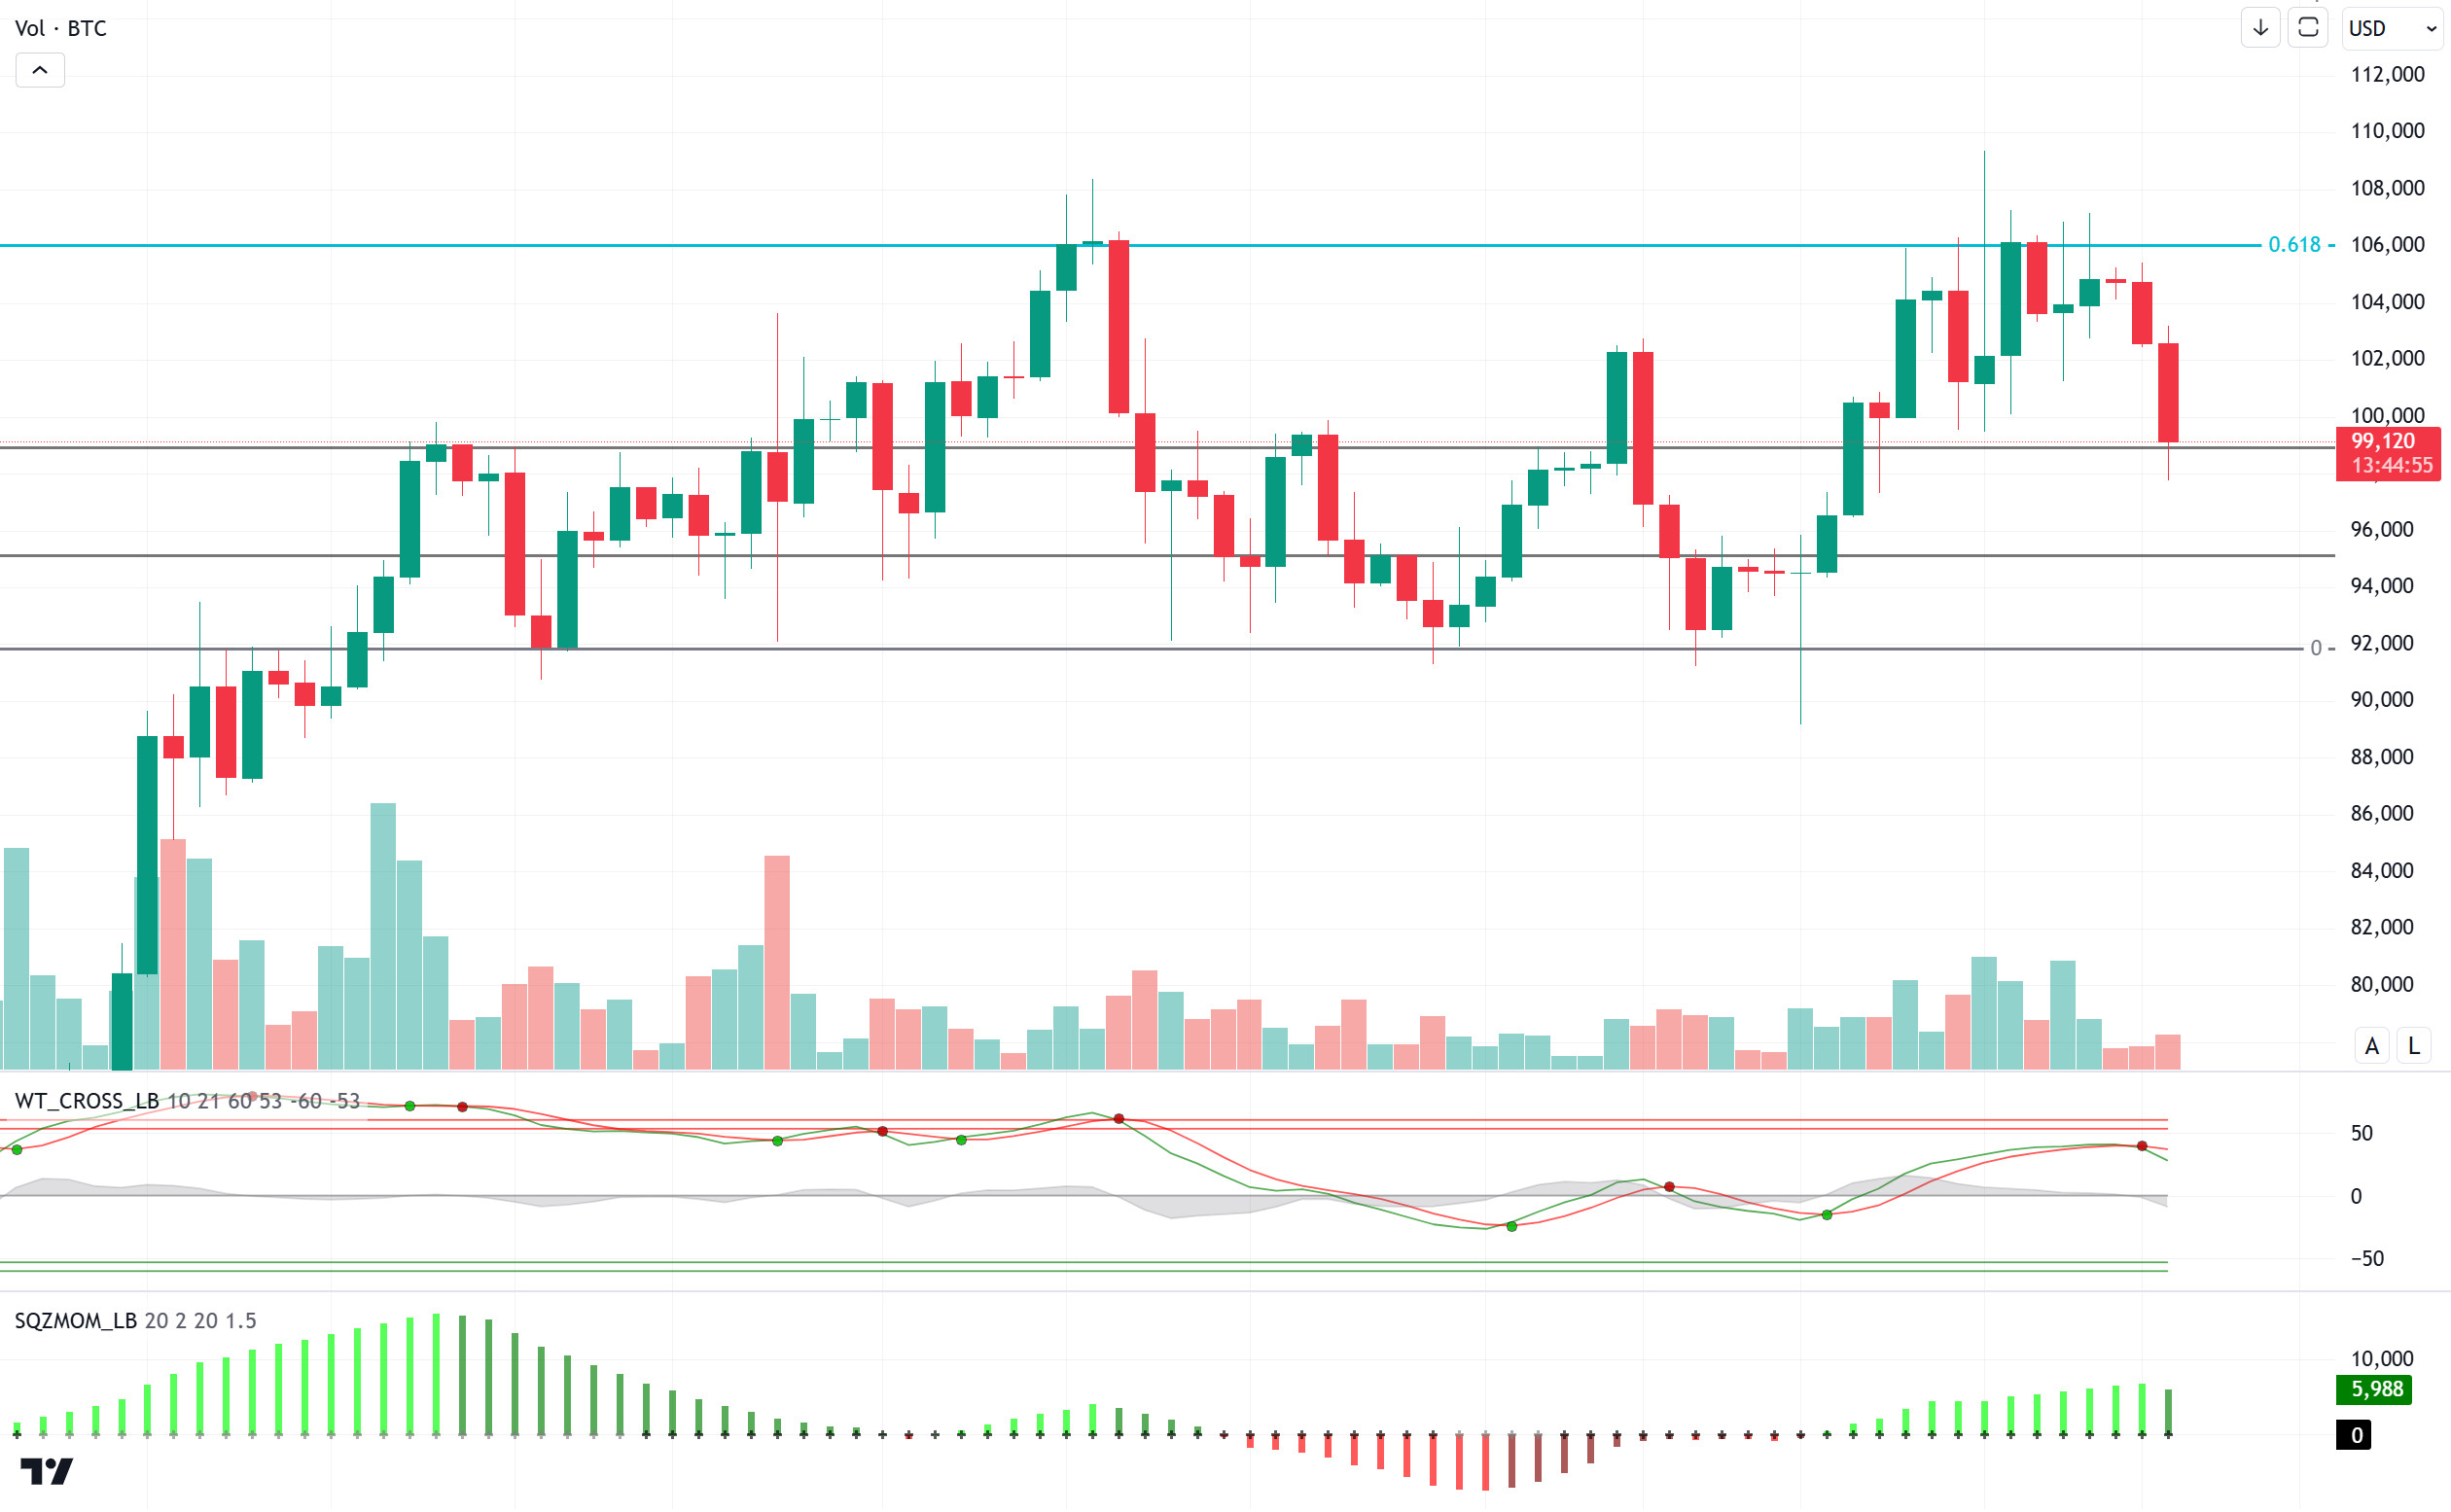
When we look at the technical outlook from a daily perspective, the price, which moved between 105,000 and 107,000 during the week and pushed the ATH level, experienced a sharp retreat and tested the 97,700 point. Last week, it erased its weekly gains of up to 14% last week and closed 1.85% lower this week. Currently trading at the 99,000-support level, BTC’s momentum indicator continues to weaken while technical oscillators continue to maintain the sell signal on the daily outlook. In case the decline deepens, the 95,000 level appears as a major support zone, while we will follow a possible recovery to settle above six-digit levels.
This week, the impact of Trump, who emphasized low interest rates, on the FED interest rate meeting will be carefully monitored. The attitude of FED members on interest rate cuts at the meeting, where no interest rate cut is expected, is critical for the future of the market.
Supports 99,100 – 97,200 – 95,000
Resistances 101,400 – 103,400 – 105,000
ETH/USDT
Last week, there were a number of important developments that led to high volatility in both traditional and crypto asset markets. In particular, US President Donald Trump’s statements after his inauguration increased the volatility in the markets. Trump’s instructions at the World Economic Forum to expand national digital asset reserves and his intention to create an internal working group to make America the “crypto world capital” caused sudden and sharp movements in the ETH price. While this move demonstrated the potential for America to become more integrated into the crypto markets, it triggered price volatility, influencing investors’ short-term trading decisions. In addition, rumors about DeepSeek, an artificial intelligence bot developed by a Chinese team, added to the pressure on the market. Speculation that DeepSeek had developed a product powerful enough to outpace American tech giants with a small number of employees and a low budget led to sharp declines in Nasdaq technology stocks. This downturn had knock-on effects on the crypto market by increasing the perception of risk emanating from the tech sector, causing the ETH price to retreat towards critical support levels.
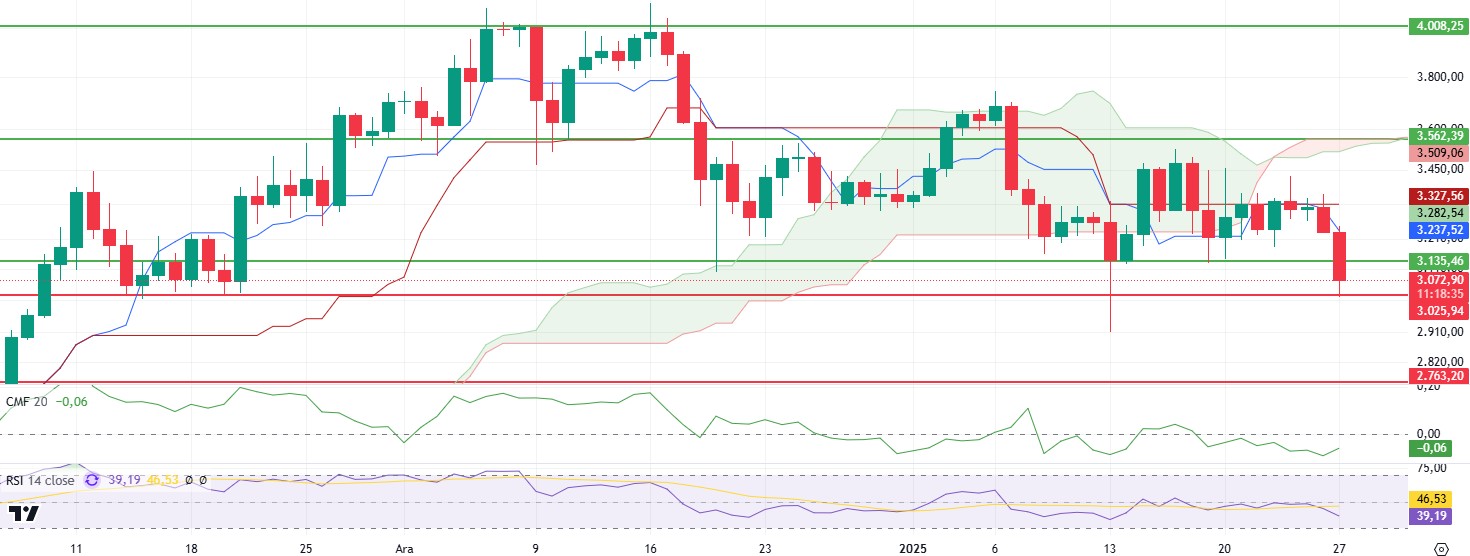
Technical indicators provide more information about the current state of the market. Chaikin Money Flow (CMF) is bullish despite the price decline, indicating that there is still appetite on the buy side of the market. In contrast, the Relative Strength Index (RSI) has not approached the oversold zone, falling in line with the price action, suggesting that the decline is within a limited area for the time being. However, the absence of any positive or negative divergence in the RSI emphasizes that the market is moving in a neutral zone, and critical levels should be closely monitored. On the Ichimoku indicator, the fall of the price below the kumo cloud, kijun and tenkan levels confirms the negative outlook of the market. This suggests that the current pressure is not yet over and sellers remain in control. While a break below the kumo cloud indicates that downside risks may continue in the short term, the price needs to re-enter the cloud for the market to change direction.
In light of this technical data, it is of great importance for the ETH price to maintain the $3,000 level. The $3,000 level is not only a psychological limit, but also a strong technical support level where buyers can step in. If this level can be maintained and the price can recover from here, it can be interpreted that the decline is a correction movement, and an uptrend may start again in the market. However, a break below $3,000 and daily closes below this level could weaken the momentum on the buy side. This may cause the price to move towards lower support zones. In particular, the $2,763 and $2,404 levels stand out as important support zones to follow in a downside scenario. On the other hand, the impact of DeepSeek-related developments on Nasdaq technology stocks may continue to indirectly affect the crypto market. If competition in the field of artificial intelligence increases and this causes fluctuations in technology stocks, investors may reorganize their positions in the crypto market depending on risk perception. Therefore, both the news flow in traditional markets and macroeconomic developments are among the key factors that will determine ETH price movements in the coming days.
Supports 3,025 – 2,763 – 2,404
Resistances 3,135 – 3,562 – 4,008
XRP/USDT
XRP, which moved relatively horizontally in the cryptocurrency market, where volatility was quite high with the developments of the past week, lost 2.84 support yesterday with a deep drop with the DeepSeek effect and lost 2.84 support, throwing a deep downward pin.
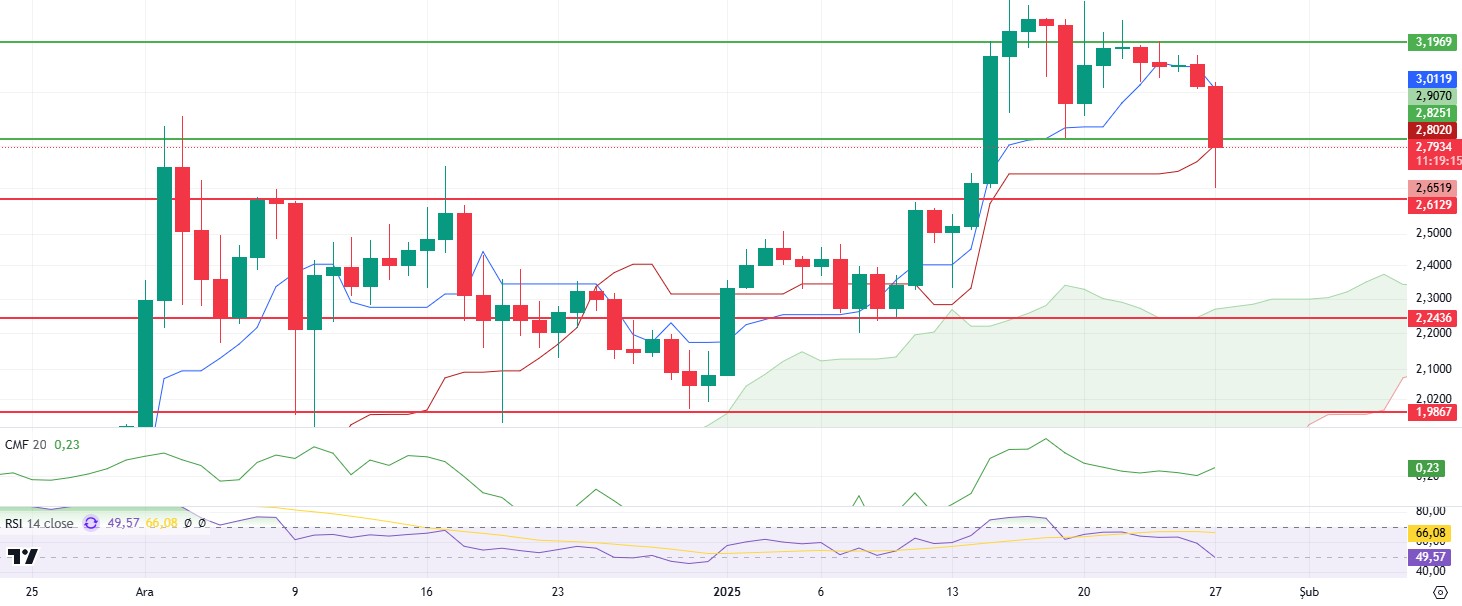
When technical indicators are analyzed, the Chaikin Money Flow (CMF) indicator rose in contrast to the price decline, indicating that buyers are still active in the market and capital inflows continue. However, Cumulative Volume Delta (CVD) analysis reveals that the selling pressure is mainly coming from the futures market. This suggests that short positions in futures have increased pressure on the spot market, but despite this pressure, buyers have yet to fully retreat. The Relative Strength Index (RSI) indicator continues its downtrend, moving with the price. Although this movement of the RSI indicates that the market is still weak in the short term, the fact that it has not approached the oversold zone suggests that the current decline may remain within a limited area. On the Ichimoku Kinko Hyo indicator, the fact that the price has momentarily regained kijun support and the price movements above the clouds continue suggests that the market has not yet moved to a completely negative outlook. According to Ichimoku, if the price continues to stay above the cloud, it can be interpreted that the pullbacks are a correction and the current trend can be maintained.
In light of this data, it is critical for the market’s chances of recovery that XRP does not lose the $2.60 support. If the 2.60 level is maintained, it seems likely that the price will rise above the 2.84 level again and break through this resistance and start an upward movement. However, a break of the 2.60 support and daily closes below this level could accelerate XRP’s downward movement, causing the price to fall to the main support at 2.24.
Supports 2.6129 – 2.2436 – 1.9867
Resistances 2.8251 – 3.1969 – 3.7151
SOL/USDT
Last week Solana had one of its historic moments. Trump’s ‘Official’ meme coin announced its launch on the X and Truth Social accounts. The fully diluted volume surpassed $14 billion within hours of the launch, making it one of the fastest growth rates in the crypto segment. Following Donald Trump’s memecoin launch, Solana hit an all-time high of $294.33. President Donald Trump’s team has reportedly increased their holdings in Solana, a leading cryptocurrency. Recent transactions show that Trump’s team has bought 412 more SOLs worth about $103,770. Another important development was Grayscale’s application for a SOL ETF. ProShares also filed for a Solana Futures ETF. On the other hand, Multichain Capital presented its proposal to reduce SOL inflation to 1.5%. It proposed a mechanism organized by share participation to set SOL inflation to a stable level of 1.5% per annum. Developer Cantelopepeel left the Solana and Firedancer projects after two years of work. As for Onchainde, last week, traders’ whale positions above $280 rose to 5,098 addresses. DEX trading volume exceeded $139.4 billion. Solana’s total transaction fees once again reached $50 million. Solana’s total value locked (TVL) exceeded $10 billion, its highest level since the FTX crash. Meanwhile, Solana stablecoin market capitalization surpassed $9 billion, up 53%. The value of stablecoins on the network has increased by nearly 110% since January, from $5.1 billion to $10.8 billion. Next week, the US interest rate decision may cause fluctuations.
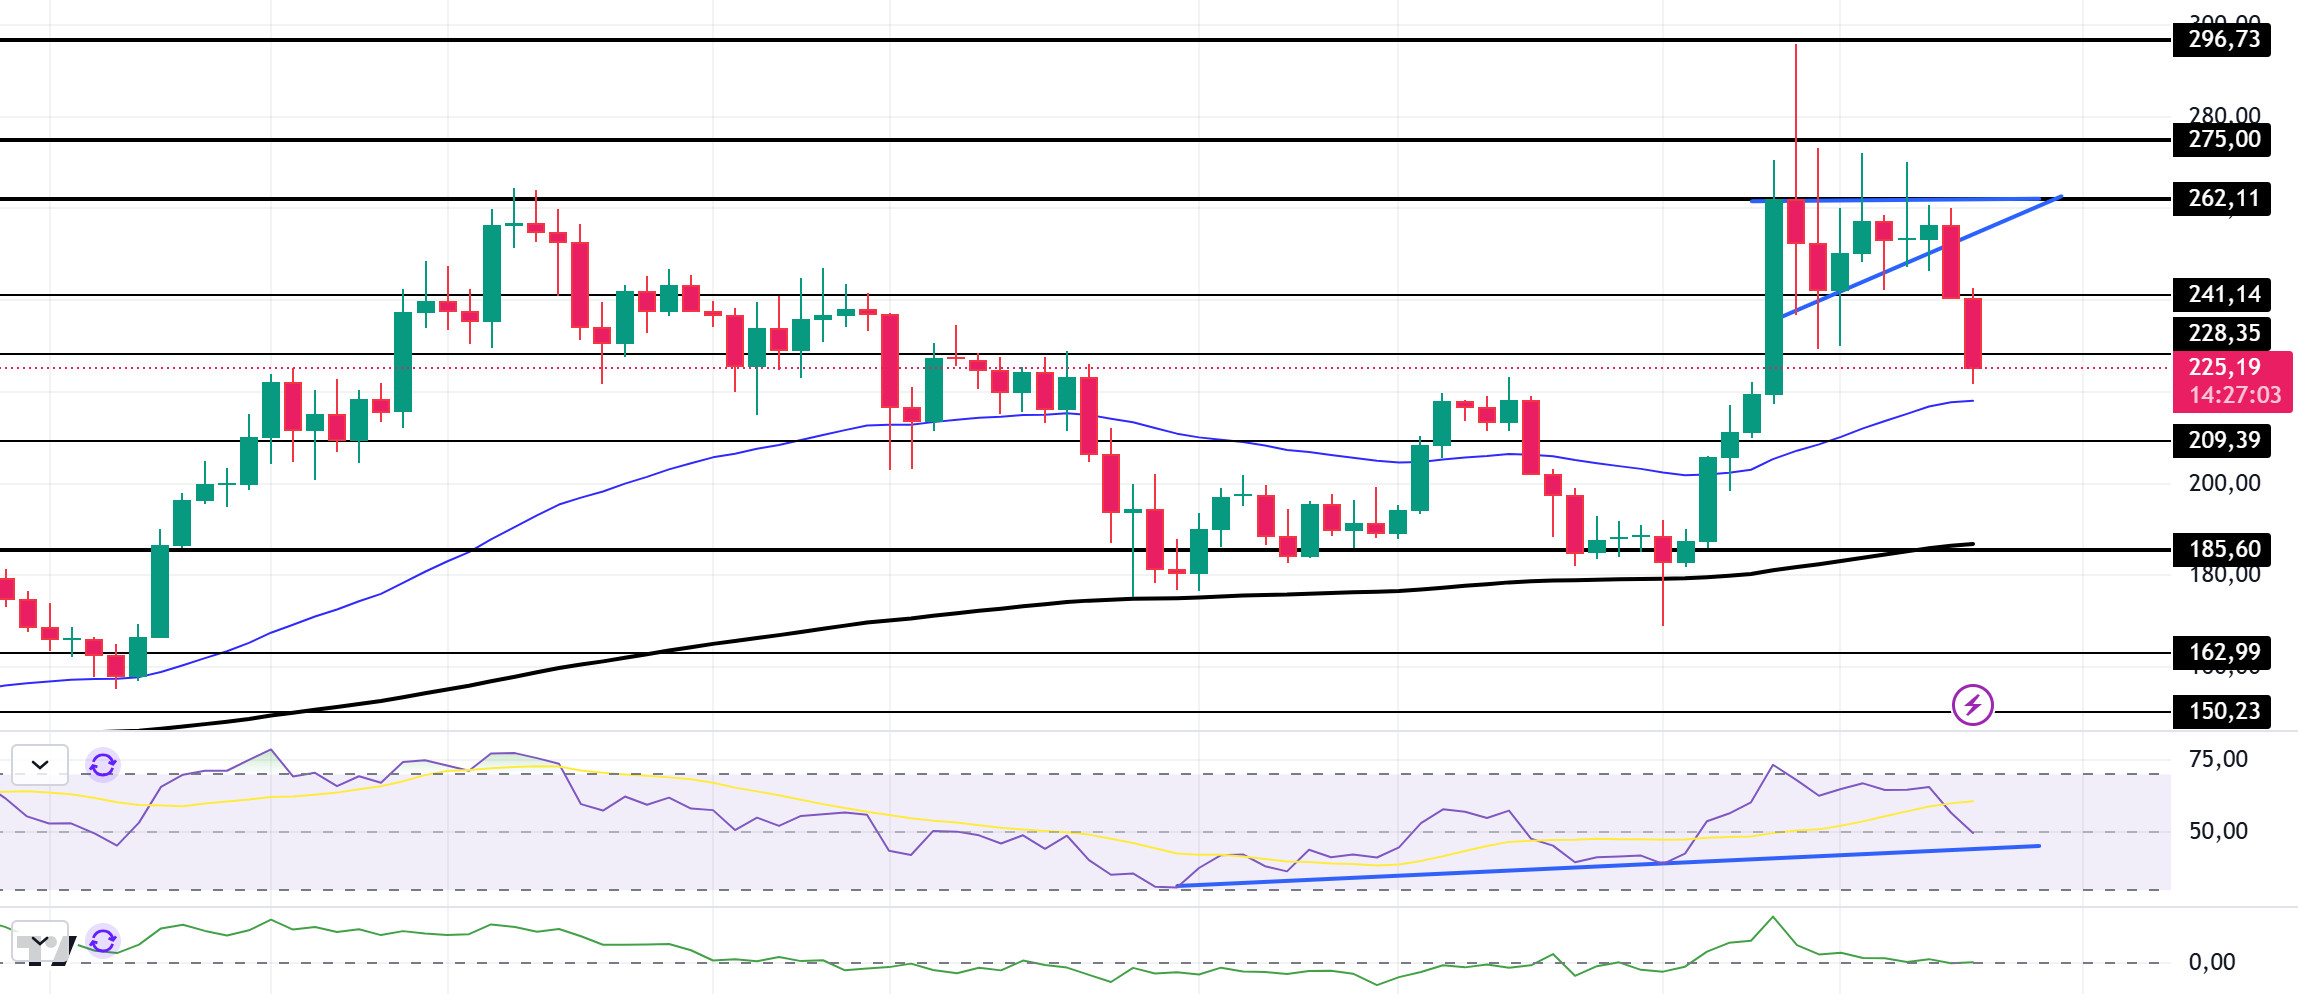
SOL, which has been fluctuating since the beginning of this week, moved horizontally at the beginning of the week. But today it experienced a pullback. The asset tested the ceiling of the ascending triangle pattern 3 times but failed to break it and started to decline. The price is above the 50 EMA (Blue Line) and the 200 EMA. This may mean that the uptrend will continue in the short term. The price is preparing to test the 50 EMA as a support. However, if it gains strong momentum from here, it may retest the strong resistance at 262.11. On our daily chart, the 50 EMA (Blue Line) continues to be above the 200 EMA (Black Line). This suggests that the trend is bullish in the medium term, but the difference between the two averages is about 16%, which could keep the price retracement going. The Relative Strength Index (RSI) moved in the 14 overbought zone during the week, but it is now in neutral territory due to the pullback . At the same time, the RSI (14) is moving towards the support level of the uptrend. However, Chaikin Money Flow (CMF)20 indicator is in neutral territory and money inflows and outflows are balanced. If the positive results in macroeconomic data and positive developments in the ecosystem continue, it may test the first major resistance level of 241.14. In case of negative macroeconomic data or negative news in the Solana ecosystem, the 185.60 level can be followed and a buying point can be determined
Supports 228.35 – 209.39 – 185.60
Resistances 241.14 – 262.11 – 275.00
DOGE/USDT
Dogecoin fell 5.55% in the last week. Trump’s pro-crypto stance and Musk’s role at the D.O.G.E. department could further boost the meme coin’s popularity and value in the near future. Vivek Ramaswamy said on X that he is leaving the Department of Government Efficiency and is “confident that Elon and his team will succeed in streamlining the government.” In addition, Elon Musk’s role in Trump’s administration has DOGE supporters even more excited. Elon Musk recently sparked controversy with his “DOGE to Mars” announcement. At the same time, Musk’s optimistic comment and the official website for the United States government’s Department of Government Efficiency (DOGE) prominently displayed the Dogecoin logo. But after Elon Musk’s DOGE agency removed the iconic meme images from its website, it plummeted. At the same time, Elon Musk-led ‘DOGE’ is facing a lawsuit following Trump’s inauguration. The 30-page legal complaint alleges that Musk’s DOGE violated the Federal Advisory Committee Act (FACA) of 1972. Asset manager Bitwise recently filed a registration application for a Dogecoin exchange-traded fund (ETF). In Onchainde, large investors continue to accumulate DOGE. The circulating supply has decreased, which could potentially have a positive impact on the price. DOGE’s forward open interest hit a record high of $5.25 billion. Next week, the US interest rate decision may cause fluctuations.
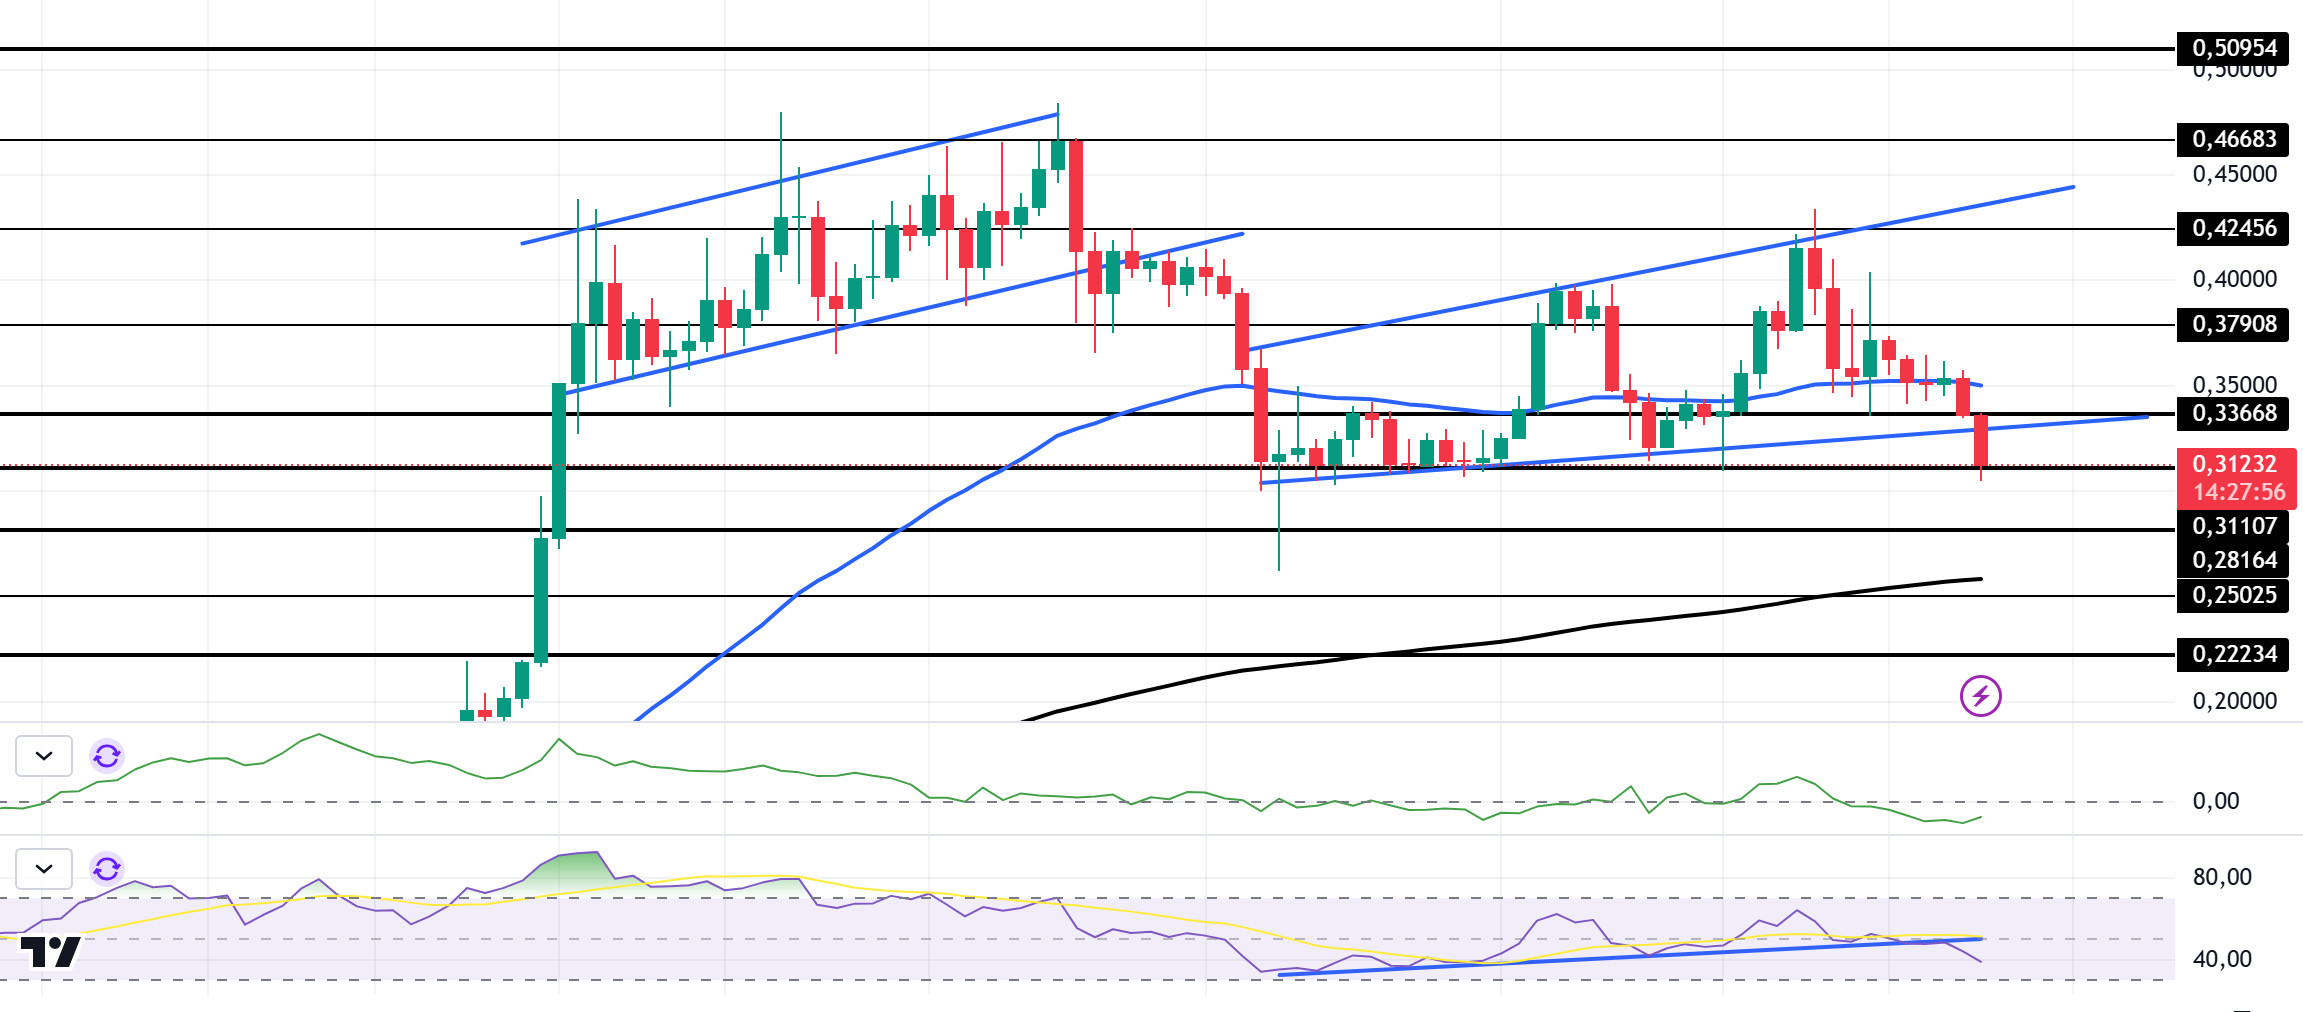
When we look at the daily chart, the asset, which has been stuck in a horizontal band since December 19, fell this week and broke the strong support level of 0.33668. The asset, which is currently retreating, broke the 50 EMA (Blue Line) and lost its bullish momentum. Although the 50 EMA (Blue Line) remains above the 200 EMA (Black Line), indicating that the asset remains bullish, the difference between the two averages is 35.47%, which may increase the probability of a further decline. If this bearish momentum continues, the asset could fall as low as 0.28164. When we look at the Chaikin Money Flow (CMF)20 indicator, it is in the middle of the negative zone. But money outflows have decreased. Relative Strength Index (RSI)14, on the other hand, found value in the negative zone. At the same time, the rising trend on the RSI chart broke down and broke the trend downwards. This may increase the pullbacks. In case of possible macroeconomic conditions and negative developments in the ecosystem and pullbacks, 0.31107 can be followed as a strong support. In case of continued rises, 0.42456 should be followed as a strong resistance.
Supports 0.31107 – 0.28164 – 0.25025
Resistances 0.33668 – 0.37908 – 0.42456
TRX/USDT
TRX, which started last week at 0.2285, closed the week at 0.2464, rising about 7.5% on the news that it was purchased by Trump-backed World Liberty Finance during the week. This week, conference board consumer confidence, FED interest rate decision, gross domestic product, unemployment claims data will be announced on the US side. In particular, the market will closely follow the FED interest rate decision and the speeches of FED Chairman Powell. Possible early rate cuts or an increase in the number of rate cuts during the year will be priced positively by the market.
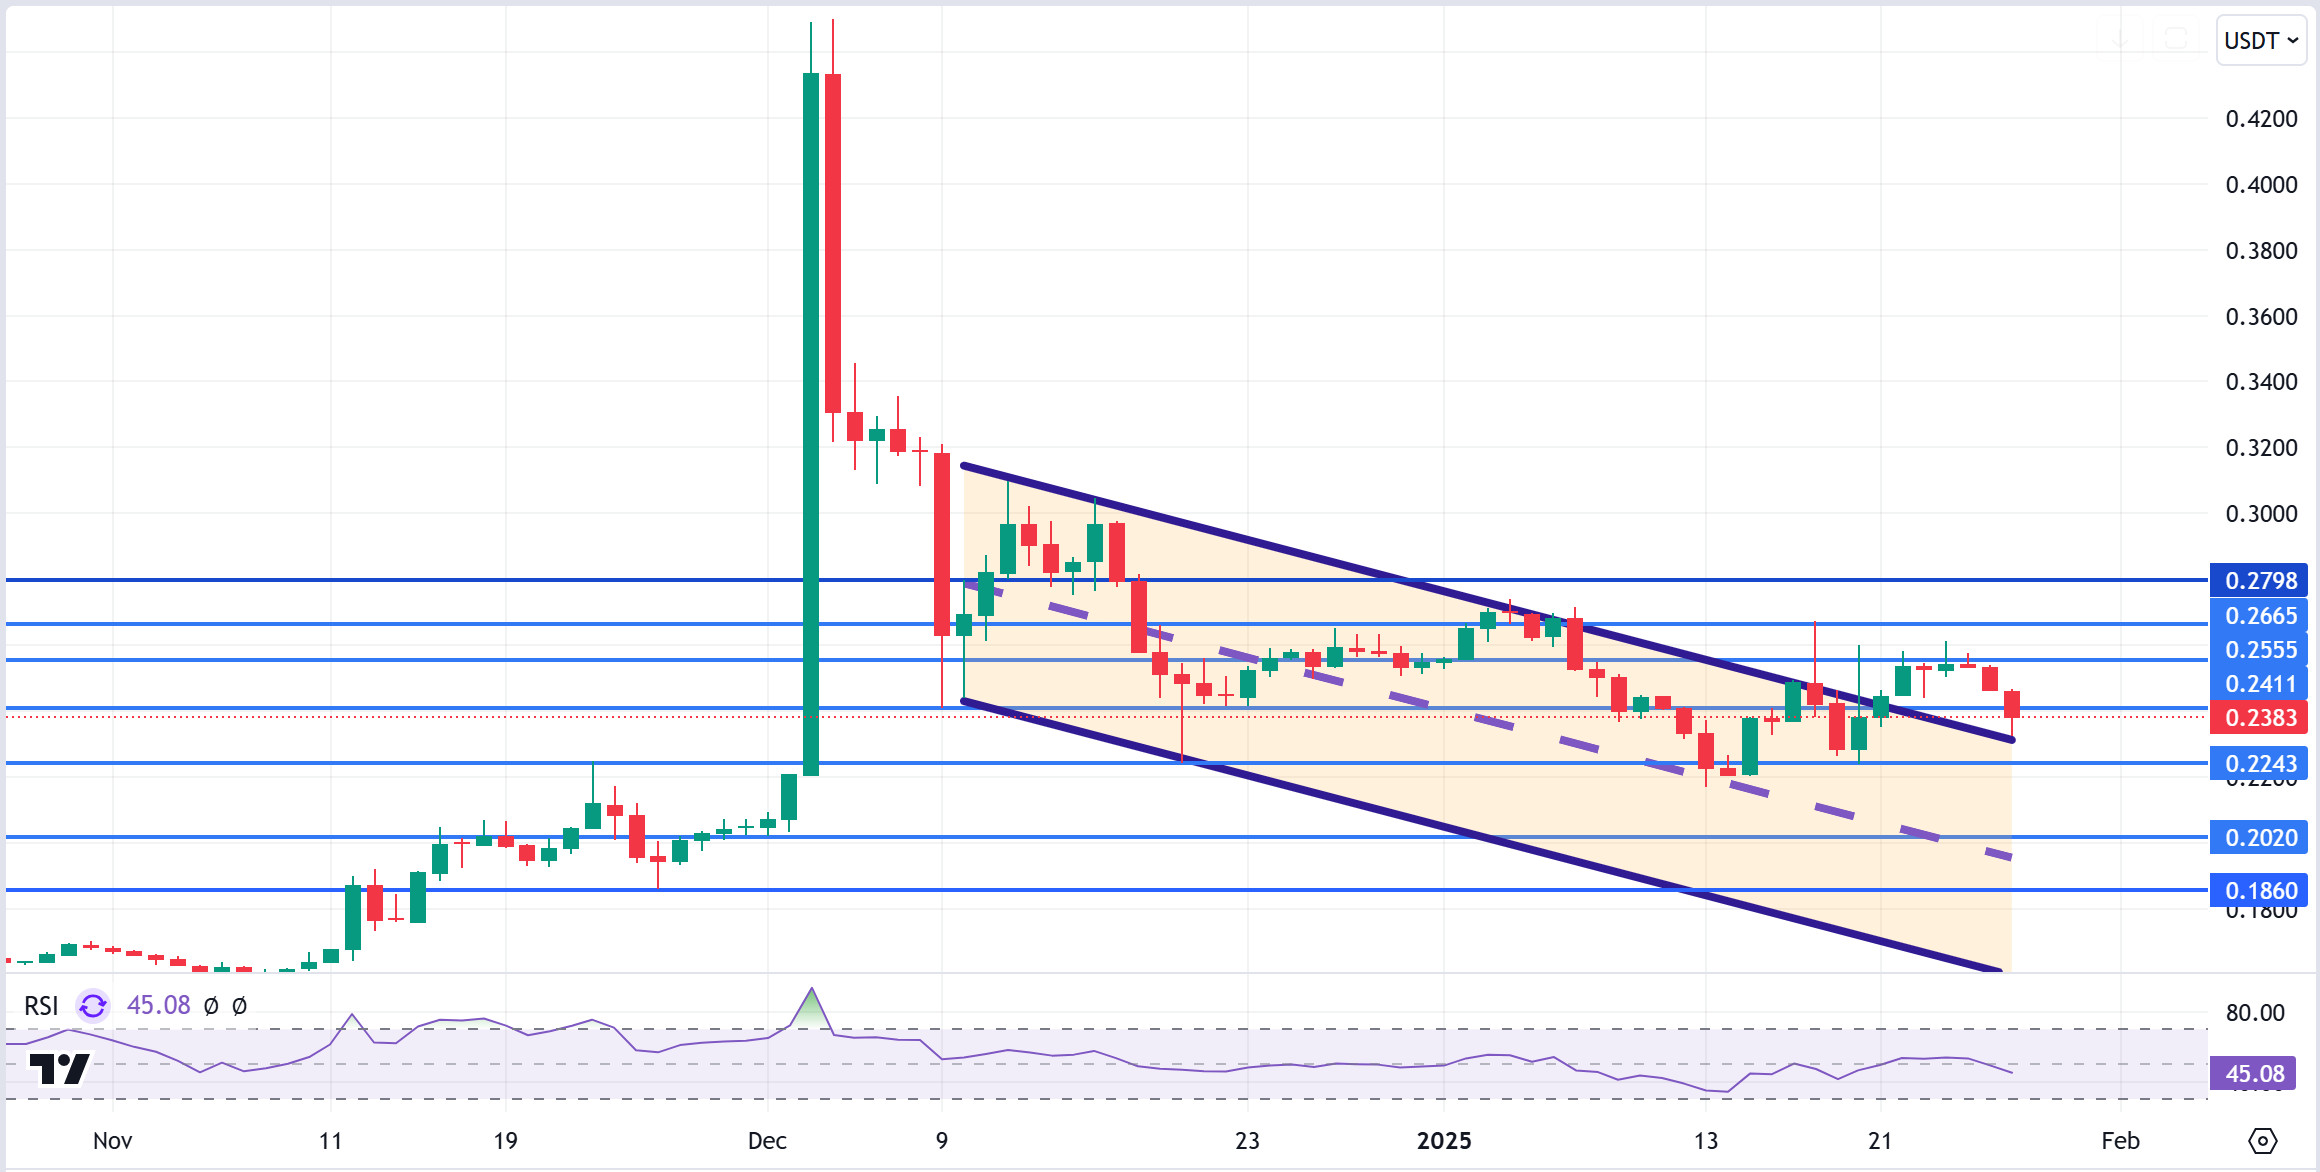
TRX, which is currently trading at 0.2383, seems to have broken the bearish channel upwards on the daily chart, but is moving back into the channel. With a Relative Strength Index value of 45, it can be expected to move towards the bearish channel mid-band by falling slightly from its current level. In such a case, it may test the 0.2243 support. If it cannot close daily under the support of 0.2243, it may increase with the buying reaction that may come and may want to break the channel upwards again. In such a case, may test 0.2555 resistance. As long as it stays above 0.1860 support on the daily chart, the bullish demand may continue. If this support is broken, selling pressure may increase.
Supports 0.2411 – 0.2243 – 0.2020
Resistances 0.2555 – 0.2665 – 0.2798
AVAX/USDT
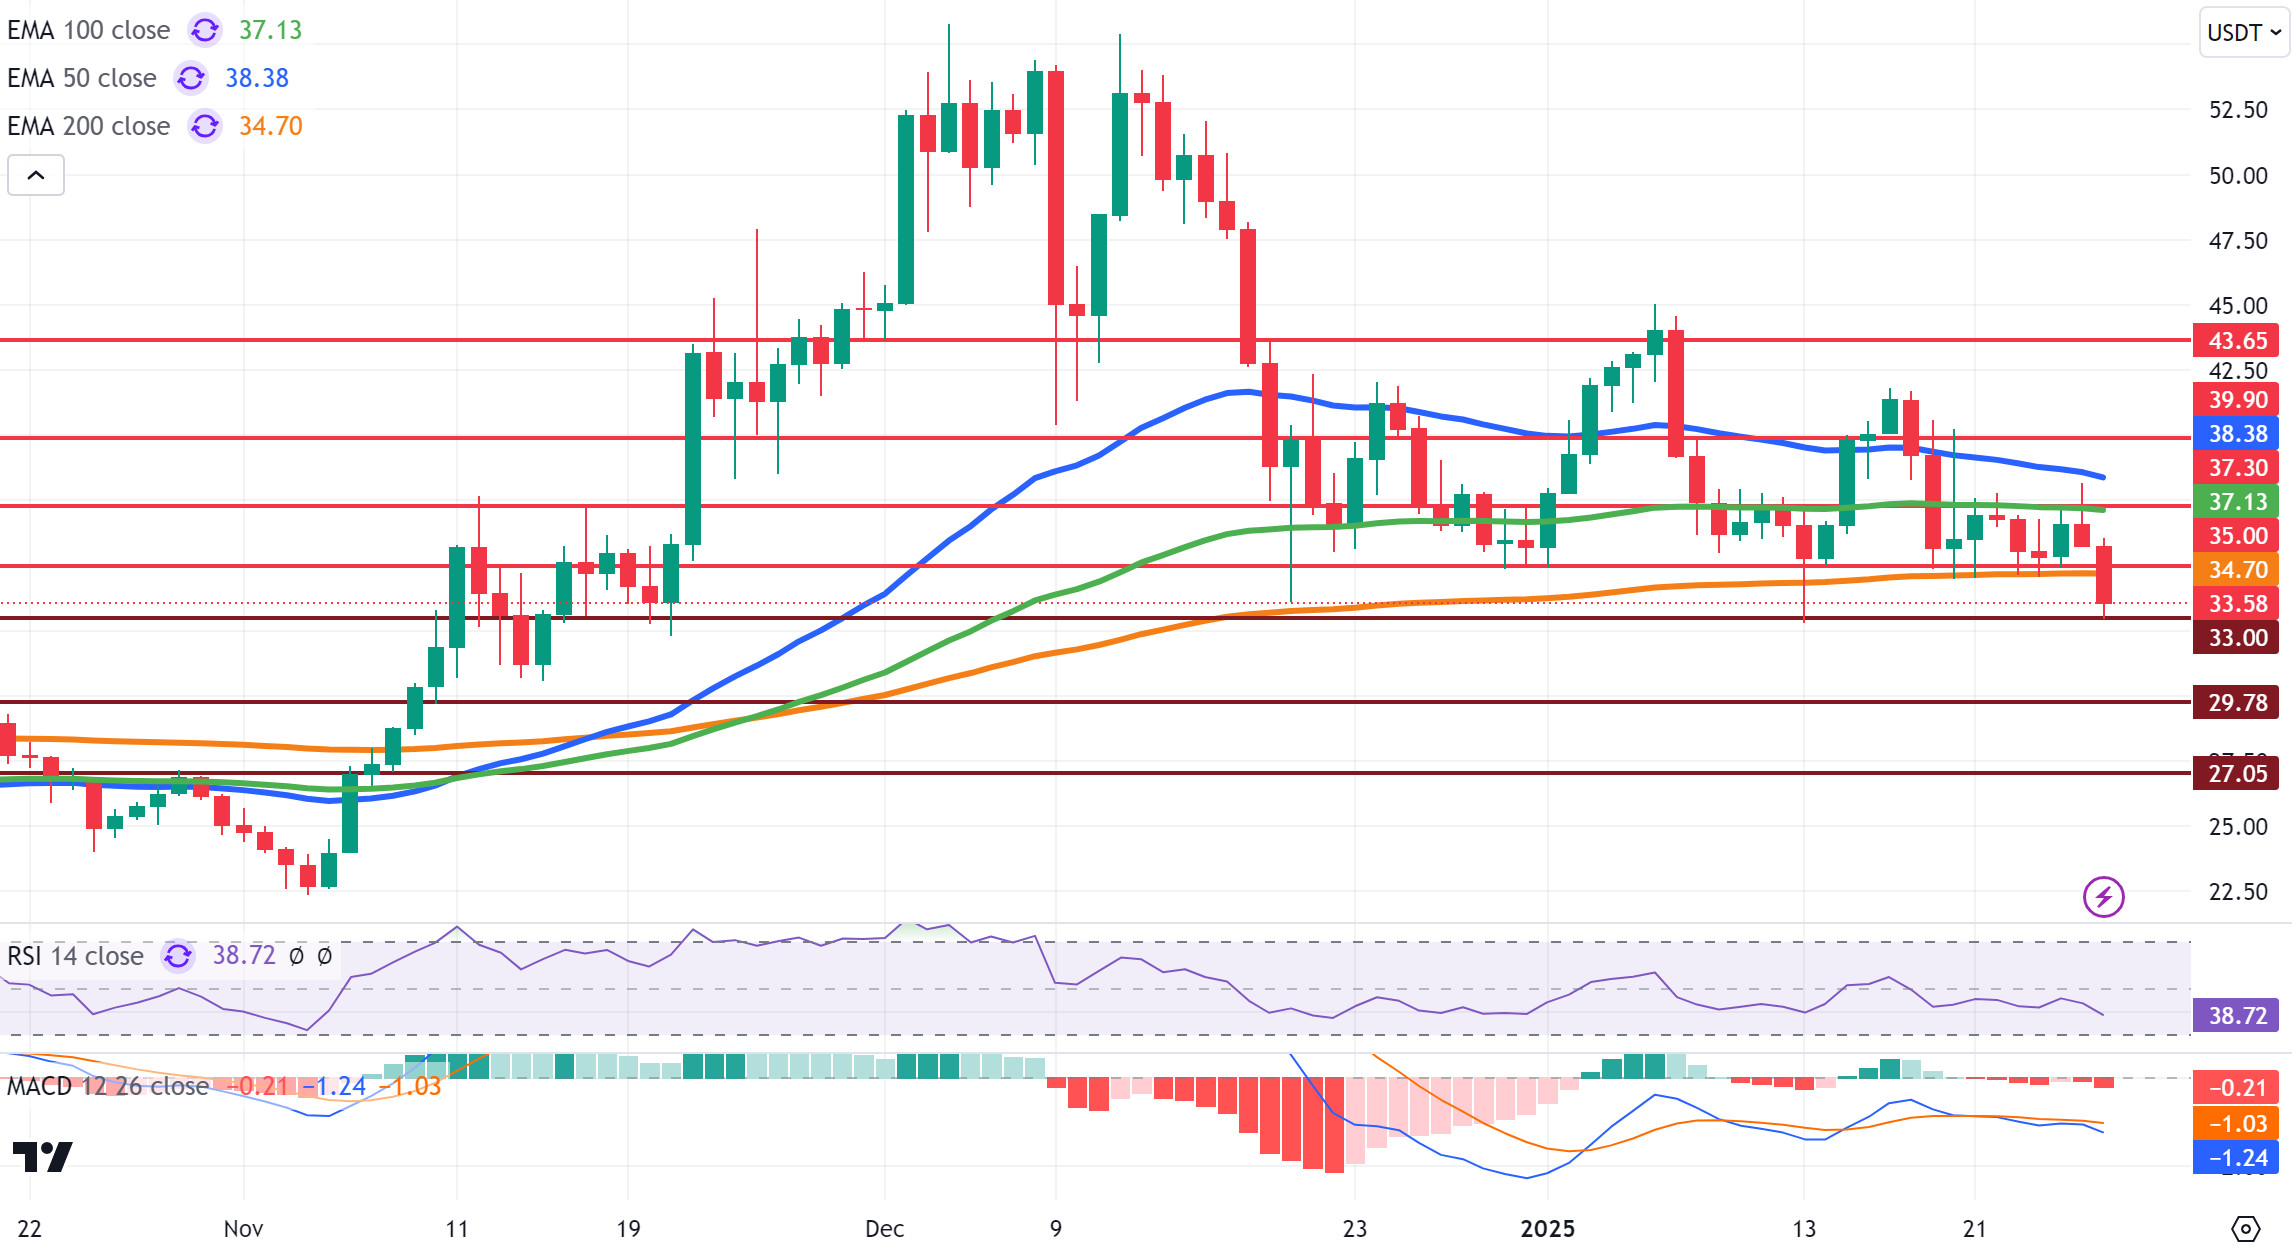
After rising as high as 40.50 on the opening day of last week, AVAX declined with the incoming sales and moved in a horizontal band between 34.50 and 37.50 levels throughout the week with low trading volume and closed at 35.72. AVAX, which started the new week with a decline, continues to be traded above the support level of 33.00, recovering with purchases after falling as low as 32.86.
The Moving Average Convergence/Divergence (MACD) indicator is moving below the signal line, indicating continued selling pressure. The Relative Strength Index (RSI) is at 38.72, indicating that it is approaching oversold territory. If the MACD indicator continues its downward movement and remains below the signal line in the negative zone and the RSI falls towards the 30 level, the selling pressure on AVAX may increase. In this case, AVAX may retest the 33.00 support level with its decline. If this support level is broken, it may fall to 29.78 and 27.05 support levels, respectively.
On the contrary, a rebound of the MACD indicator into positive territory and an upward crossing of the signal line, as well as a rise of the RSI above the 40 level, could provide AVAX with upside momentum. In this case, AVAX may test the 35.00 resistance level and the 200-period Exponential Moving Average (EMA200) level. An upside break of these levels could trigger a move above the EMA50 level towards the 39.90 resistance level as the uptrend gains momentum.
(EMA50: Blue Line, EMA100: Green Line, EMA200: Orange Line)
Supports 33.00 – 29.78 – 27.05
Resistances 35.00 – 37.30 – 39.90
SHIB/USDT
Astra Nova and Shiba Inu are set to launch major innovations in gaming, NFT, and token economy through a collaboration on Shibarium. Projects to be unveiled in February 2025 include an AI-based RPG survival mode and Nova Toon webcomic dApps that can be minted as NFTs. As part of the collaboration, a SHIB incineration mechanism will be launched and a portion of the RVV token proceeds will be dedicated to removing SHIB from circulation. In addition, the Shiba Inu community will be able to take advantage of RVV token pre-sales and SHIB and RVV staking opportunities. These steps have the potential to increase the value of SHIB in the long term by reducing the circulating supply while expanding Shiba Inu’s ecosystem.
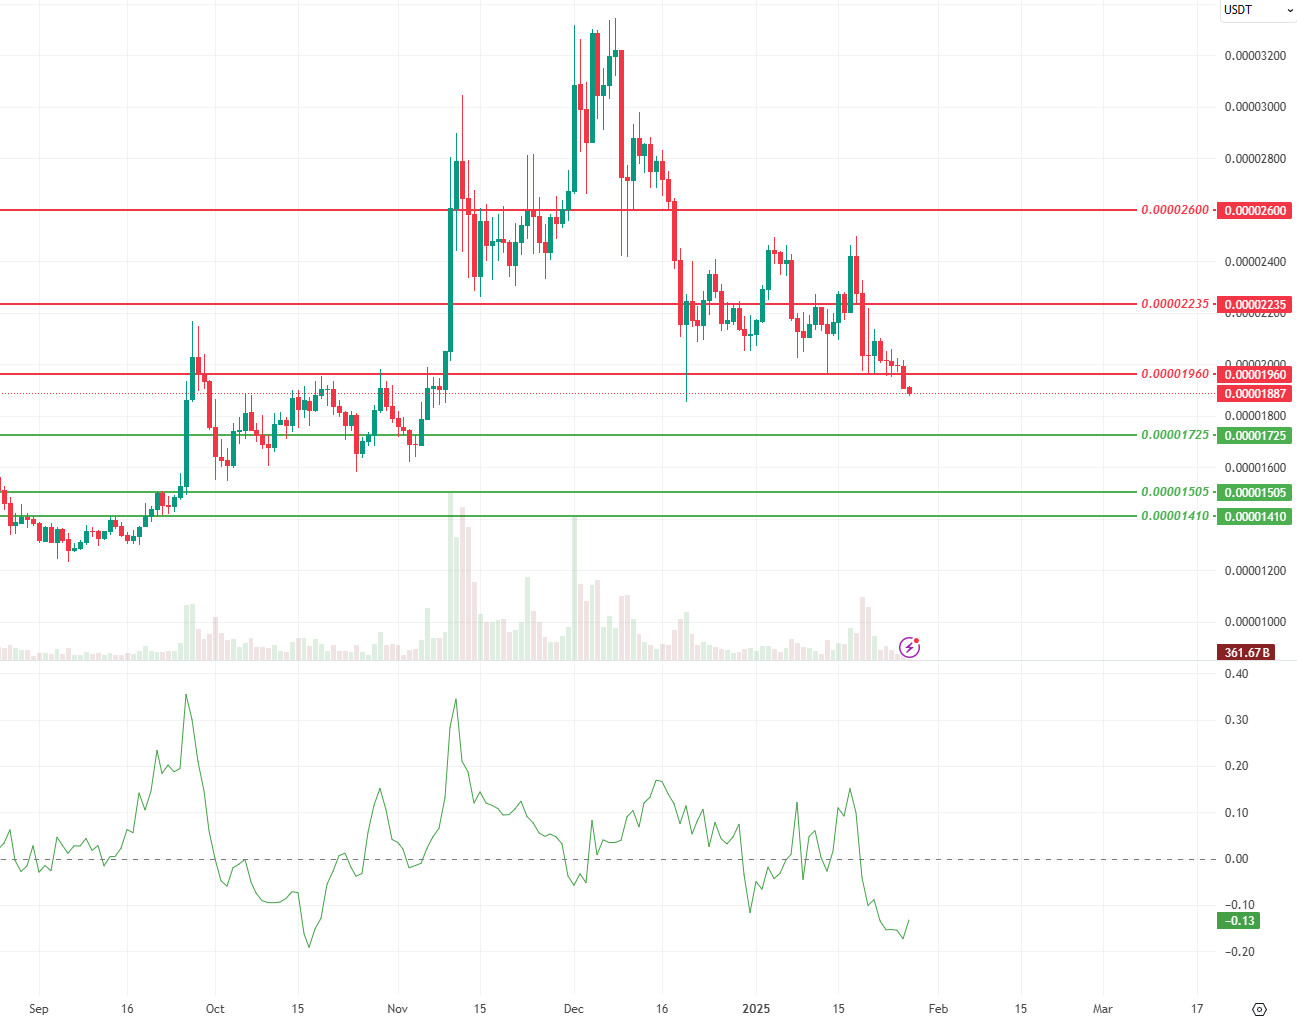
From a technical perspective, Shiba Inu (SHIB) continues to search for new support after losing its support at 0.00002055. The decline in trading volume continued this week as it did last week, while momentum continued to weaken. According to the Chaikin Money Flow (CMF) oscillator, it can be said that the seller side is more dominant in the market. If this situation continues, there is a possibility that the price may retreat to 0.00001725 levels. However, if the selling pressure decreases, the 0.00001960 level can be followed as the first resistance in upward movements.
Supports 0.00001725 – 0.00001505 – 0.00001410
Resistances 0.00001960 – 0.00002235 – 0.00002600
LTC/USDT
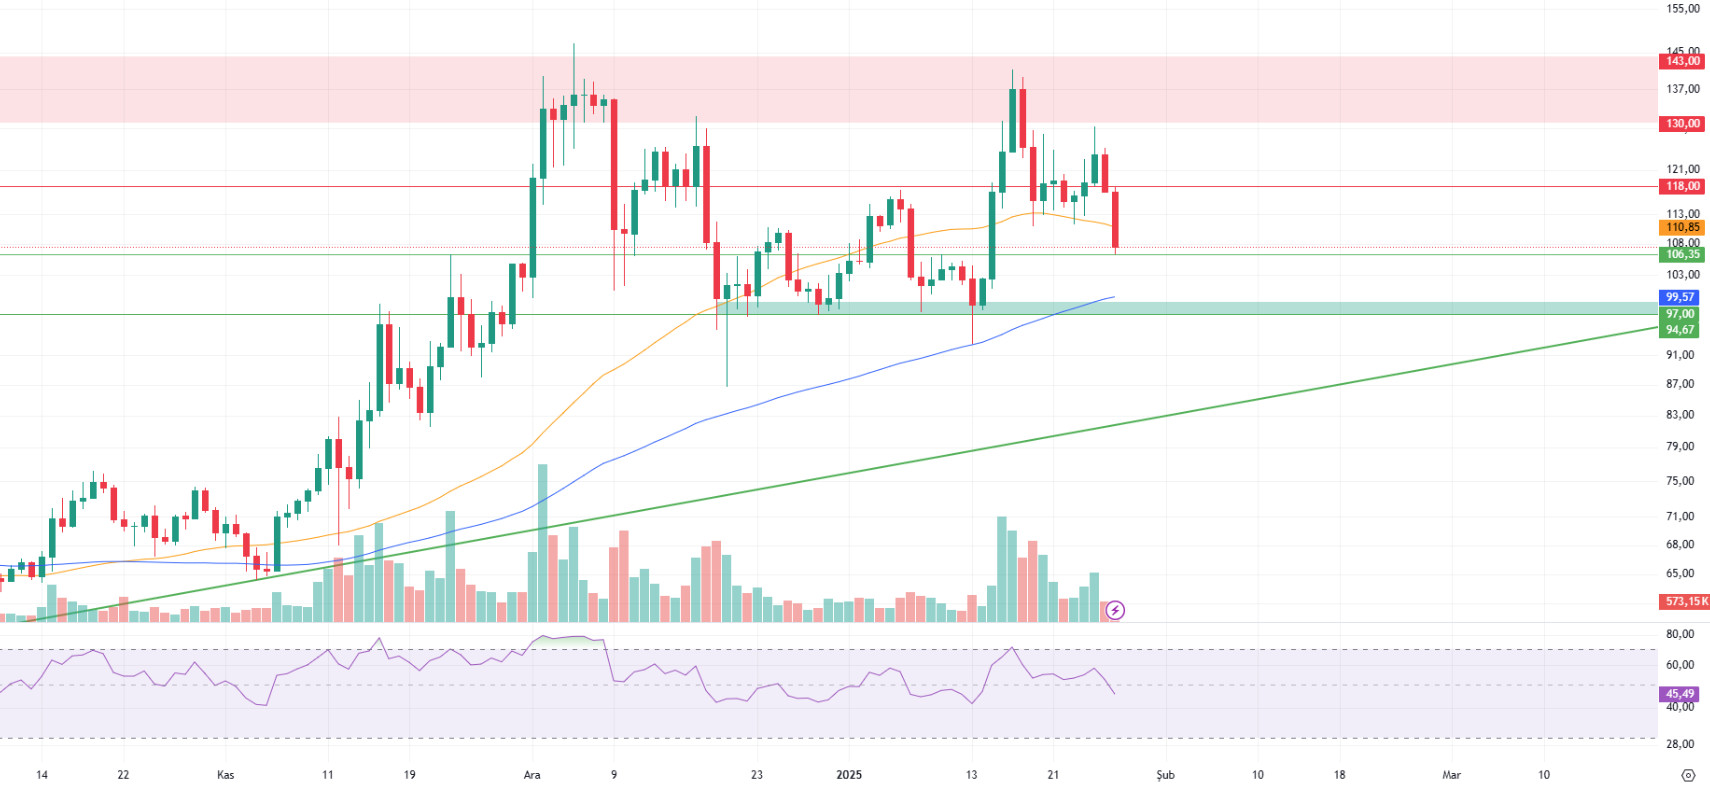
Litecoin, which gained 1.33% last week, started the new week at 117.07. According to Arkham data, at the beginning of last week, there was a total position of 333 million dollars in futures trading on LTC, while this week it decreased to 292 million dollars. Funding rates continue to be positive on all exchanges. In the market capitalization rankings, LTC moved up one place from 21st to 20th.
LTC’s daily chart shows that the price is below the 50-day moving average (orange line) and above the 100-day moving average (blue line). In the first upward movement, the first level where selling pressure may occur stands out as the red horizontal resistance at 118.00. If this resistance is overcome, the price can be expected to move up to the 130.00 – 143.00 band. However, these levels stand out as areas where selling pressure may re-intensify. In a bearish scenario, the first support point will be the horizontal support at 106.35. If the decline continues, the 99.00 – 97.00 range (green zone), which was previously supported, stands out as a zone where buyers can intensify. This makes the 97.00 level an important support point that could be the last stop of the decline. If this important support is also broken, a retracement to the main trend support, which is currently at 81.90, may occur.
Resistances 118.00 – 130.00 – 143.00
Supports 106.35 -97.00- 81.
LINK/USDT
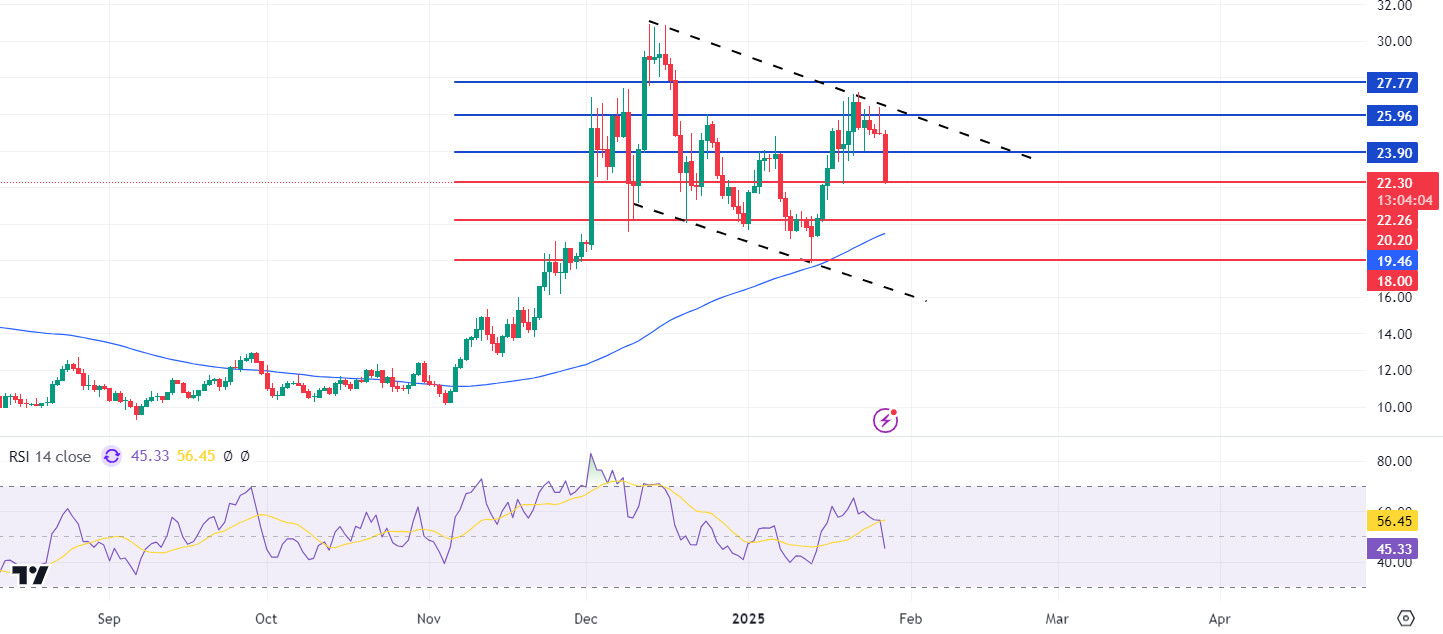
After reaching a peak of $27.21 on January 22, LINK has experienced an increase of nearly 50% compared to its previous low. This rise was triggered by the announcement of the RLUSD partnership with XRP and the fact that it is in the category of American-origin coins. However, it was affected by the market pullback on Sunday night, falling a total of 18%.
From a technical point of view, LINK’s effort to hold on to the $22.30 support level is noteworthy. However, the Relative Strength Index (RSI) indicator’s transition into negative territory may increase selling pressure, causing the price to fall as low as $ 22.26, which coincides with the Moving Average Ribbon (SMA100) level. On the other hand, the $23.90 resistance level plays a critical role in upward movements. Daily closes above this level could strengthen momentum and facilitate a breakout of the falling channel, signaling a new uptrend. However, in the current situation, the RSI is in negative territory and the price is looking for direction, indicating that the risk level is high.
(SMA100: Blue Line)
Supports 22.26 – 20.20 – 18.00
Resistances 23.90 – 25.96 – 27.77
BNB/USDT
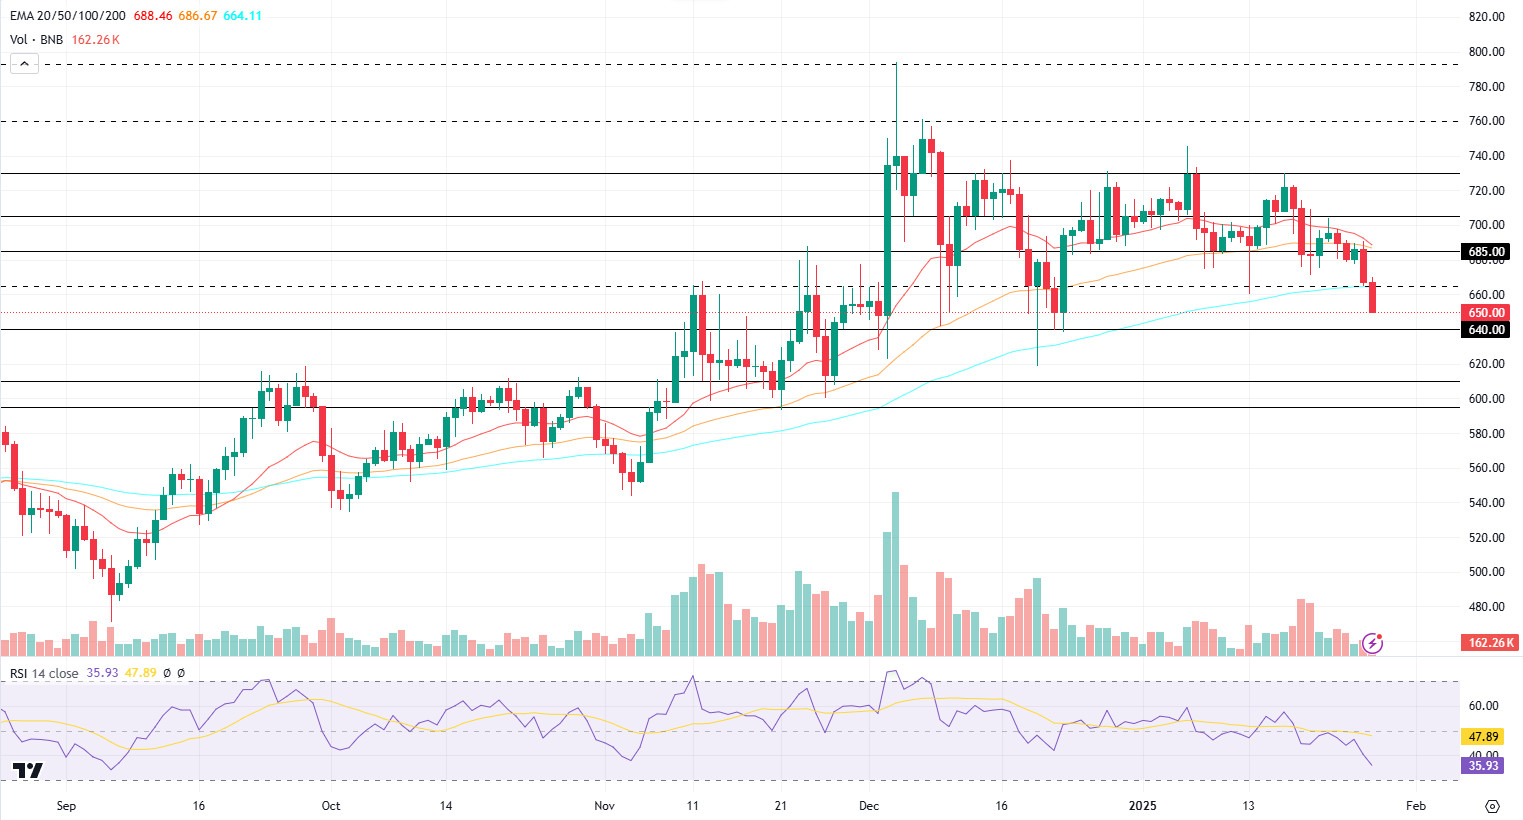
At the beginning of last week, on Monday, January 20, markets were volatile due to the inauguration and swearing-in speech of Donald Trump, the 47th President of the United States. BNB/USDT, which rallied with positive momentum in the next two days of the week, moved towards the 700 level. However, the asset, which remained under pressure at these levels, gained a negative momentum and strengthened its negative outlook by falling below the EMA 20 (red line) and EMA 50 (orange line) levels in the remaining days of the week. With the start of the new week, BNB/USDT, which continues to trade below the EMA 100 (blue line) and 665 level, continues to be under selling pressure.
The volume indicator reveals that the negative candles combined with low trading volume in recent days have increased selling pressure. In this context, strong and positive trading volume should increase in order for the price to regain a positive momentum. On the other hand, the RSI indicator moved in line with the price movements and fell below the 50 level and remained in this zone. The fact that the RSI remains below these levels may indicate that short-term selling pressure may continue.
In this context, if the negative momentum experienced at the beginning of the new week continues, the price is expected to retreat towards the 640 level first. If the 640 level is broken downwards, there is a possibility of a pullback to 610 and 595 levels, respectively. However, a support that may be encountered at the 640 level may contribute to the price rising towards the 665 level again. If the 665 level is broken upwards, the 685 and 705 levels will be followed as new resistance zones.
Supports 640- 610- 595
Resistances 665- 685- 705
ADA/USDT
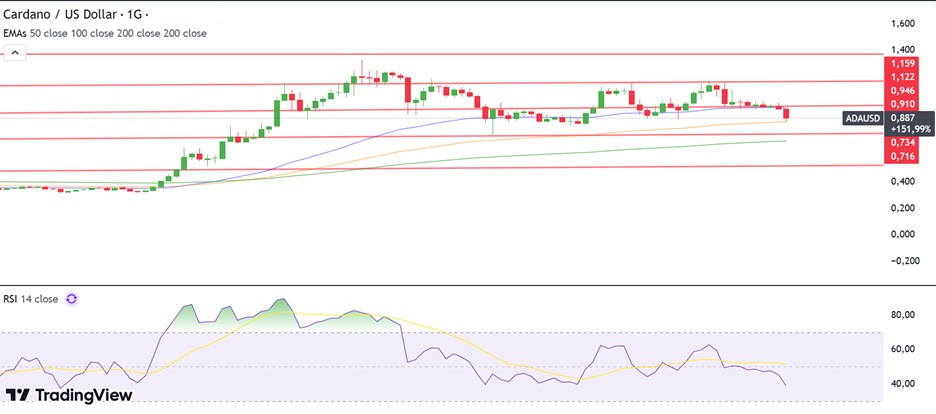
Cardano, the ninth-largest cryptocurrency, plummeted 13% in the last 24 hours after falling last night, bringing its price below 0.. The decline in altcoins accelerated after Trump’s comments about the crypto market yesterday. This selling pressure indicates that the downtrend will potentially continue
ADA, which opened at 0.964 last week, rose as high as 1.110 and closed the week at 0.928. Starting the new week lower, the Relative Strength Index (RSI 14) is showing a low momentum at 37. The overall picture shows that with this deep decline, market momentum has been severely weakened and critical resistance levels have been breached.
If ADA tests the 100-period Exponential Moving Average (EMA100) level and breaks it downwards, $0.855 and $0.722 levels can be targeted. If ADA breaks the resistance level of 1.025 and rises with possible purchases, resistance levels of 1.086 and 1.134 can be followed
(EMA50: Blue Line, EMA100: Orange Line, EMA200: Green Line) Supports 0.722 – 0.855 – 0.928
Resistances 1.025 – 1.086 – 1.134
LEGAL NOTICE
The investment information, comments and recommendations contained in this document do not constitute investment advisory services. Investment advisory services are provided by authorized institutions on a personal basis, taking into account the risk and return preferences of individuals. The comments and recommendations contained in this document are of a general type. These recommendations may not be suitable for your financial situation and risk and return preferences. Therefore, making an investment decision based solely on the information contained in this document may not result in results that are in line with your expectations.

