MARKET SUMMARY
Latest Situation in Crypto Asset
| Assets | Last Price | 24h Change | Dominance | Market Cap. |
|---|---|---|---|---|
| BTC | 102,772.32 | 0.05% | 58.33% | 2.04 T |
| ETH | 3,143.60 | -1.63% | 10.85% | 378.85 B |
| XRP | 3.112 | 0.45% | 5.14% | 179.44 B |
| SOLANA | 233.32 | -2.57% | 3.25% | 113.63 B |
| DOGE | 0.3318 | -0.62% | 1.41% | 49.10 B |
| CARDANO | 0.9428 | -1.06% | 1.95% | 33.21B |
| TRX | 0.2426 | -1.83% | 1.60% | 20.90B |
| LINK | 23.39 | -3.45% | 0.43% | 14.94 B |
| AVAX | 33.44 | -1.89% | 0.39% | 13.78 B |
| SHIB | 0.00001849 | -3.47% | 0.31% | 10.90 B |
| DOT | 5.810 | -2.15% | 0.26% | 8.97 B |
*Prepared on 1.29.2025 at 07:00 (UTC)
WHAT’S LEFT BEHIND
Financial Times: OpenAI Claims to Use DeepSeek’s Model for Education
OpenAI claimed to have found some evidence that Chinese AI startup DeepSeek was using its proprietary model for training. The company stated that the model distillation technique was used, which helped to achieve similar results at low cost.
Trump Branded Websites Start Accepting TRUMP Token Payments
Websites such as GetTrumpWatches.com, GetTrumpFragrances.com and GetTrumpSneakers.com, which sell Trump-branded products, now accept payments in $TRUMP tokens, credit cards and Bitcoin.
Bitwise Files with SEC for Dogecoin Spot ETF
Bitwise has filed with the US Securities and Exchange Commission (SEC) to create an exchange-traded fund (ETF) that tracks the price of Dogecoin. The Bitwise Dogecoin ETF will hold DOGE and closely track its price movements.
Fed Spokesperson: Trump’s Tariff Policy Could Be a Barometer for Rate Cuts
Nick Timiraos said that how Trump’s plan to increase tariffs might affect inflation expectations could be a decisive factor for the Federal Reserve’s rate cut policy. The Fed’s rate decisions will depend on the course of inflation and the effects of tariff policies.
HIGHLIGHTS OF THE DAY
Important Economic Calender Data
| Time | News | Expectation | Previous |
|---|---|---|---|
| JUST: USDD Supply Mining IV Launch | – | – | |
| 19:00 | US FOMC Statement | – | – |
| 19:00 | US FED Interest Rate Decision | 4.50% | 4.50% |
| 19:30 | US FOMC Press Conference | – | – |
INFORMATION
*The calendar is based on UTC (Coordinated Universal Time) time zone.
The economic calendar content on the relevant page is obtained from reliable news and data providers. The news in the economic calendar content, the date and time of the announcement of the news, possible changes in the previous, expectations and announced figures are made by the data provider institutions. Darkex cannot be held responsible for possible changes that may arise from similar situations.
MARKET COMPASS
The rise of China’s DeepSeek and Trump’s steps on tariffs have been decisive for asset prices so far this week. Today, however, attention will be on the outcome of the Federal Open Market Committee’s (FOMC) meeting, which started yesterday and will conclude today. No change in interest rates is expected, but we can say that the speech of the Bank’s (FED) Chairman Powell will be very important. In addition, major companies such as Meta, Microsoft, Tesla and IBM are expected to announce their balance sheets today.
Following the movements in major digital assets on Sunday and Monday, we are watching price changes in a relatively narrower area. Expectations regarding the monetary policy decisions of the US Federal Reserve (FED) or statements regarding these decisions may disrupt this course. Until these announcements come, under the assumption that there will be no new information flow, the horizontal course in crypto assets may continue.
FED Expected to Pause Interest Rate Cuts
The first FOMC meeting of the year will be held on January 28-29. The Bank is expected to take a break from the rate cut cycle, which started strongly in September, after the latest employment and inflation data. There are even some who think that this break could be a long period of silence.
The statements and guidance following the 25-basis point rate cut in December indicated that Powell and his team wanted to watch the economic data for a while before deciding on a new rate cut. President-elect Trump’s policies, rising bond yields and the appreciating dollar may have had at least as much impact on FOMC members’ thinking as macro indicators. As a result, according to CME Fedwatch, the likelihood of another Fed rate cut in the first two meetings of the year seems very slim. For now, the prediction is that the officials will cut the policy rate from 4.50% to 4.25% at one of the FOMC meetings in May or June.
Markets do not expect a change in interest rates today, but clues on how many times the FED will cut rates by 25 basis points each this year and when the first rate cut will take place after the break will be important. At this FOMC meeting, officials’ expectations regarding interest rates and macro indicators will not be published. Therefore, we will have the monetary policy text and the statements of FED Chairman Powell, who will speak at the press conference afterwards. With these inputs, we will try to get information about the Bank’s interest rate cut course. Messages indicating a rate cut of more than 50 basis points during the year or a rate cut at the next meeting may create a supportive backdrop for rises in digital assets. In the opposite scenario, there would be no further rate cuts in the first half of the year, or a total of less than 50 basis points during the year. In this case, we may see pressure on the value of cryptocurrencies.
From the short term to the big picture.
Trump’s victory on November 5, one of the main pillars of our bullish expectation for the long-term outlook in digital assets, produced a result in line with our predictions. In the process that followed, the appointments made by the president-elect and the increasing regulatory expectations for the crypto ecosystem in the US and the emergence of BTC as a reserve continued to take place in our equation as positive variables. Then, 4 days after the new President took over the White House, he signed the “Cryptocurrency Working Unit” decree, which was among his election promises, and we think that the outputs it will produce in the coming days will continue to reflect positively on digital assets.
On the other hand, although it is expected to continue at a slower pace, the expectations that the FED will continue its interest rate cut cycle (for now) and the fact that the volume in ETFs based on crypto assets indicates an increase in institutional investor interest support our upward forecast for the big picture for now. In the short term, given the nature of the market and pricing behavior, we think it would not be surprising to see occasional pause or pullbacks in digital assets. However, at this point, it is worth emphasizing again that we think that the fundamental dynamics continue to support the rise.
TECHNICAL ANALYSIS
BTC/USD
The day of the critical FED interest rate meeting, which cryptocurrency markets have been eagerly awaiting, has arrived. Although no interest rate cut is expected at this meeting, the attitude of FED members towards interest rate cuts will be closely monitored in the coming period. FED spokesperson stated that Trump’s tariff policy could be an indicator for interest rate cuts.
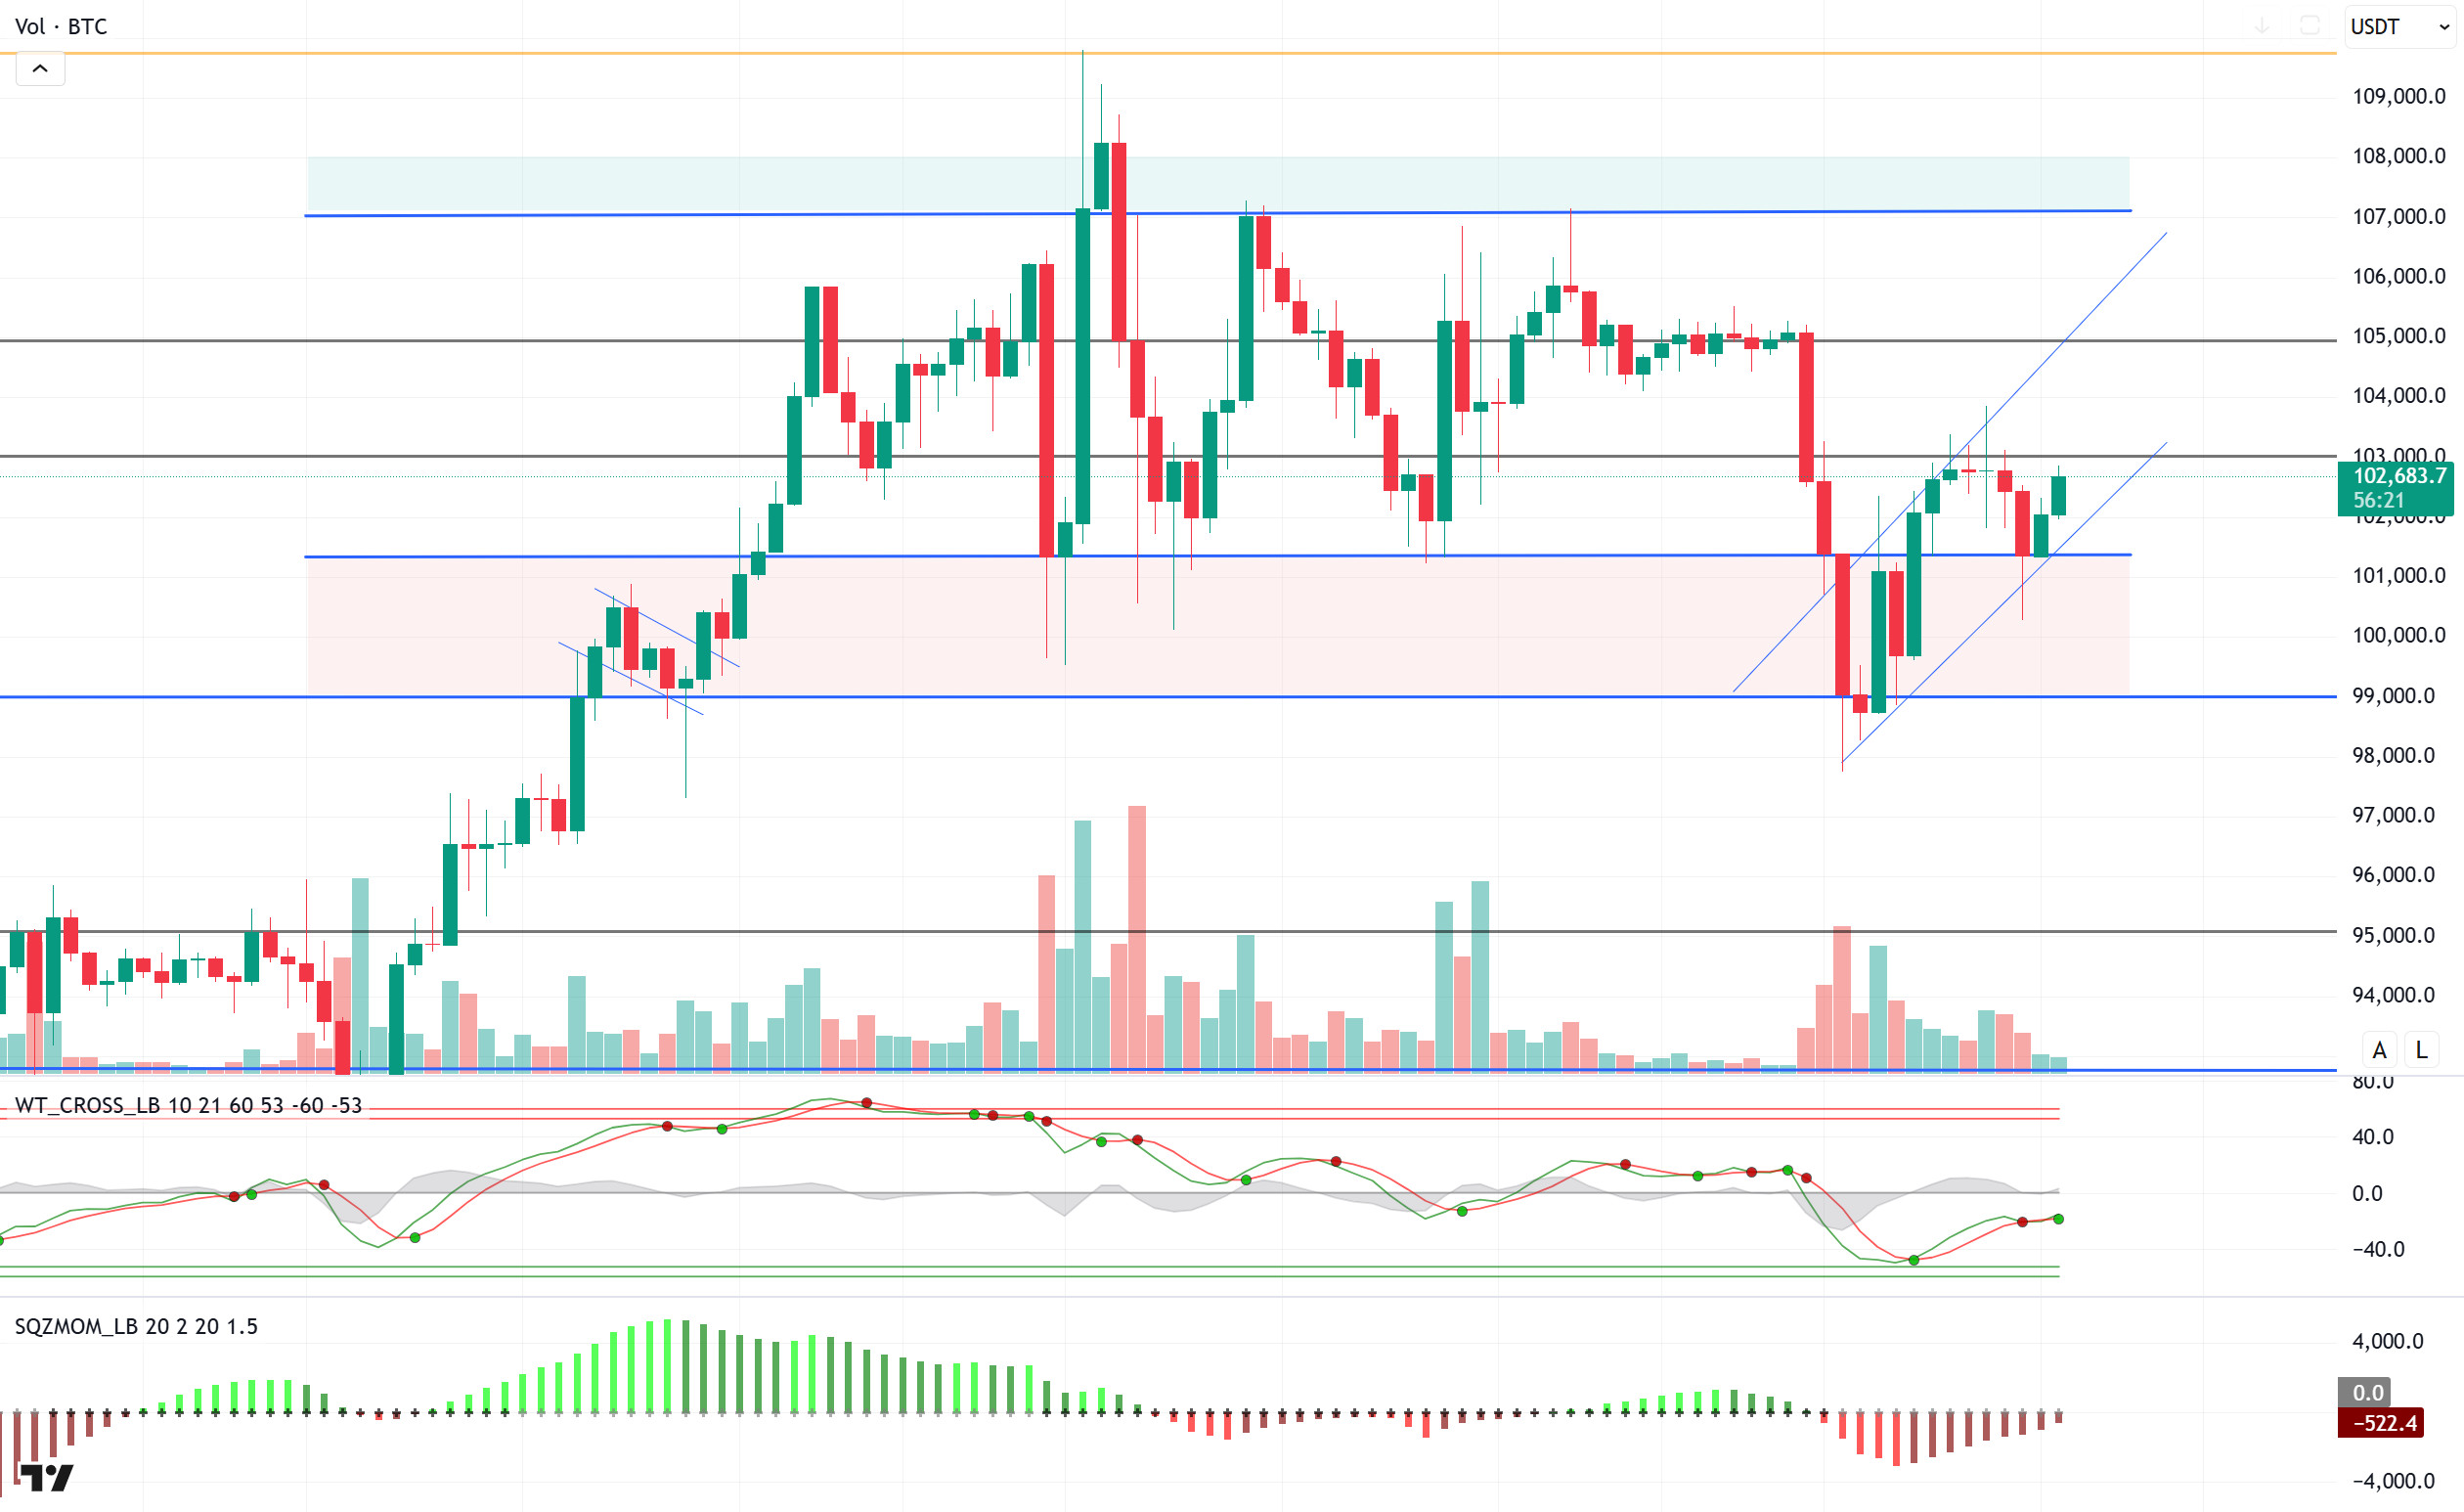
Looking at the technical outlook, BTC, which was in a downward trend with a sell signal yesterday, found support at 101,400 and turned its direction upwards again. In BTC, which is currently trading at 102,700 within the rising trend channel, technical oscillators have started to give a buy signal again, while the momentum indicator is about to move into the positive zone. In the continuation of the rise, hourly closes above the 103,000-resistance level, which it has tested several times before, will be followed, and in case of its break, we will follow the 105,000 point as the next resistance level. In a possible new wave of sales, 101,400 appears as a reference zone again in order to stay in the positive zone.
When we look at the liquidation heat map, short trades above the 105,000 level attract attention, while long trades between 96,000 and 98,000 attract attention. On the spot ETF side, the seven-day positive entry series ended with the first day of the week, and it is observed that it turned positive again yesterday.
Supports: 101,400 – 99,100 – 98,000
Resistances 103,000 – 105,000 – 107,000
ETH/USDT
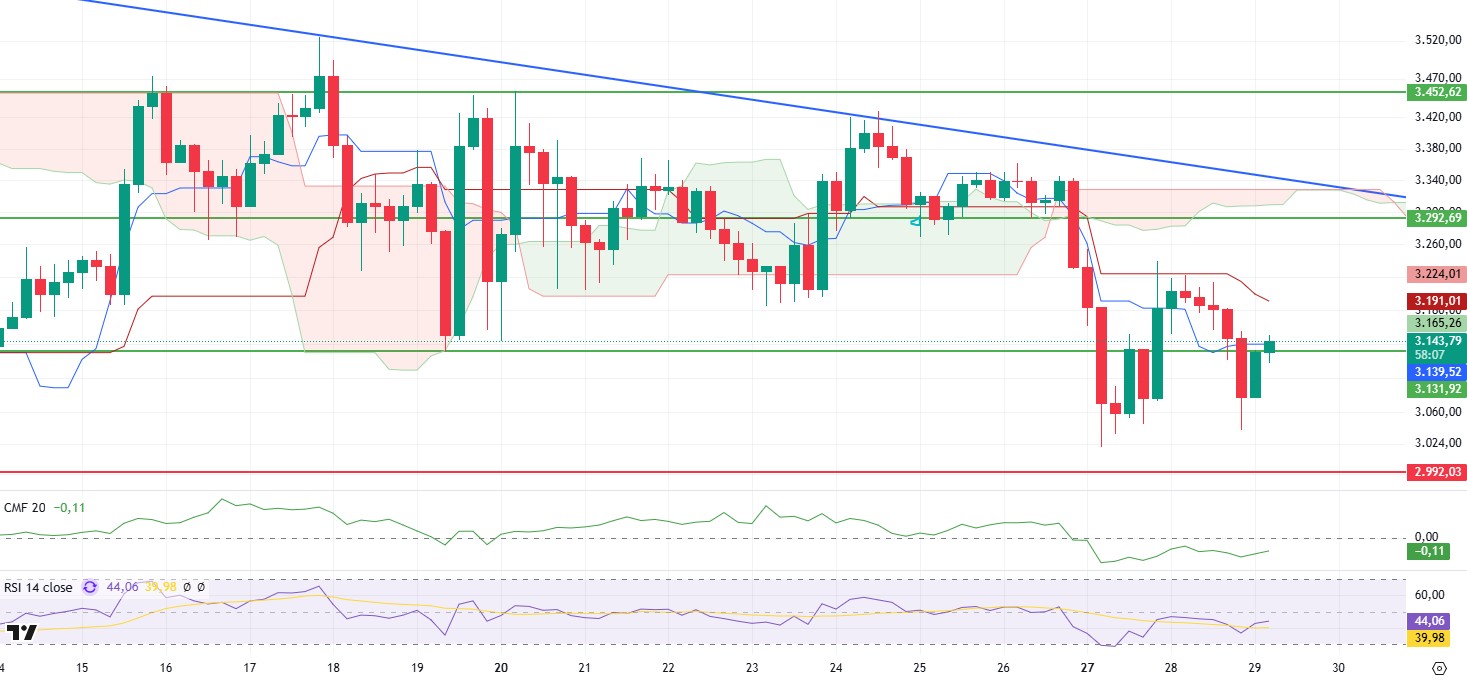
ETH quickly retreated to 3,040 levels after losing 3,131 support with yesterday’s sharp decline. However, with the strong reaction it received from this region, it gained an upward momentum in the morning hours and managed to surpass the 3,131 level. As a result of this price action, a double bottom formation has formed, while important technical structures have taken shape for ETH.
Futures futures fell yesterday as short positions were closed. The decline in Open Interest (OI) confirms this move in the market. An analysis of the Cumulative Volume Delta (CVD) shows that the bullish move found support from both futures and spot markets. This suggests that buyers are actively engaged and supporting the uptrend. Although Chaikin Money Flow (CMF) has recovered, indicating that buyers have regained dominance, it is still in the negative zone, indicating that there is not enough liquidity in the market. Relative Strength Index (RSI), on the other hand, accelerated upwards, indicating that momentum has turned positive again. This suggests that the buying appetite is increasing and the price may continue to rise.
ETH has the potential to resume its bullish trend in the short term by regaining the tenkan level and the 3,131 area. If the price is able to hold this area, the upward movement can be expected to continue, and the double bottom pattern can be activated. However, if the 3,131 level is breached, the momentum is likely to weaken, and the price may retrace back towards the 3,000 levels. Therefore, the 3,131 level is a critical threshold for ETH in terms of short-term direction. If this zone is maintained, the rise is expected to continue, while it should be kept in mind that selling pressure may increase in case of a downward break.
Supports 3,131 – 2,992 – 2,890
Resistances 3,292 – 3,350 – 3,452
XRP/USDT
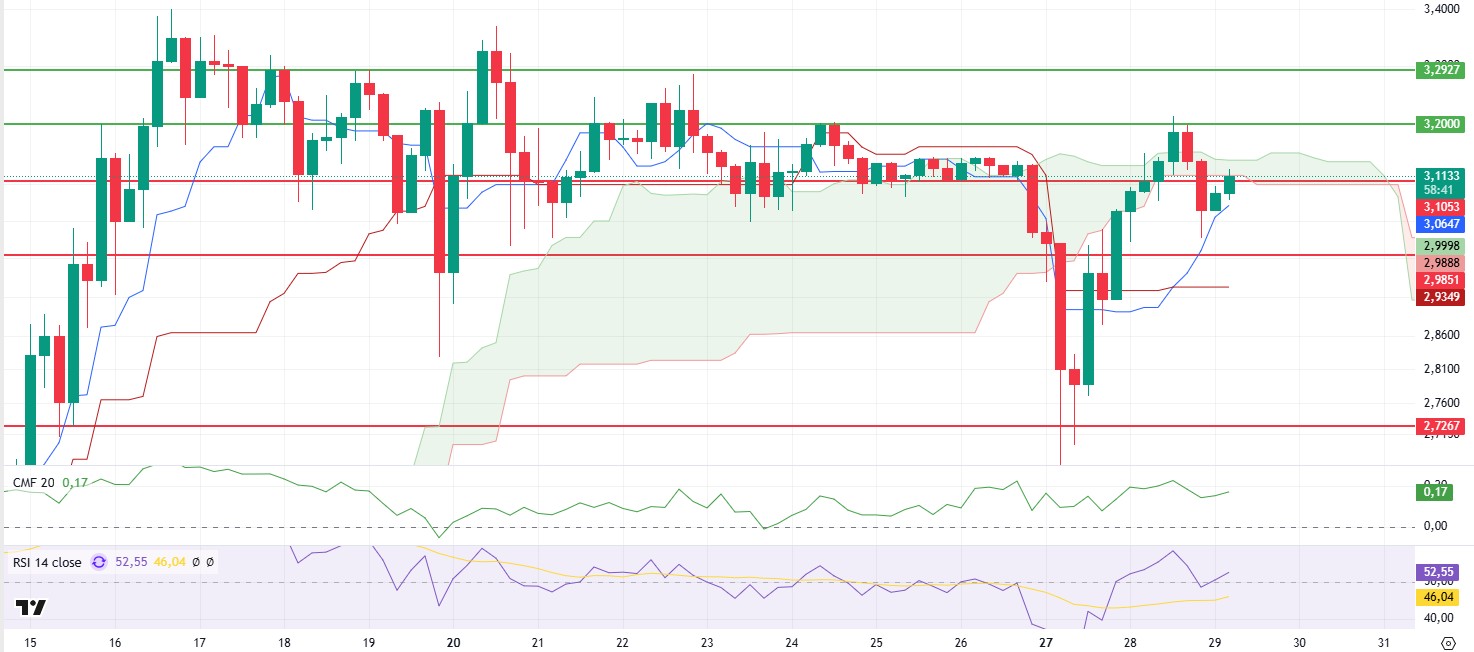
XRP retreated to the 3.00 level region after losing the support of the sand cloud yesterday evening. Although it rises to 3.10 again with the support it receives from this region, it has difficulty exceeding the limits of the kumo cloud.
Chaikin Money Flow (CMF), which experienced a slight pullback with this price action, turned up again, showing that buyers remained strong. Relative Strength Index (RSI) and momentum are also trending upwards, supporting the price’s upward movements. In the Ichimoku indicator, it can be said that the “buy” signal formed by the tenkan level cutting the kijun level upwards can move the price upwards with the exceeding of the kumo cloud.
In summary, with the exceeding of the 3.14 level, the rise to 3.20 levels may come rapidly. Exceeding this level may continue the movement towards higher resistance areas. However, closures below the 3.10 level may weaken the trend and cause pullbacks.
Supports 3.1053 – 2.9851 – 2.7267
Resistances 3.2000 – 3.2927- 3.3854
SOL/USDT
Cboe has re-filed for four Solana ETFs under the SEC’s 19b-4. Tuttle Capital proposed 10 crypto ETFs, including a leveraged Solana product. Sol Global announced a strategic investment with Mcqueen Labs Inc. for real-world asset tokenization on the Solana blockchain. In addition, Solana captured 50% of the decentralized exchange (DEX) market share thanks to its retail trading activity and low transaction costs. On the other hand, the news coming from the FOMC today may cause fluctuations.
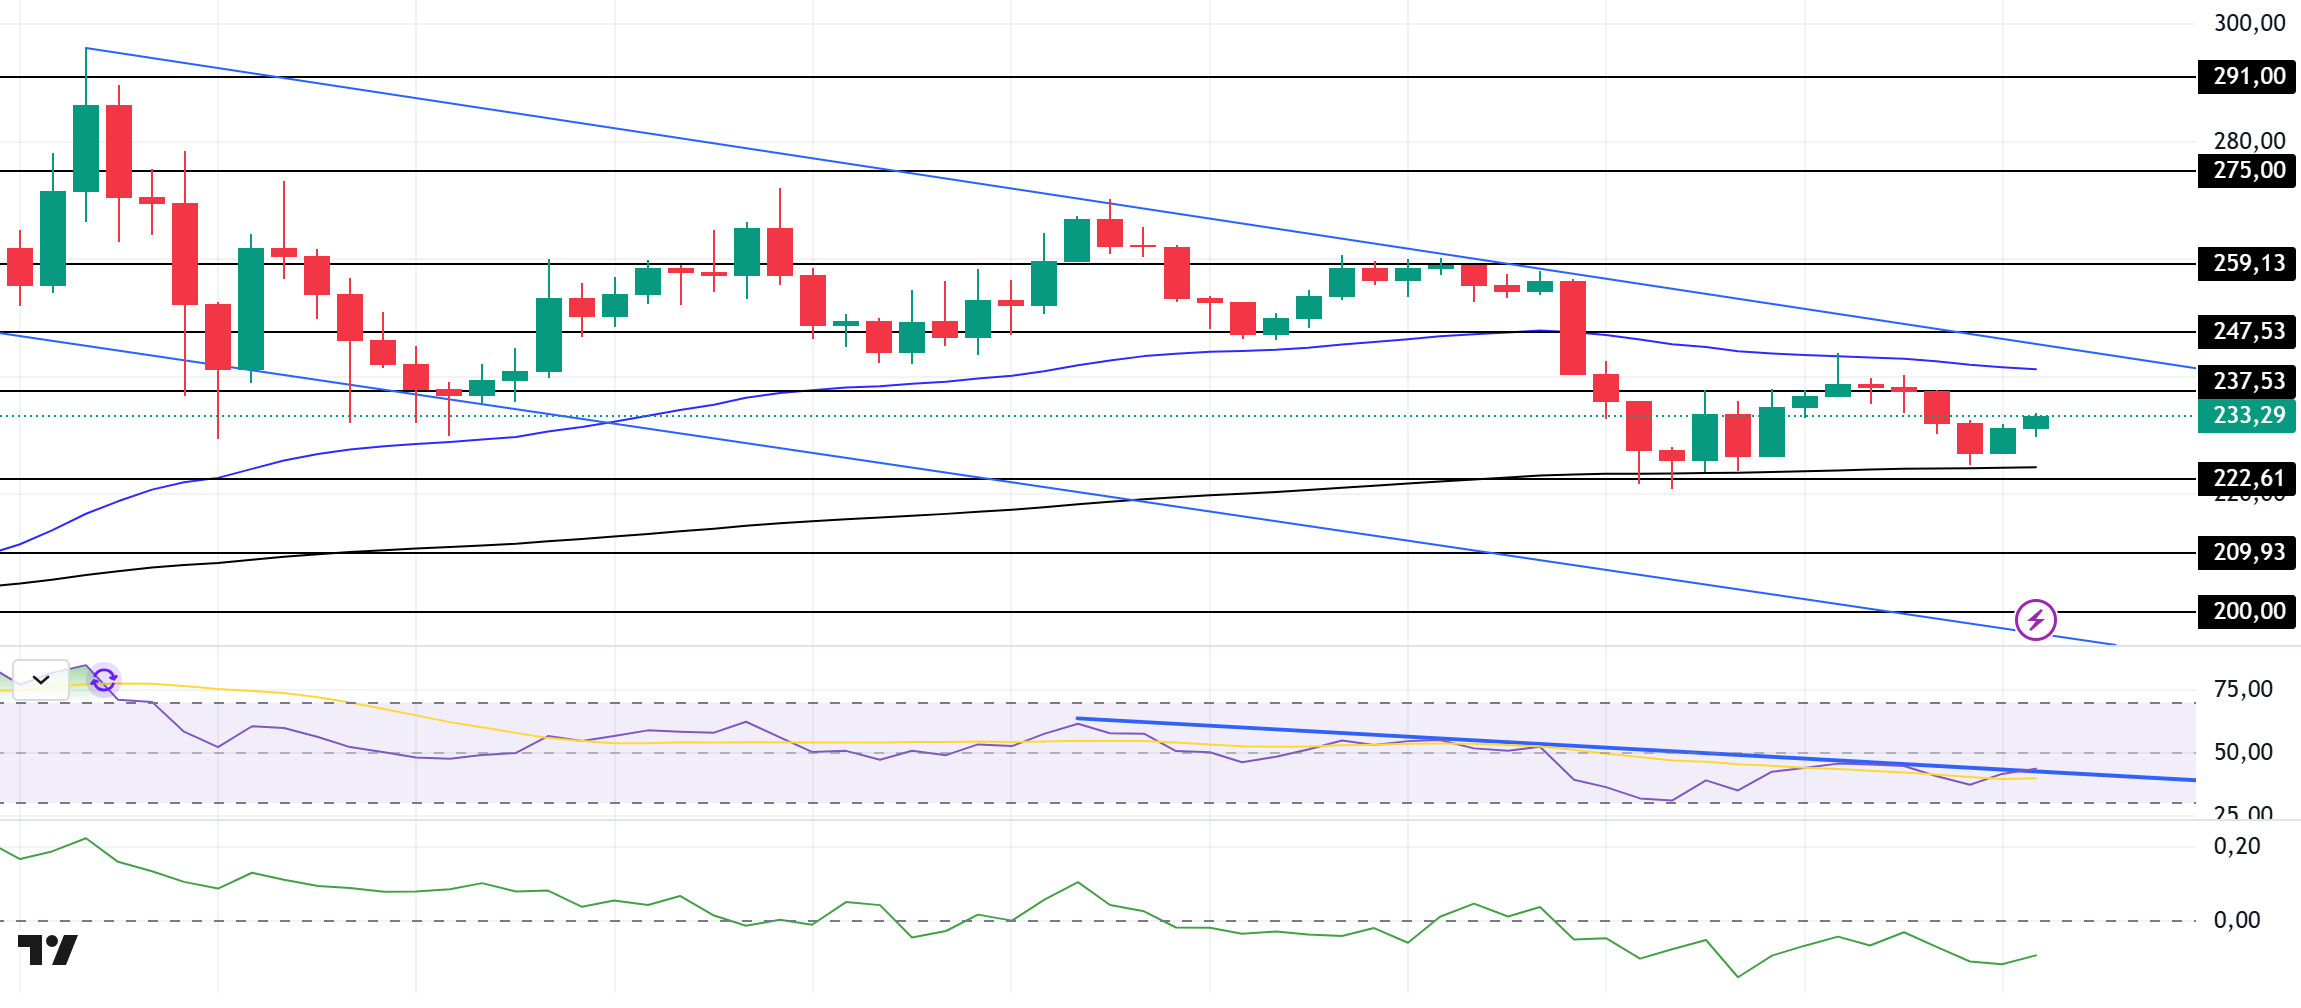
SOL continues to maintain the downtrend that started on January 19 and continues to be priced at the mid-level of the downtrend. The asset tested the 200 EMA as support for the second time and turned slightly bullish. On the 4-hour timeframe, the 50 EMA (Blue Line) continues to be above the 200 EMA (Black Line). This may mean that the uptrend will continue in the medium term. At the same time, the asset is between the 50 EMA and the 200 EMA and is trying to set a direction. When we examine the Chaikin Money Flow (CMF)20 indicator, it is in the negative zone, but at the same time, money outflows have decreased. However, the Relative Strength Index (RSI)14 indicator is in the middle of the selling zone and the RSI is at the resistance of the downtrend. This can be seen as an opportunity for a sell trade. The 259.13 level is a very strong resistance point in the uptrend driven by both the upcoming macroeconomic data and the news in the Solana ecosystem. If it breaks here, the rise may continue. In case of retracements for the opposite reasons or due to profit sales, the 209.93 support level can be triggered. If the price reaches these support levels, a potential bullish opportunity may arise if momentum increases.
Supports 222.61 – 209.93 – 200.00
Resistances 237.53 – 247.43 – 259.13
DOGE/USDT
Bitwise applied to the US Securities and Exchange Commission to list Dogecoin as an ETF. On the other hand, Dogecoin Open Interest data fell by 1.7 billion dollars. On the other hand, news from the FOMC today may cause fluctuations.
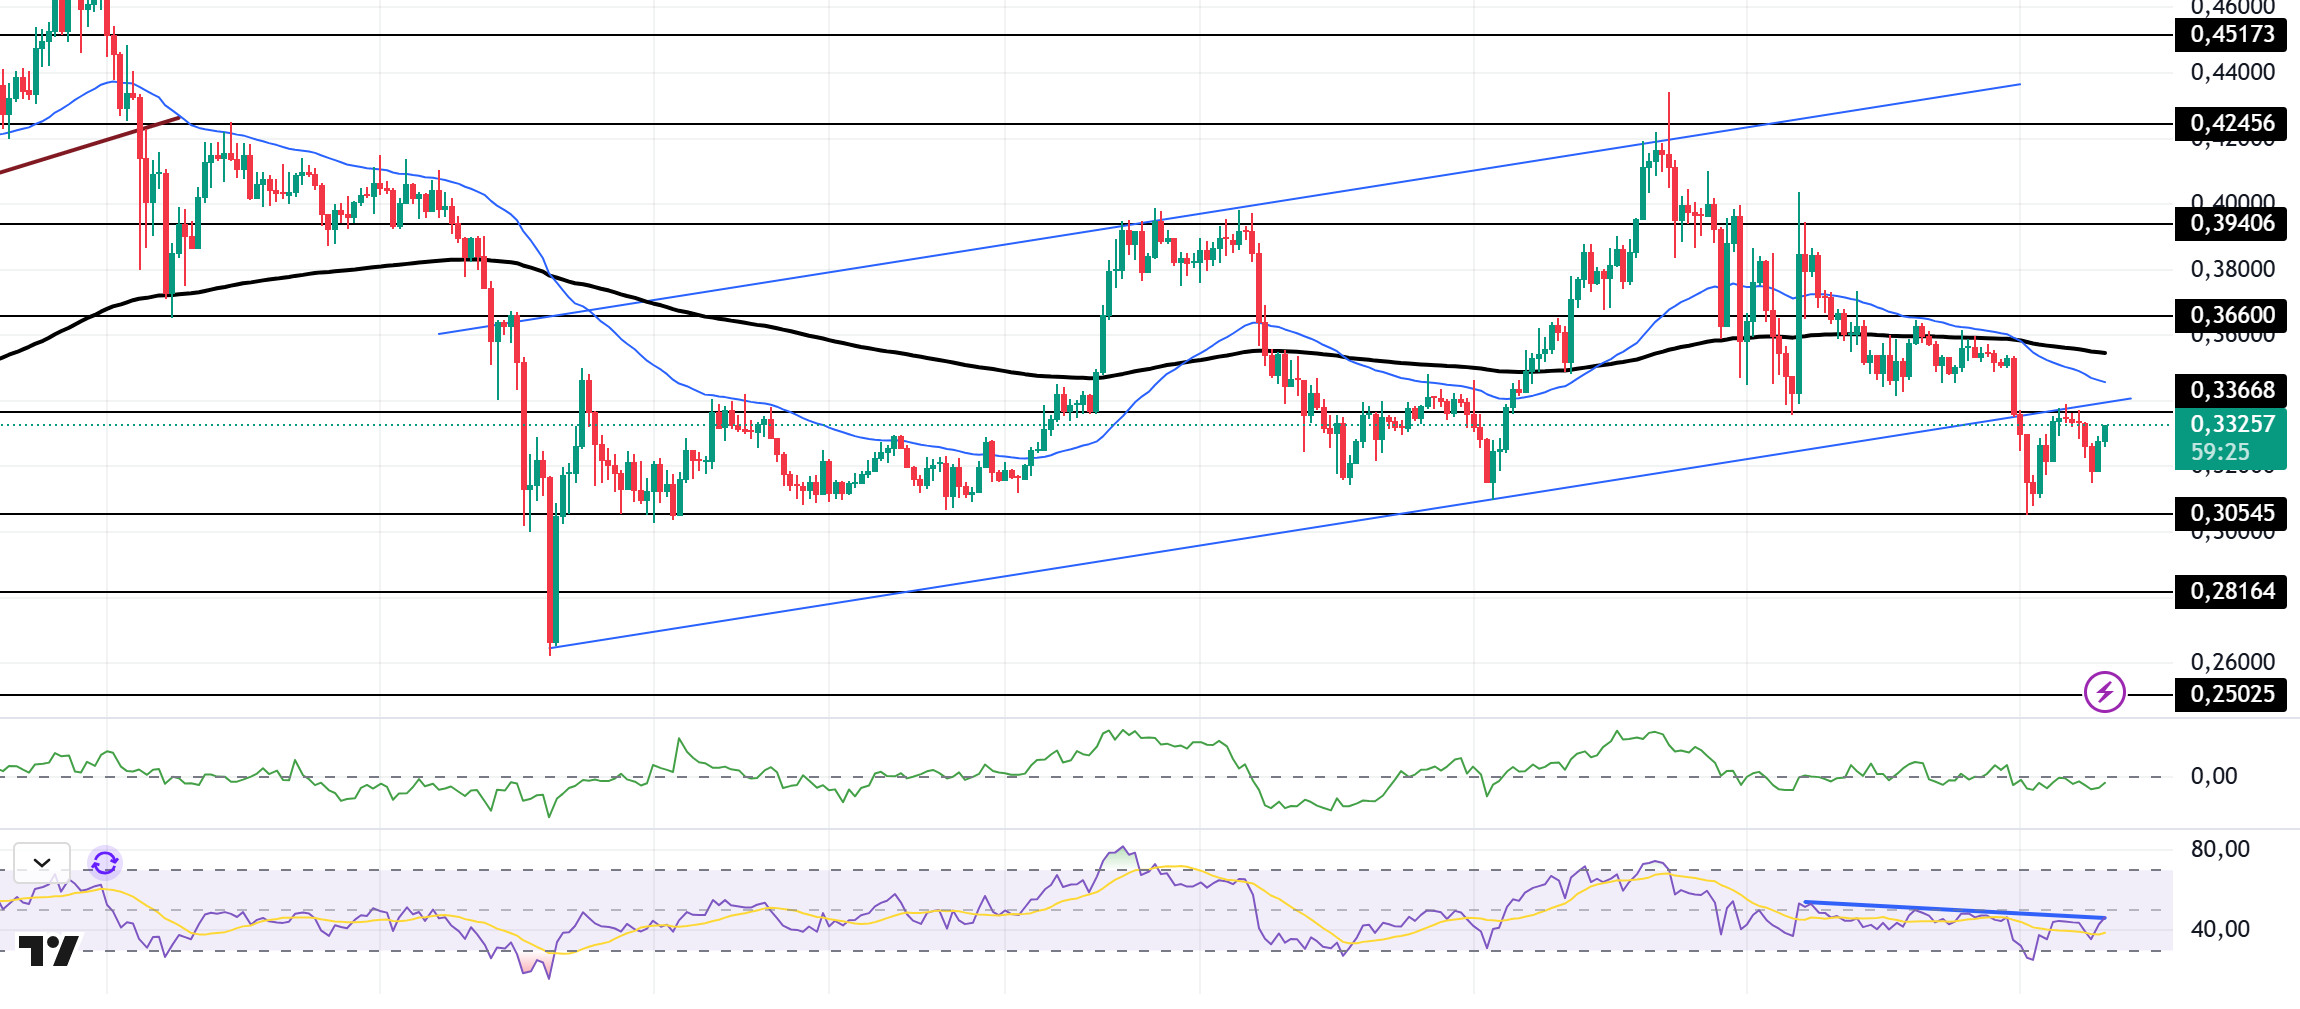
DOGE has remained flat since our morning analysis. Breaking the 20 December uptrend with a strong downside candle, the asset tested the base level of the uptrend as resistance and retreated from there. On the 4-hour timeframe, the 50 EMA (Blue Line) started to be below the 200 EMA (Black Line). This could mean that the decline could deepen in the medium term. At the same time, the price is below the 50 EMA (Blue Line) and the 200 EMA (Black Line). When we examine the Chaikin Money Flow (CMF)20 indicator, it is in the negative zone, close to the neutral zone, but money inflows and outflows are in balance. However, the Relative Strength Index (RSI)14 is in the negative zone near the neutral level. At the same time, the RSI indicator is testing the resistance of the downtrend. The 0.39406 level appears to be a very strong resistance point in the rises due to political reasons, macroeconomic data and innovations in the DOGE coin. In case of possible pullbacks due to political, macroeconomic reasons or negativities in the ecosystem, the 0.28164 level, which is the base level of the trend, is an important support. If the price reaches these support levels, a potential bullish opportunity may arise if momentum increases.
Supports 0.30545 – 0.28164 – 0.25025
Resistances 0.33668 – 0.36600 – 0.39406
LEGAL NOTICE
The investment information, comments and recommendations contained herein do not constitute investment advice. Investment advisory services are provided individually by authorized institutions taking into account the risk and return preferences of individuals. The comments and recommendations contained herein are of a general nature. These recommendations may not be suitable for your financial situation and risk and return preferences. Therefore, making an investment decision based solely on the information contained herein may not produce results in line with your expectations.


