MARKET SUMMARY
Latest Situation in Crypto Assets
| Assets | Last Price | 24h Change | Dominance | Market Cap. |
|---|---|---|---|---|
| BTC | 94,255.88 | -5.89% | 60.91% | 1,86 T |
| ETH | 2,539.12 | -18.34% | 9.98% | 305,64 B |
| XRP | 2.339 | -19.36% | 4.39% | 134,42 B |
| SOLANA | 196.28 | -7.54% | 3.12% | 95,43 B |
| DOGE | 0.2479 | -17.85% | 1.19% | 36,47 B |
| CARDANO | 0.6904 | -22.34% | 0.79% | 24,22 B |
| TRX | 0.2208 | -8.81% | 0.62% | 19,01 B |
| LINK | 18.59 | -18.06% | 0.39% | 11,86 B |
| AVAX | 24.92 | -20.58% | 0.33% | 10,27 B |
| SHIB | 0.00001410 | -19.40% | 0.27% | 8,32 B |
| DOT | 4.527 | -22.20% | 0.23% | 7,00 B |
*Prepared on 2.3.2025 at 07:00 (UTC)
WHAT’S LEFT BEHIND
Trump’s Tariffs Cause a Crypto Market Crash
Crypto markets fell sharply after US President Donald Trump announced import tariffs on Canada, Mexico and China. The CoinDesk 20 index fell 19%, while Ethereum fell 25% to its lowest level since November. Bitcoin fell 7% to $93,768.
Trump: Not Surprised by Fed’s Interest Rate Decision
Trump said that the Fed’s decision to keep interest rates unchanged was “correct under the current circumstances” and that he was not surprised by the decision.
Over $2 Billion Liquidated in the Last 24 Hours
According to Coinglass data, a total of $2.053 billion was liquidated in the last 24 hours. Of this, 1.78 billion dollars consisted of long positions and 273 million dollars consisted of short positions.
Bitcoin Is 22% Likely to Fall to $75,000 by the End of March
According to Derive.xyz, there is a 22% probability that Bitcoin will fall to $75,000 by March 28. This is a significant increase compared to last week.
EU: We Will Respond Strongly to Trump’s Tariffs
The EU reacted strongly to Trump’s plan to impose tariffs on the European Union. The EU announced that it would respond strongly in this case and emphasized that tariffs are harmful for all parties.
Crypto Market Cap Falls to $3.3 Trillion, Bitcoin’s Market Share Rises to 60%
According to Coingecko data, the total value of the crypto market fell 7.8% to $3.3 trillion. Bitcoin’s market share rose to 60.58%.
South Korea’s “Kimchi Premium” Rises to 9.7
South Korea’s Bitcoin “Kimchi premium” rose to 9.7%, the highest level in 10 months, according to CryptoQuant data. This increase is associated with concerns about Trump’s tariff wars.
Bitwise: US Bitcoin Spot ETFs Expect $59 Billion Inflows in 2025
Bitwise investment director Matt Hougan announced that they expect $59 billion of inflows into US Bitcoin spot ETFs by the end of 2025. Inflows in 2024 reached $35.2 billion.
Bitwise CEO: Five Digital Asset Spot ETFs Could Be Approved This Year
Bitwise CEO Matt Hougan said the SEC could approve spot ETFs for five different digital assets this year. However, for this to happen, the SEC needs to overcome regulatory hurdles.
HIGHLIGHTS OF THE DAY
Important Economic Calender Data
| Time | News | Expectation | Previous |
|---|---|---|---|
| Digital Assets Forum | Held in London, England | ||
| Onyxcoin | Major Update to be Unveiled | ||
| FLOKI (FLOKI) | AMA event scheduled | ||
| 14:45 | US S&P Global Manufacturing PMI (Jan) | 50.1 | 50.1 |
| 15:00 | US ISM Manufacturing PMI (Jan) | 49.3 | 49.3 |
| 17:30 | FOMC Member Bostic Speaks | ||
| 22:30 | FOMC Member Musalem Speaks |
INFORMATION
*The calendar is based on UTC (Coordinated Universal Time) time zone.
The economic calendar content on the relevant page is obtained from reliable news and data providers. The news in the economic calendar content, the date and time of the announcement of the news, possible changes in the previous, expectations and announced figures are made by the data provider institutions. Darkex cannot be held responsible for possible changes that may arise from similar situations.
MARKET COMPASS
Global markets started the second month of the year with a jolt from Trump’s new tariffs. In addition to additional tariffs on Canada, Mexico and China, the President also announced new tariffs on Europe. Following these developments, which triggered fears of a new “trade war”, a risk-off mood started to prevail in the markets and this morning, Asia-Pacific indices sold off. European and Wall Street futures contracts also pointed to negative openings. The dollar appreciated and digital assets declined.
In fact, the President’s steps on tariffs are not new news, but the fact that they have started to turn from a promise into reality has caused concerns in the markets. Investors who do not want to take the risk of the issue turning into a global trade war have adjusted their positions, leading to the price changes we have seen so far. It seems that we will continue to monitor the repercussions of the news on this issue throughout the week. In addition, macro indicators regarding the health of the US economy will also be on the agenda.
After the recent losses in digital assets, assuming that there is no new news flow, we may observe a horizontal price band for a while. Afterwards, the US agenda will again be decisive on whether there will be a reaction rally to these losses. For the long term, as we mentioned below, we do not change our bullish expectation.
From the short term to the big picture…
Trump’s victory on November 5, one of the main pillars of our bullish expectation for the long-term outlook in digital assets, produced a result in line with our predictions. In the process that followed, the appointments made by the president-elect and the increasing regulatory expectations for the crypto ecosystem in the US and the emergence of BTC as a reserve continued to take place in our equation as positive variables. Then, 4 days after the new President took over the White House, he signed the “Cryptocurrency Working Unit” decree, which was among his election promises, and we think that the outputs it will produce in the coming days will continue to reflect positively on digital assets.
On the other hand, the expectations that the FED will continue its interest rate cut cycle, albeit on hiatus for now, and the fact that the volume in crypto-asset ETFs indicates an increase in institutional investor interest, support our upside forecast for the big picture. In the short term, given the nature of the market and pricing behavior, we think it would not be surprising to see occasional pause or pullbacks in digital assets. However, at this point, it is worth emphasizing again that we think that the fundamental dynamics continue to be bullish.
TECHNICAL ANALYSIS
BTC/USD
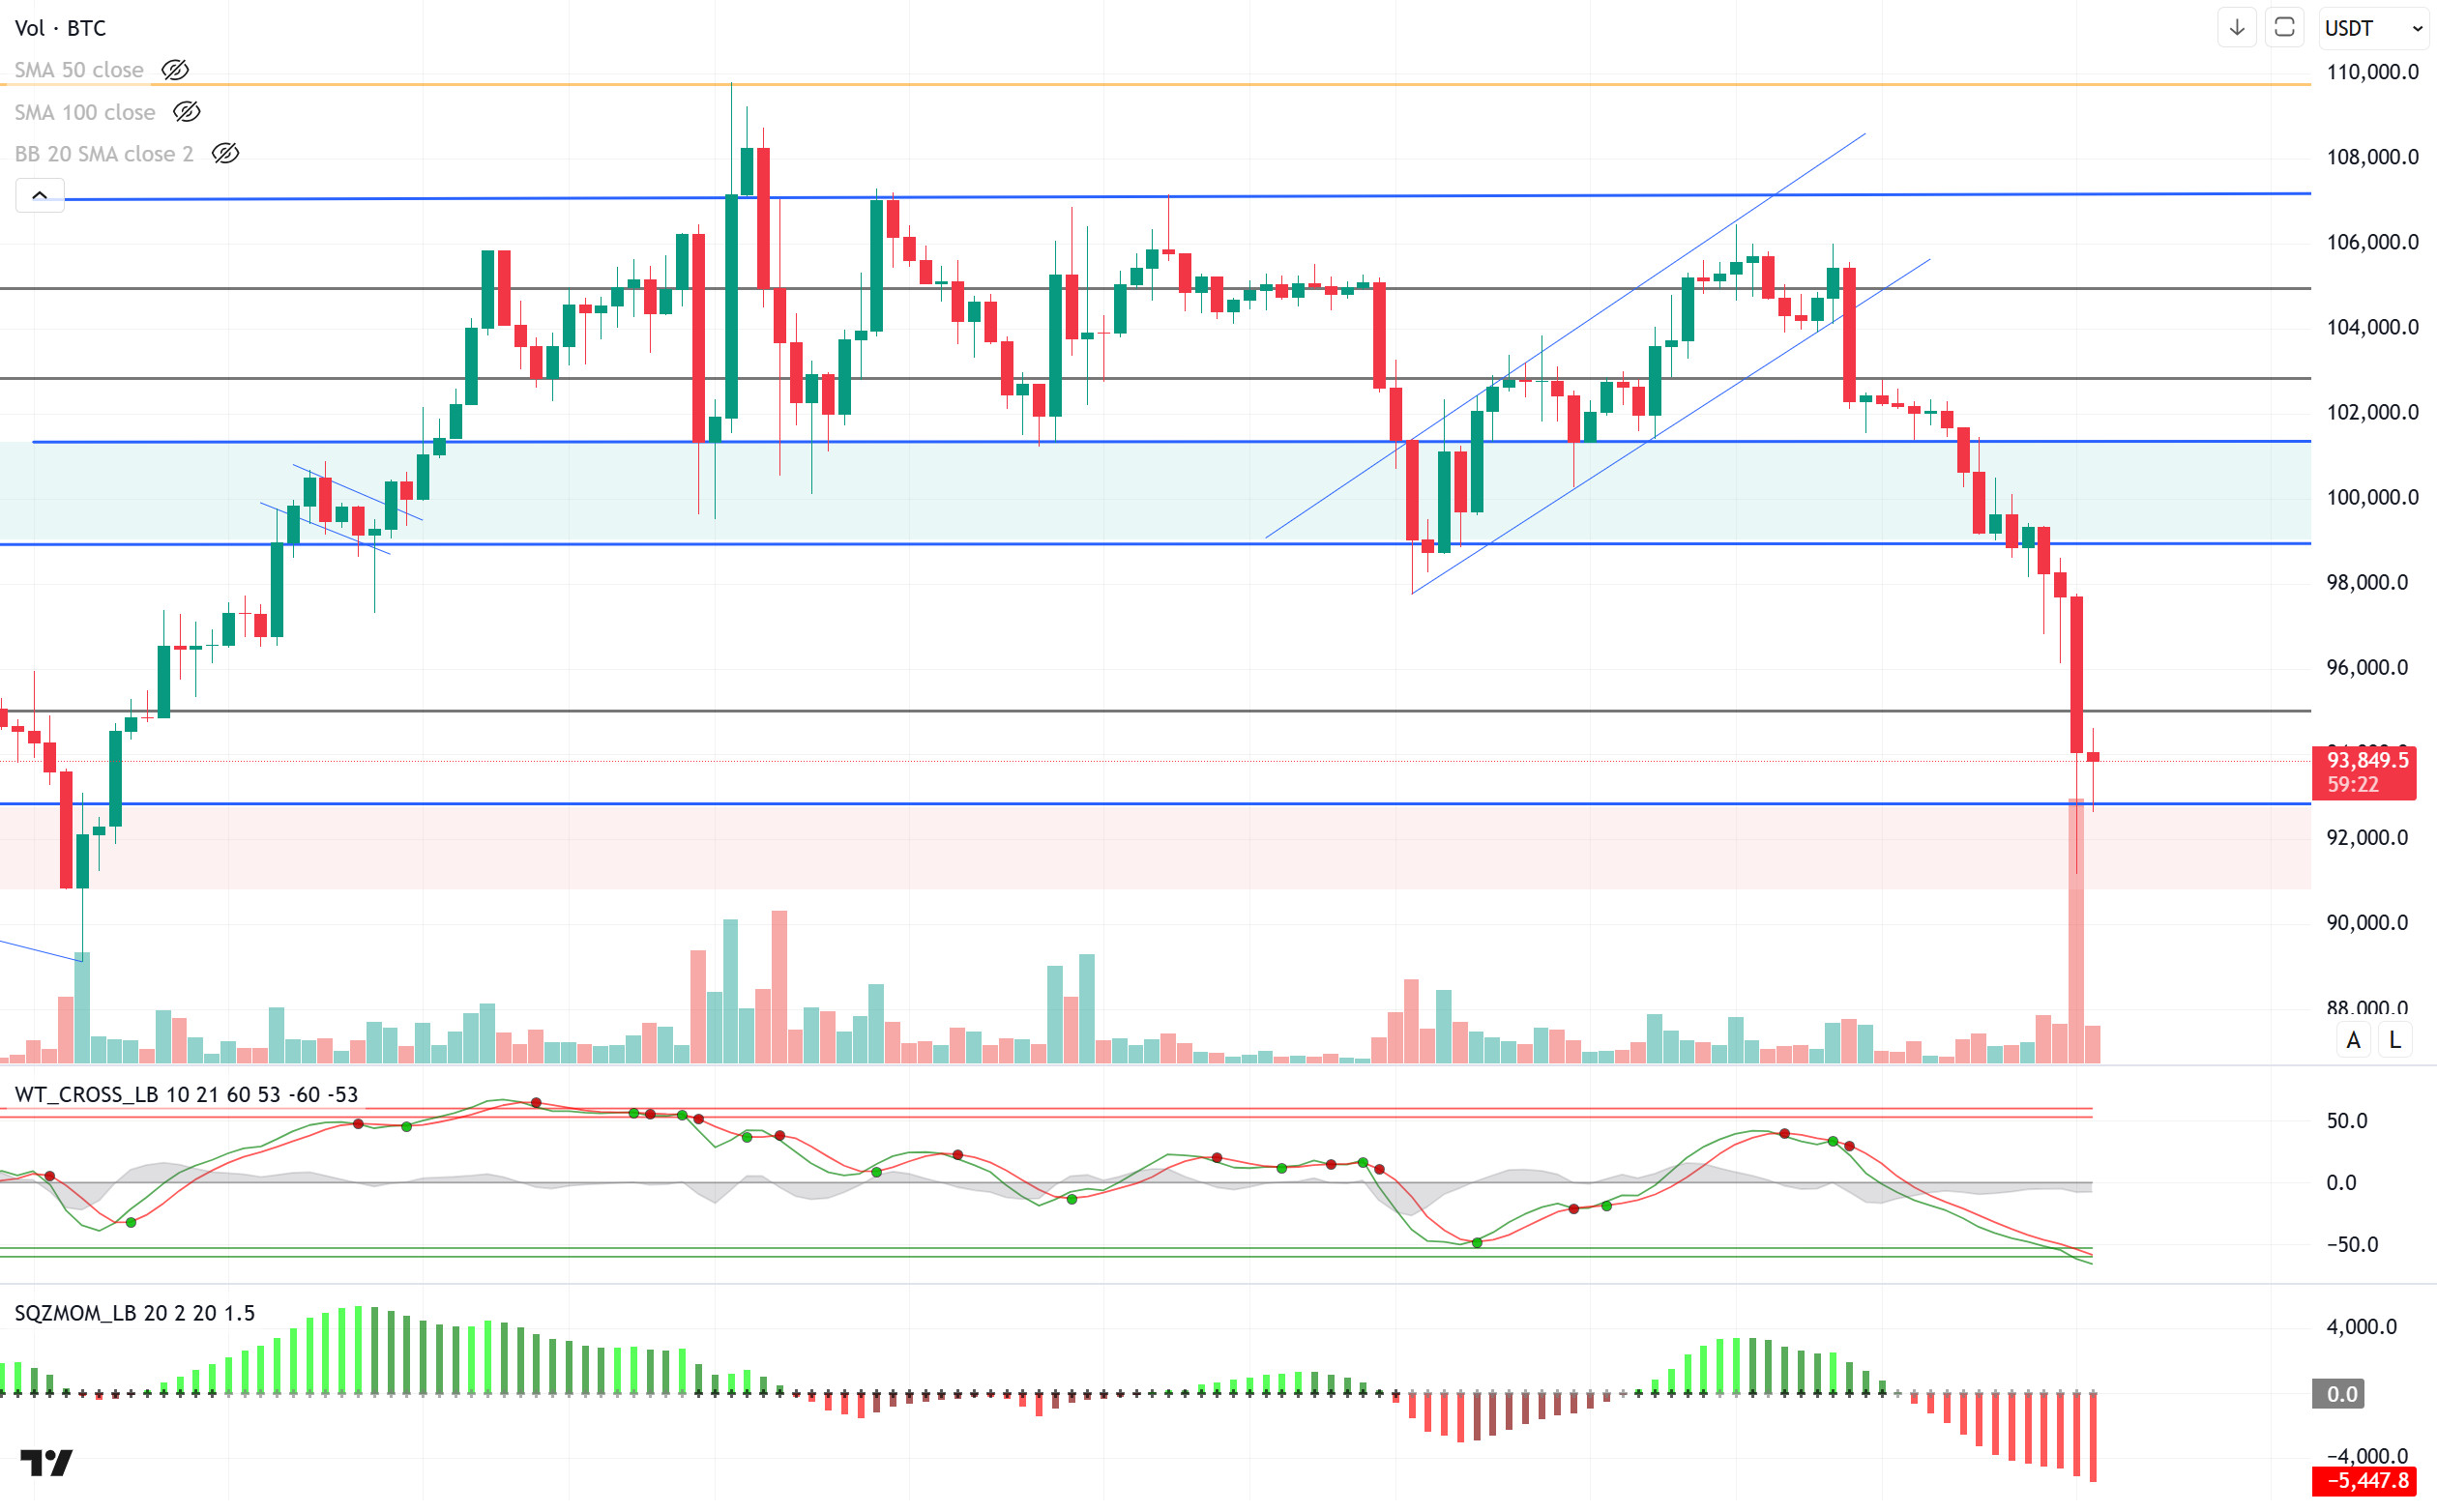
Crypto markets fell sharply after US President Donald Trump announced import tariffs on Canada, Mexico and China. A total of $2.053 billion was liquidated in the last 24 hours, while the total value of the market fell to $2.8 trillion. Bitcoin’s dominance exceeded 64% and rose above the March 2021 level.
When we look at the technical outlook, BTC, which came above the 106,000 level in the rising trend channel last week, experienced a historic retreat. BTC, which lost 102,800, 101,400, 99,100, 99,100 and 95,000, the major support level, respectively, fell to 91,160. Currently trading at 94,100, the price seems to be in an effort to recover. When we look at the technical oscillators, it is seen that it has reached the oversold zone and the momentum indicator has weakened well in the negative zone. In case the price recovers, closures above the 95,000 level will be followed. If the uncertainty and selling pressure continues, the 92,800 level appears as a support point, while we can watch the deepening of the retreat in case of a break.
Supports 92,800 – 90,400 – 88,000
Resistances 95,000 – 97,200 – 99,100
ETH/USDT
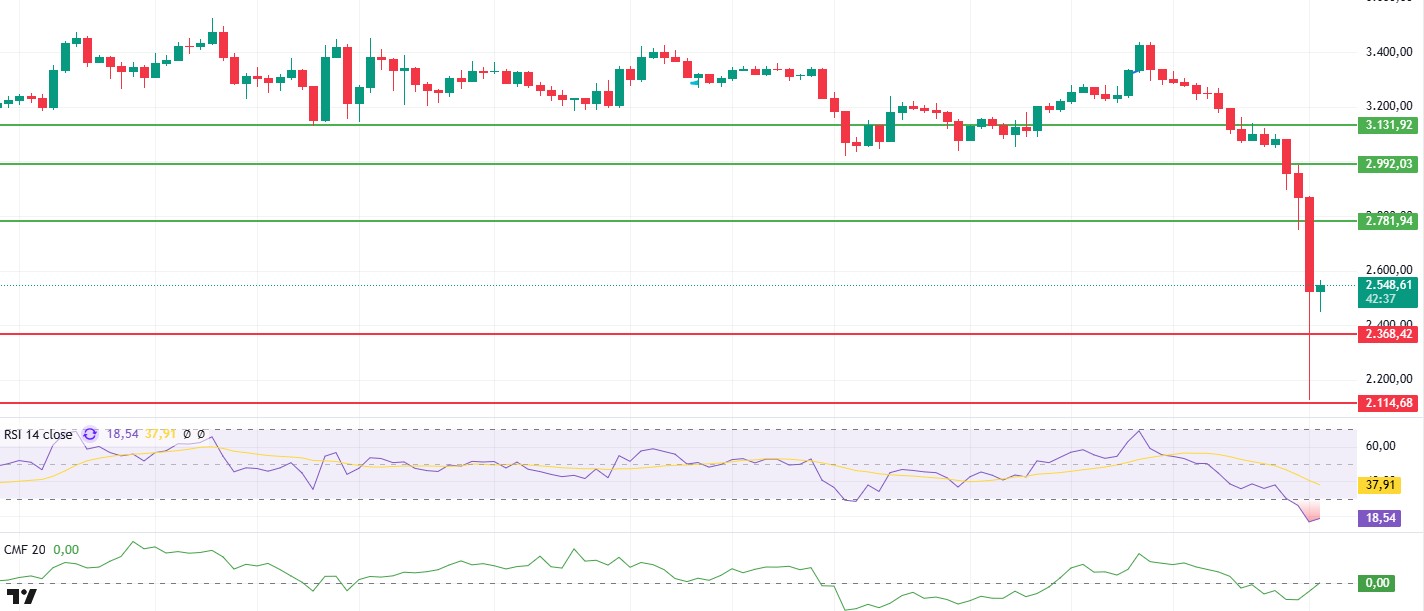
Following the statements made by former US President Donald Trump on Friday, concerns about a trade war that could threaten global economic growth have increased. With new tariffs on China, Canada and Mexico on the agenda, traditional markets came under severe selling pressure, while cryptocurrency markets were also affected by this negative mood. Ethereum (ETH), after rising as high as $3,438, failed to maintain support levels and suffered a sharp retreat, falling as low as $2,114. However, it received a strong reaction from this point and rose above the $2,500 level again.
With Ethereum’s sharp decline, technical indicators have also fallen into oversold territory. The Relative Strength Index (RSI) has fallen into oversold territory, dropping as low as 16.50. This is an extremely low level, indicating that the market has entered a severely oversold territory and a possible reaction buy could be coming. The Chaikin Money Flow (CMF) indicator started to show signs of recovery after yesterday’s sharp drop. This indicates that money inflows have resumed and selling pressure has partially eased. Moreover, the positive divergence on CMF is noteworthy, which may indicate that buyers are gradually returning to the market.
Given the current volatility, it is important to see how the Ethereum price will move around critical levels. ETH’s regain of the $2,781 level could signal that buyers are gaining strength, indicating that the decline is temporary and the uptrend could continue. On the other hand, a downside break of the $2,368 level could confirm that the selling pressure continues and the downtrend could continue. In this case, the price may test lower support levels.
Supports 2,368 – 2,114 – 1,197
Resistances 2,781 – 2,992 – 3,131
XRP/USDT
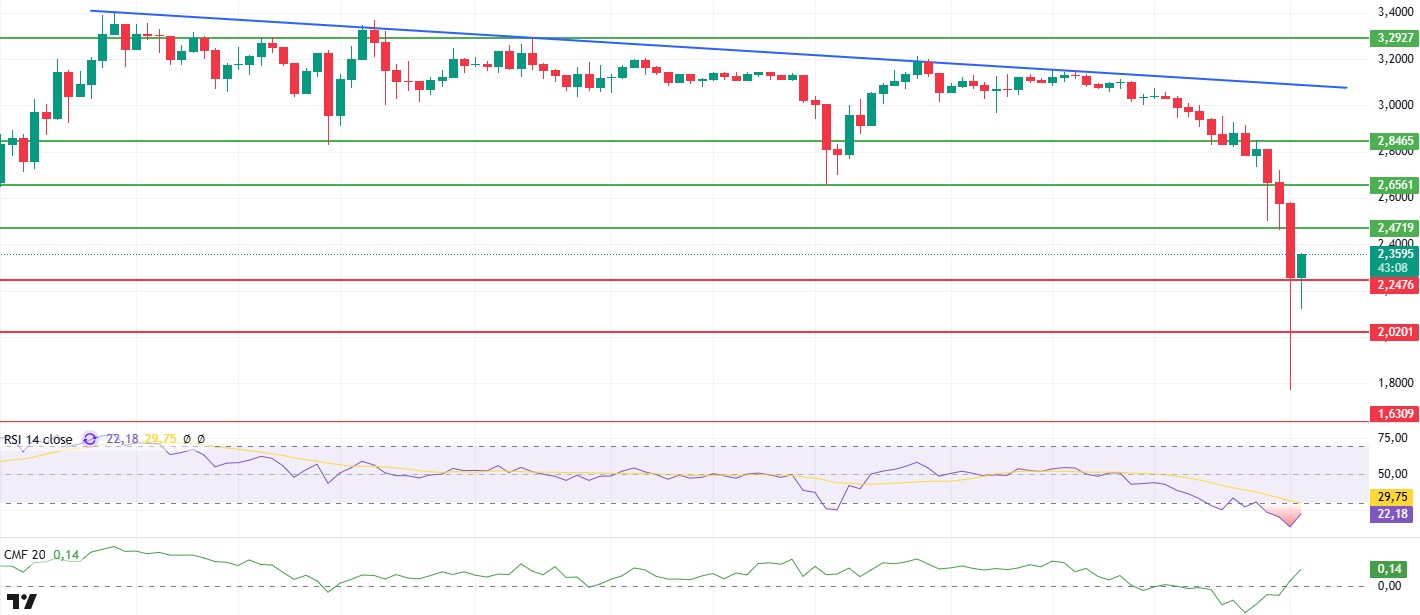
With the statements made by former US President Donald Trump on Friday increasing global economic uncertainty, the markets experienced sharp fluctuations, while the cryptocurrency market was also affected by this selling pressure. In this process, XRP also joined the bearish movement and fell to the level of $ 1.76. However, it has rebounded strongly from this point, regaining support levels and is currently pricing above the $2.34 level.
Technical indicators signal the start of a post-decline recovery. Chaikin Money Flow (CMF) recovered and re-entered the positive territory after moving into the negative zone with the sharp decline. This indicates that market players are becoming more active on the buying side after the decline and fund inflows are increasing. At the same time, Relative Strength Index (RSI) is slightly bullish despite being in oversold territory. The upward movement of the RSI from this region indicates that buyers are gaining strength and the price has the potential to gain upward momentum.
According to the current market structure, if XRP breaks the $2.47 level, it may confirm that the recent decline is a deep correction and the uptrend may continue. On the other hand, closes below the $2.02 level may indicate that selling pressure may increase again and the downtrend may continue for a while.
Supports 2.2476 – 2.0201 – 1.6309
Resistances 2.4719 – 2.6561 – 2.8465
SOL/USDT
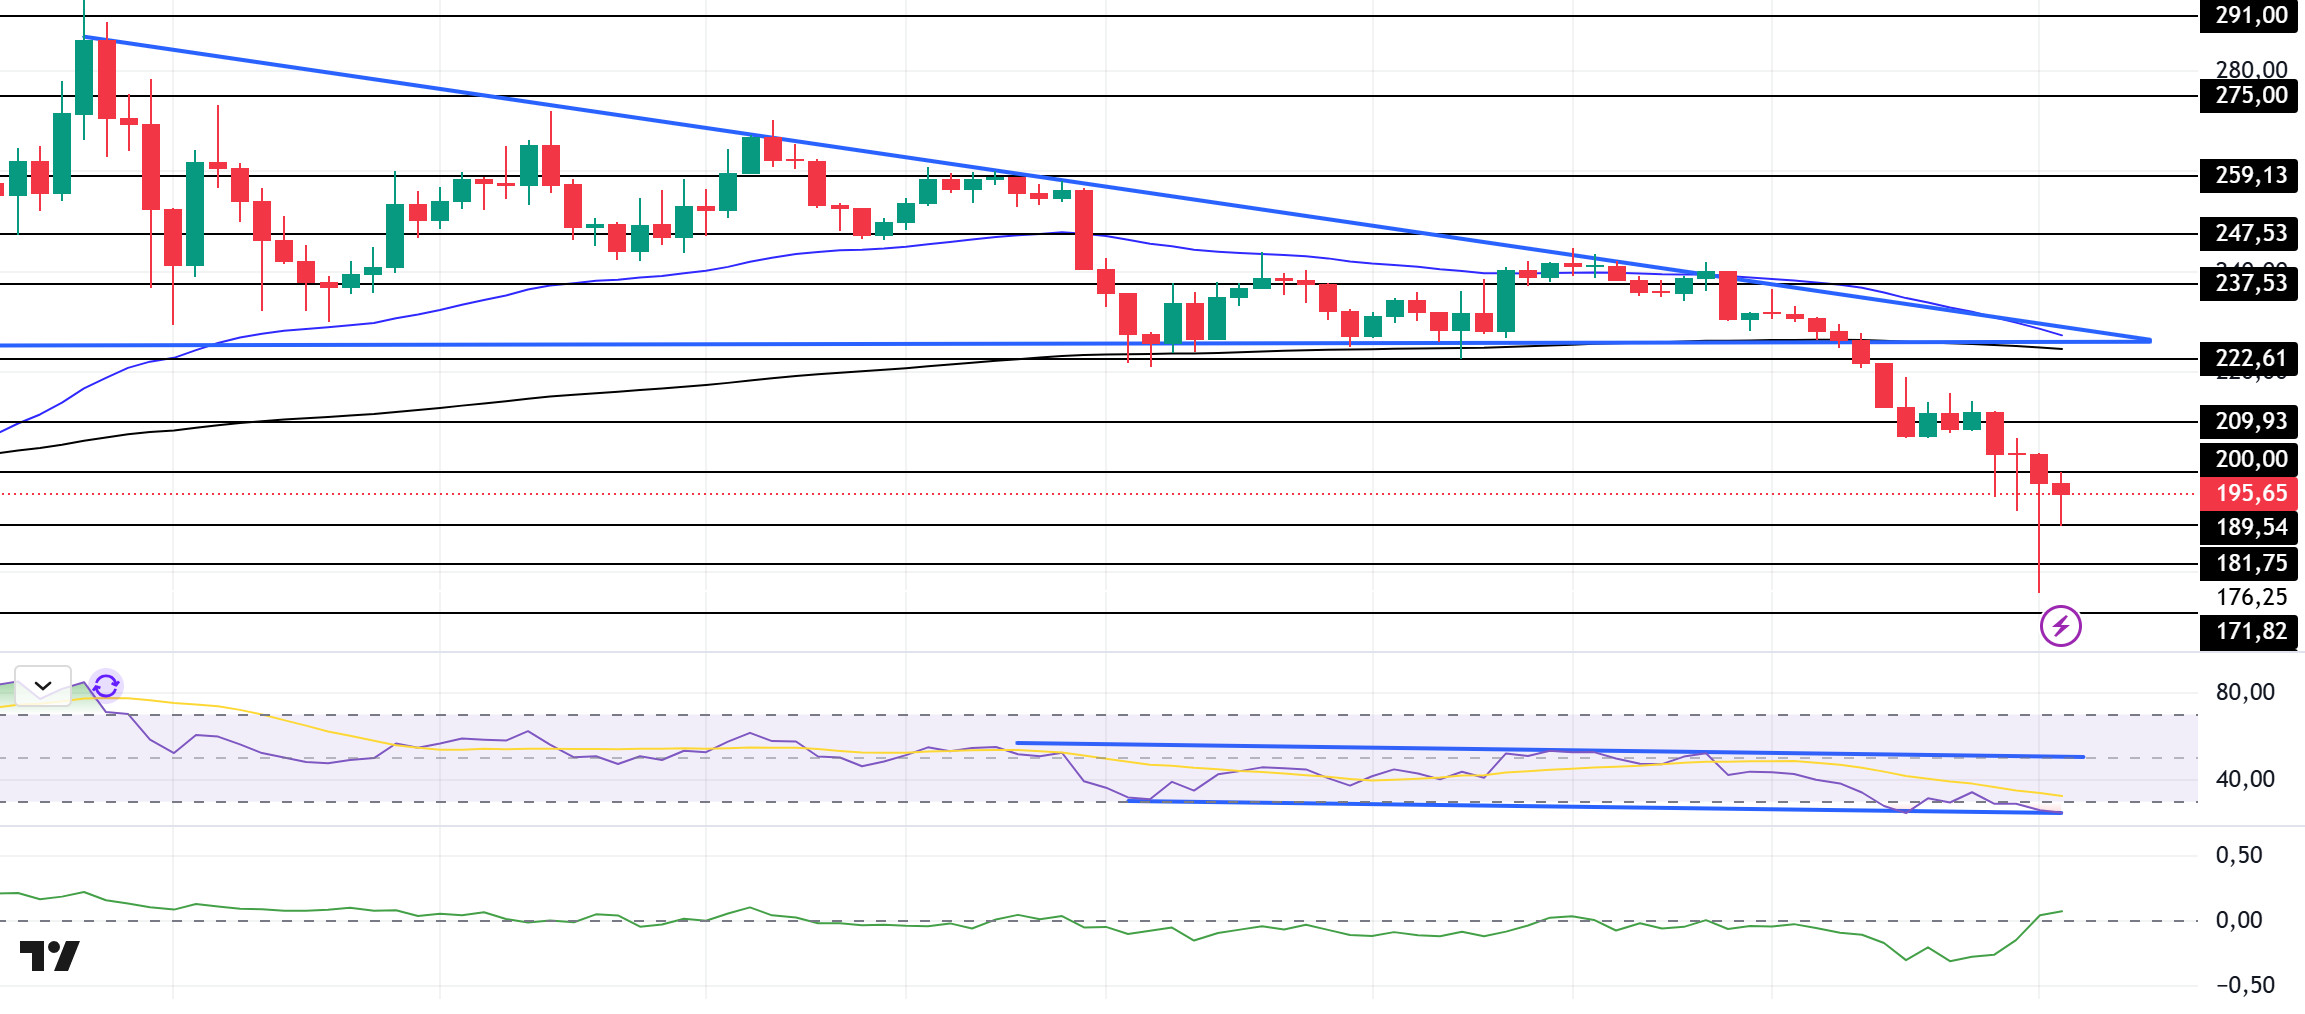
A central exchange sent $32 million worth of SOL to Wintermute while another central exchange sent $30 million USDC to potentially buy the dip. Solana’s market fell by over 15% over the weekend amid talk of alleged manipulation by a centralized exchange. In data shared by CoinGlass, long-term holders and investors are accumulating tokens. Data from spot inflows and outflows showed that exchanges witnessed a significant inflow of SOL tokens worth over $100 million in the last 72 hours. On the other hand, $85.81 million worth of SOL has been liquidated in the last 24 hours.
The cryptocurrency market collapsed over the weekend. SOL has fallen about 15% in the last two days. Starting on January 19, the decline continued to deepen. The descending triangle pattern broke the support zone despite two attempts. On the 4-hour timeframe, the 50 EMA (Blue Line) continues to be above the 200 EMA (Black Line). But the two averages are very close to each other. This could mean that the uptrend will continue in the medium term. At the same time, the asset started pricing below the 50 EMA and 200 EMA. When we examine the Chaikin Money Flow (CMF)20 indicator, it is in positive territory, but at the same time, money inflows are increasing sharply. However, the Relative Strength Index (RSI)14 indicator is in oversold territory and the downtrend in the RSI that started on January 19 continues. It is currently testing the support point of the downtrend. The 237.53 level appears to be a very strong resistance point in the rises driven by both the upcoming macroeconomic data and the news in the Solana ecosystem. If it breaks here, the rise may continue. In case of retracements for the opposite reasons or due to profit sales, the 209.93 support level can be triggered. If the price comes to these support levels, a potential bullish opportunity may arise if momentum increases.
Supports 189.54 – 181.75 – 171.82
Resistances 247.43 – 259.13 – 275.00
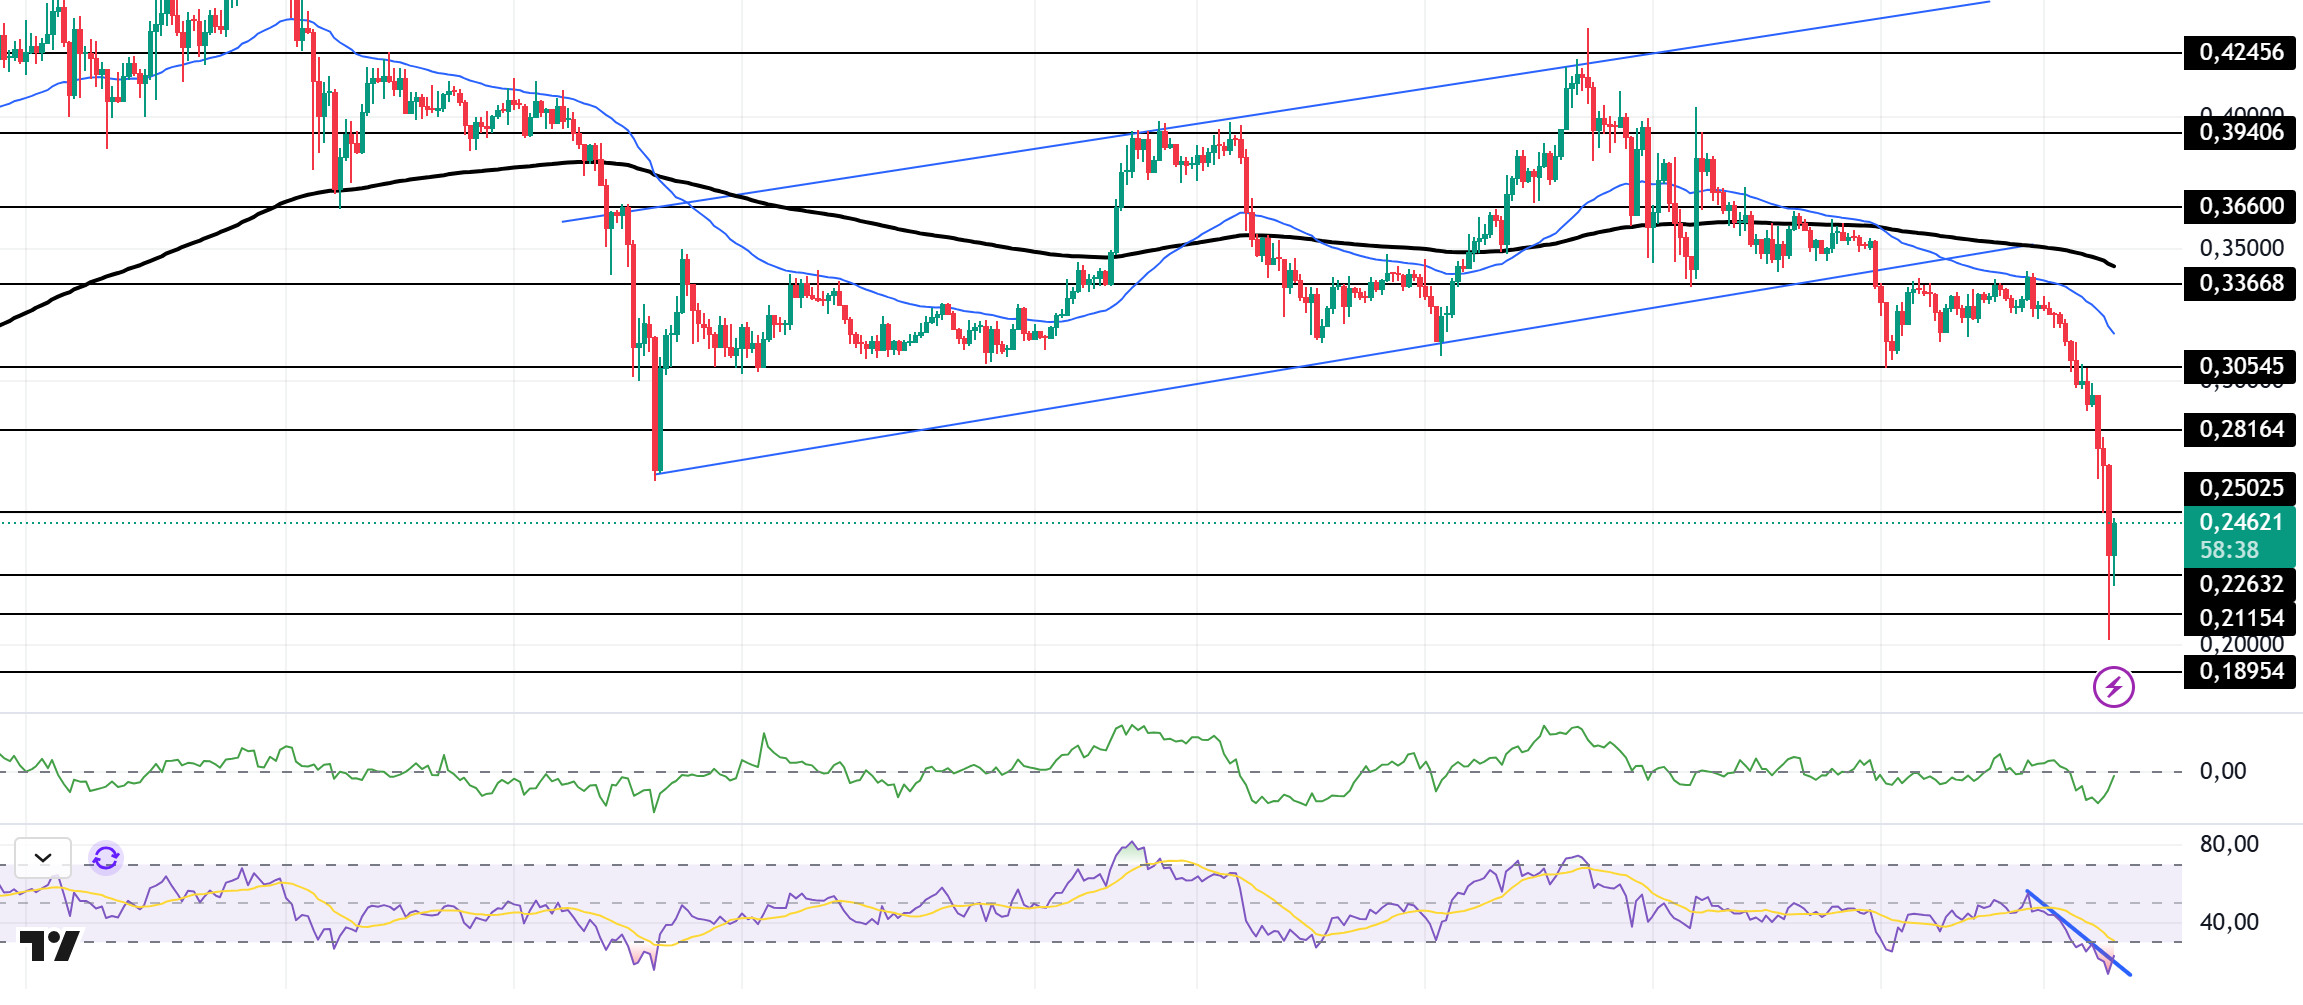
DOGE/USDT
Asset manager Grayscale launched the Dogecoin Trust for institutional investors, a move that could signal the next Dogecoin ETF application. Separately, $87.11 million was liquidated in the last 24 hours.
DOGE has taken its share of the cryptocurrency market decline. It has fallen by nearly 40% in the last few days. After breaking the uptrend it started on December 20th with a strong downside candle, the asset deepened this decline over the weekend. On the 4-hour timeframe, the 50 EMA (Blue Line) remains below the 200 EMA (Black Line). This could mean that the decline could deepen further in the medium term. At the same time, the price is below the 50 EMA (Blue Line) and the 200 EMA (Black Line). However, the large gap between the moving averages and the asset may increase the probability of DOGE rising. When we analyze the Chaikin Money Flow (CMF)20 indicator, it has moved towards the neutral zone. However, it is seen that money inflows and outflows are in balance. At the same time, the Relative Strength Index (RSI)14 is in oversold territory and the RSI indicator seems to have broken the downtrend upwards. This shows us that the price is strengthening here. The 0.33668 level appears to be a very strong resistance point in the rises due to political reasons, macroeconomic data and innovations in the DOGE coin. In case of possible pullbacks due to political, macroeconomic reasons or negativities in the ecosystem, the 0.18954 level, which is the base level of the trend, is an important support. If the price reaches these support levels, a potential bullish opportunity may arise if momentum increases.
Supports 0.22632 – 0.21154 – 0.18954
Resistances 0.25025 – 0.28164 – 0.30545
LEGAL NOTICE
The investment information, comments and recommendations contained herein do not constitute investment advice. Investment advisory services are provided individually by authorized institutions taking into account the risk and return preferences of individuals. The comments and recommendations contained herein are of a general nature. These recommendations may not be suitable for your financial situation and risk and return preferences. Therefore, making an investment decision based solely on the information contained herein may not produce results in line with your expectations.