
MARKET SUMMARY
Latest Situation in Crypto Assets
| Assets | Last Price | 24h Change | Dominance | Market Cap. |
|---|---|---|---|---|
| BTC | 98,693.83$ | 0.10% | 60.92% | 1,96 T |
| ETH | 2,776.07$ | -0.73% | 10.39% | 334,70 B |
| XRP | 2.457$ | 1.78% | 4.41% | 141,94 B |
| SOLANA | 200.58$ | 0.15% | 3.04% | 97,81 B |
| DOGE | 0.2579$ | -1.48% | 1.19% | 38,20 B |
| CARDANO | 0.7424$ | -0.81% | 0.81% | 26,08 B |
| TRX | 0.2307$ | 0.46% | 0.61% | 19,83 B |
| LINK | 19.61$ | -0.01% | 0.39% | 12,48 B |
| AVAX | 25.85$ | -1.64% | 0.33% | 10,61 B |
| SHIB | 0.00001553$ | -1.35% | 0.28% | 9,14 B |
| DOT | 4.855$ | 2.74% | 0.23% | 7,51 B |
*Prepared on 2.7.2025 at 14:00 (UTC)
WHAT’S LEFT BEHIND
US, Non-Farm Payrolls Data announced
Announced:143K
Expectation 169K
Previous 256K
US Unemployment Rate Announced
Announced: 4.0%
Expectation: 4.
Previous: 4.1%
SEC Accelerates Crypto ETF Reviews
Following the departure of Gary Gensler, the US Securities and Exchange Commission (SEC) has begun to review crypto ETF applications faster. This indicates that the SEC has adopted a more open approach to crypto assets with its new administration.
SOL Spot ETF:
Grayscale, Bitwise, VanEck, 21Shares and Canary Capital filed applications for a Solana (SOL) spot ETF. Among these applications, Grayscale’s application was accepted by the SEC and entered the review process.
XRP Spot ETF:
Grayscale, Bitwise, Canary Capital, 21Shares and Wisdom tree have filed XRP spot ETF applications with the SEC. The SEC has started the review process to evaluate the applications.
LTC Spot ETF:
Grayscale and Canary Capital’s Litecoin (LTC) spot ETF applications have been accepted by the SEC. The applications are currently in the public comment period and the SEC is in the process of evaluating them for approval or disapproval.
Other Spot ETF Applications:
NYSE Arca filed a 19b-4 application for spot Dogecoin (DOGE) ETF.
1Shares has filed an application for a spot Polkadot (DOT) ETF with the SEC.
New applications such as the Trump ETF and the BONK ETF were also on the agenda.
DeepSeek Overtakes OpenAI in GitHub Star Count
DeepSeek’s popular project DeepSeek-V3 has reached 77,700 stars on GitHub, surpassing OpenAI’s most popular project. This achievement demonstrates DeepSeek’s growing influence in the open source community.
SEC Reviews Proposal to Allow Physical Redemptions in BlackRock’s Spot Bitcoin ETF
The SEC is considering BlackRock’s proposal to modify its spot Bitcoin ETF to allow physical redemptions. The comment period will last 21 days after publication in the Federal Register.
Japan Asks Apple and Google to Suspend Five Unregistered Crypto Apps
The Japan Financial Services Agency has requested the removal of Bybit, MEXC, LBank, KuCoin and Bitget’s apps from the App Store and Google Play.
Kentucky Proposes Investing 10% of State Funds in Digital Assets
A bill introduced in Kentucky would invest 10% of state funds in digital assets with a market capitalization exceeding $750 billion.
BlackRock Increases Its Stake in Strategy to 5%
BlackRock increased its stake in Strategy (former MicroStrategy) to 5%. Following this news, STRK shares rose 5% pre-market.
Ondo Finance Launches Ondo Chain for Asset Tokenization
Ondo Finance has launched a permissioned Layer-1 blockchain called Ondo Chain, which aims to bridge the gap between traditional finance and DeFi.
HIGHLIGHTS OF THE DAY
Important Economic Calender Data
| Time | News | Expectation | Previous |
|---|---|---|---|
| 15:00 | US Michigan Consumer Sentiment (Feb) | 71.9 | 71.1 |
INFORMATION:
*The calendar is based on UTC (Coordinated Universal Time) time zone. The economic calendar content on the relevant page is obtained from reliable news and data providers. The news in the economic calendar content, the date and time of the announcement of the news, possible changes in the previous, expectations and announced figures are made by the data provider institutions. Darkex cannot be held responsible for possible changes that may arise from similar situations
MARKET COMPASS
Global markets focused on the US employment data for January and although the non-farm payrolls change (NFP) for the first month of the year came in below the forecasts and gave a poor data outlook, we can state that the whole report points to a relatively strengthening labor market. The revised figures for the previous months also suggest a tightening in the labor market in late 2024. After the release of the report, we saw that the dollar appreciated and bond yields rose as the first effect. However, contrary to this perception, we saw a revival in digital assets. The agenda of the recent news flow regarding ETF approvals may have formed the basis for this divergence.
European stock markets are trading slightly on the negative side, while Wall Street futures point to a mixed opening. In the rest of the day, we think that digital assets will struggle to maintain the recent upward trend.
From the short term to the big picture.
Trump’s victory on November 5, one of the main pillars of our bullish expectation for the long-term outlook in digital assets, produced a result in line with our predictions. In the process that followed, the appointments made by the president-elect and the increasing regulatory expectations for the crypto ecosystem in the US, as well as the emergence of BTC as a reserve, continued to take place in our equation as positive variables. Then, 4 days after the new President took over the White House, he signed the “Cryptocurrency Working Unit” decree, which was among his election promises, and we think that the positive reflection of the outputs it will produce in the coming days on digital assets may continue.
On the other hand, the expectations that the FED will continue its interest rate cut cycle, albeit on hiatus for now, and the fact that the volume in crypto-asset ETFs indicates an increase in institutional investor interest, support our upside forecast for the big picture. In the short term, given the nature of the market and pricing behavior, we think it would not be surprising to see occasional pause or pullbacks in digital assets. However, at this point, it is worth underlining again that we think the fundamental dynamics continue to be bullish.
TECHNICAL ANALYSIS
BTC/USD
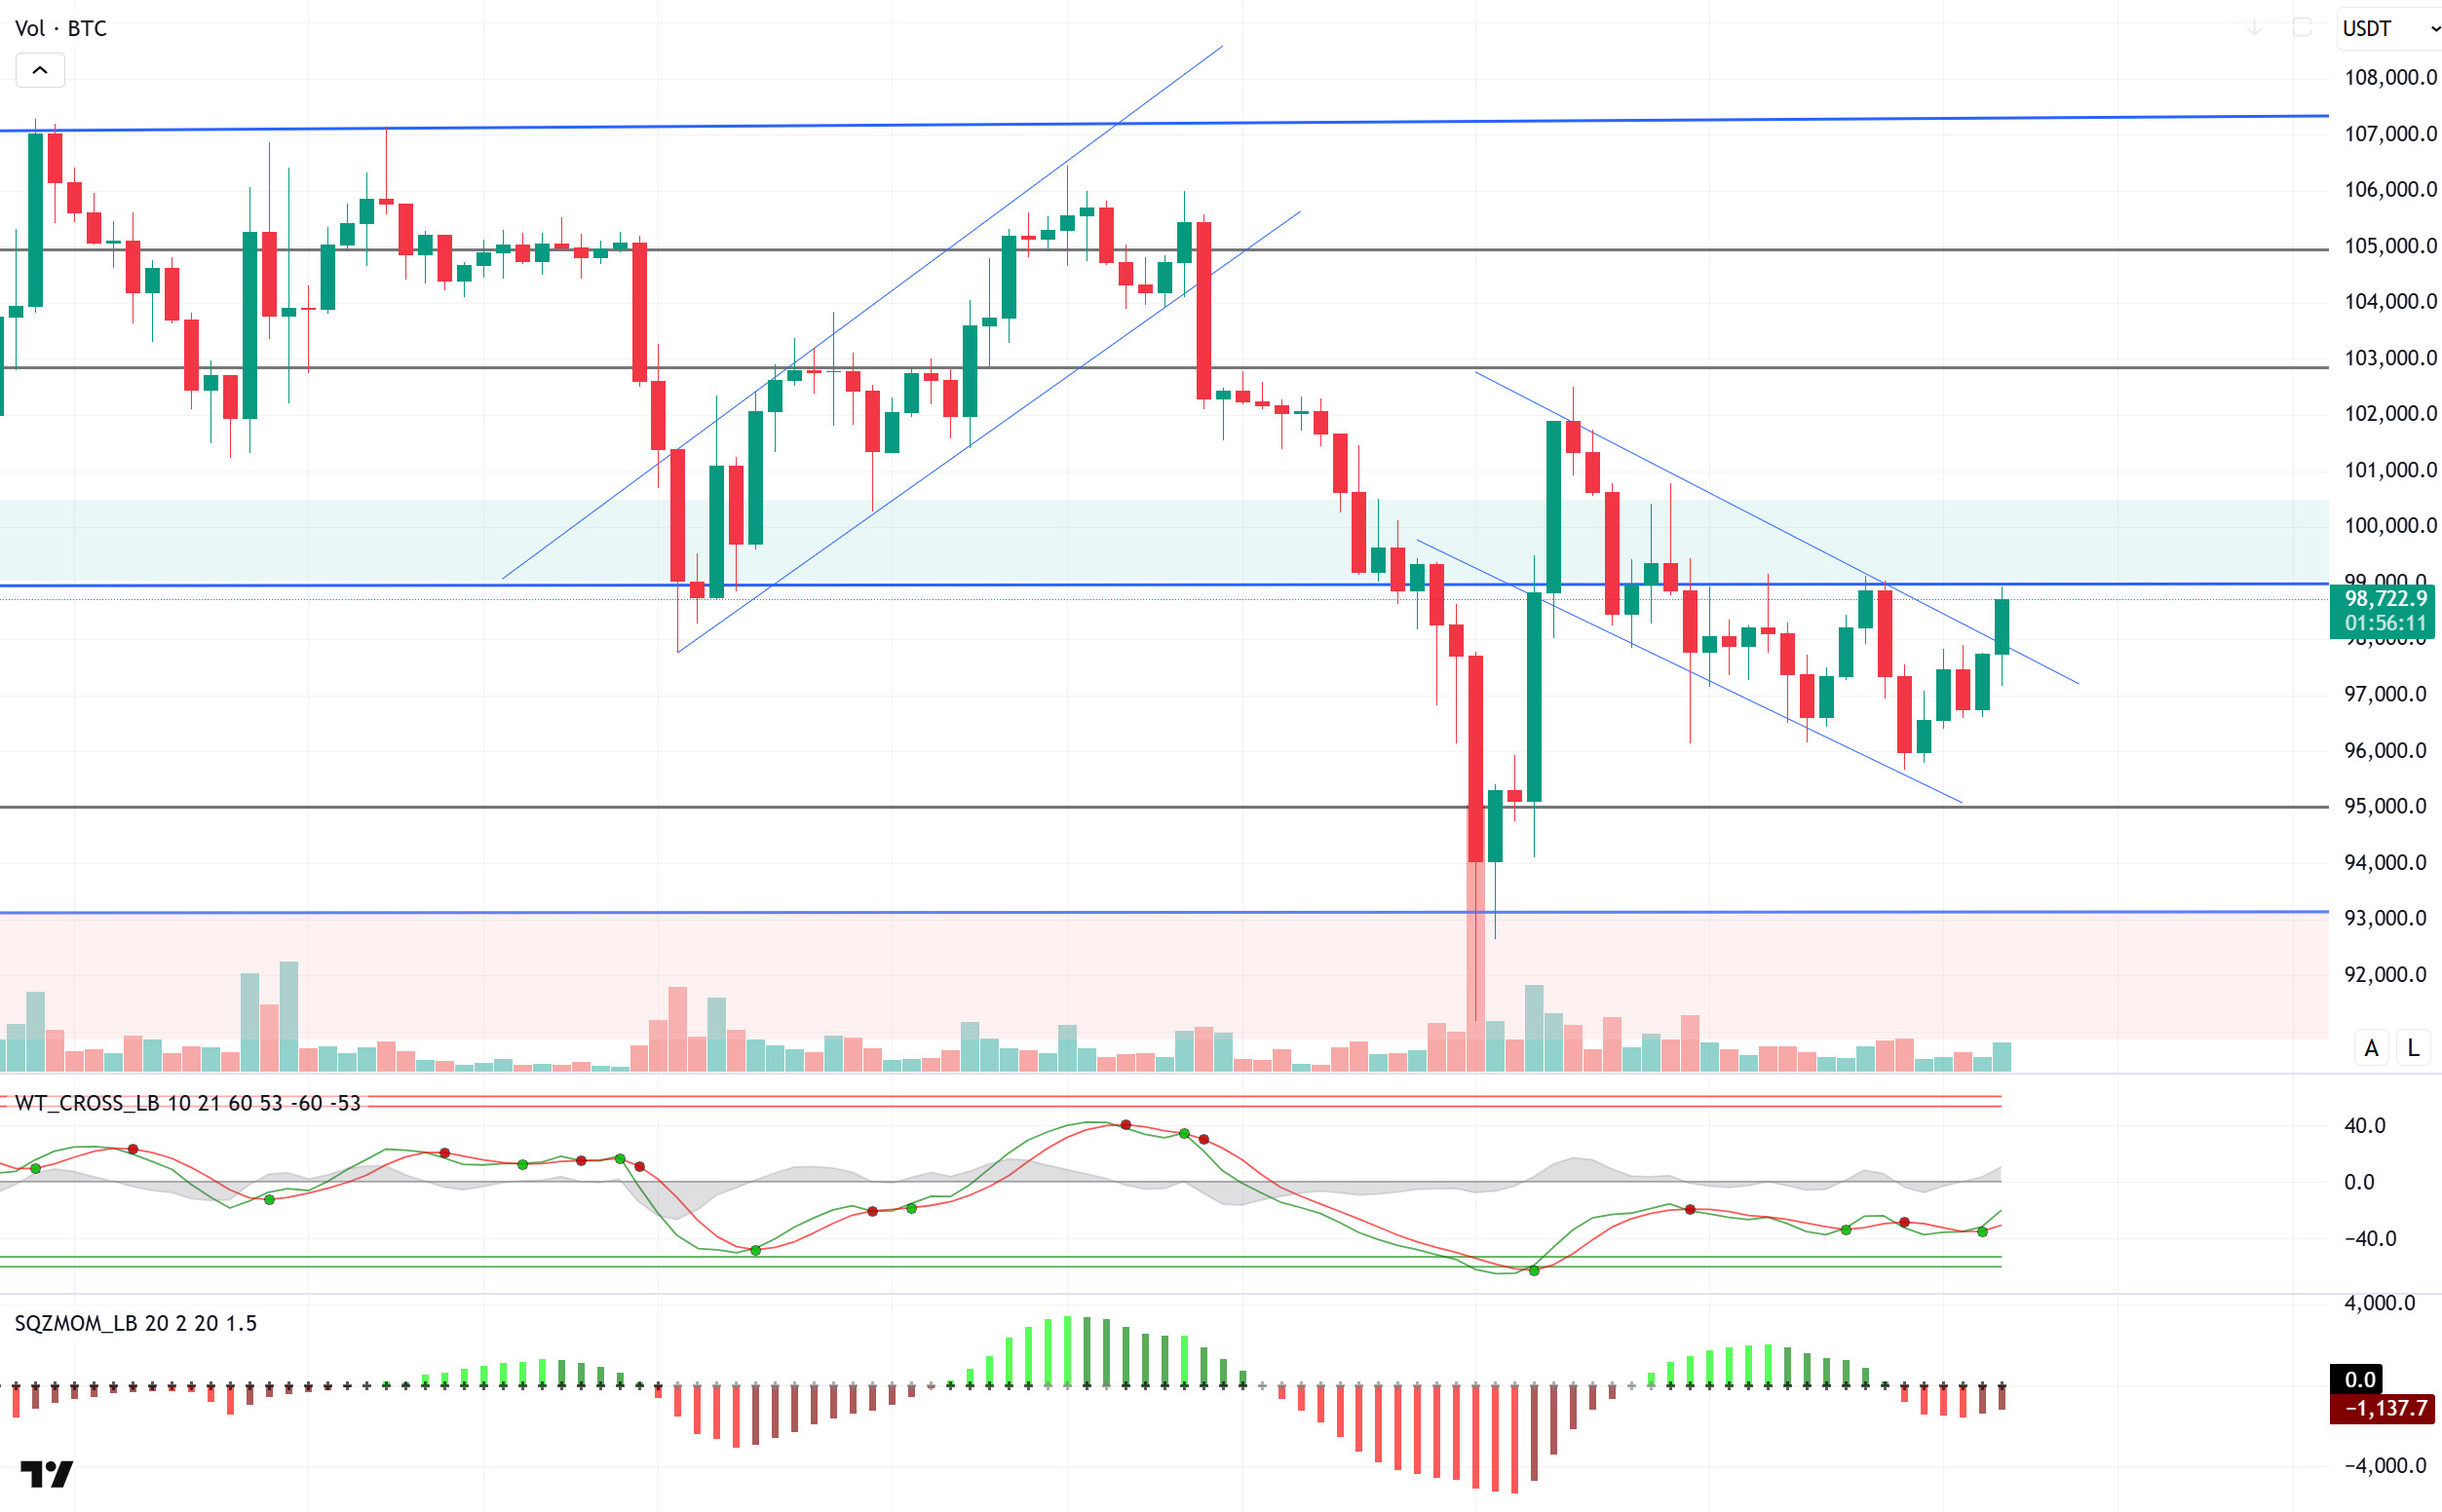
Nonfarm payrolls, one of the critical macro data in the US, came in below expectations with 143K, while the unemployment rate was realized as 4.0%, slightly below expectations. The lower-than-expected non-farm payrolls suggest that hiring slowed down and there was some cooling in the labor market.
Looking at the technical outlook, BTC moved within the falling trend channel before the macroeconomic data, but after the data flow, it broke this trend channel and headed towards the 91,100 resistance level again. Currently trading at 98,800, technical oscillators continue to generate buy signals near the overbought zone. Moreover, the momentum indicator has the potential to regain strength later in the day. If the uptrend continues, closes above 91,100 will be critical. If this level is exceeded, a move towards the 101,800 resistance point can be expected as the next target. On the other hand, in a possible pullback scenario, whether the upper line of the broken falling trend channel will work as support will be followed as an important indicator.
Supports 95,000 – 92,800 – 92,800
Resistances 99,100 – 98,000 – 101,400
ETH/USDT
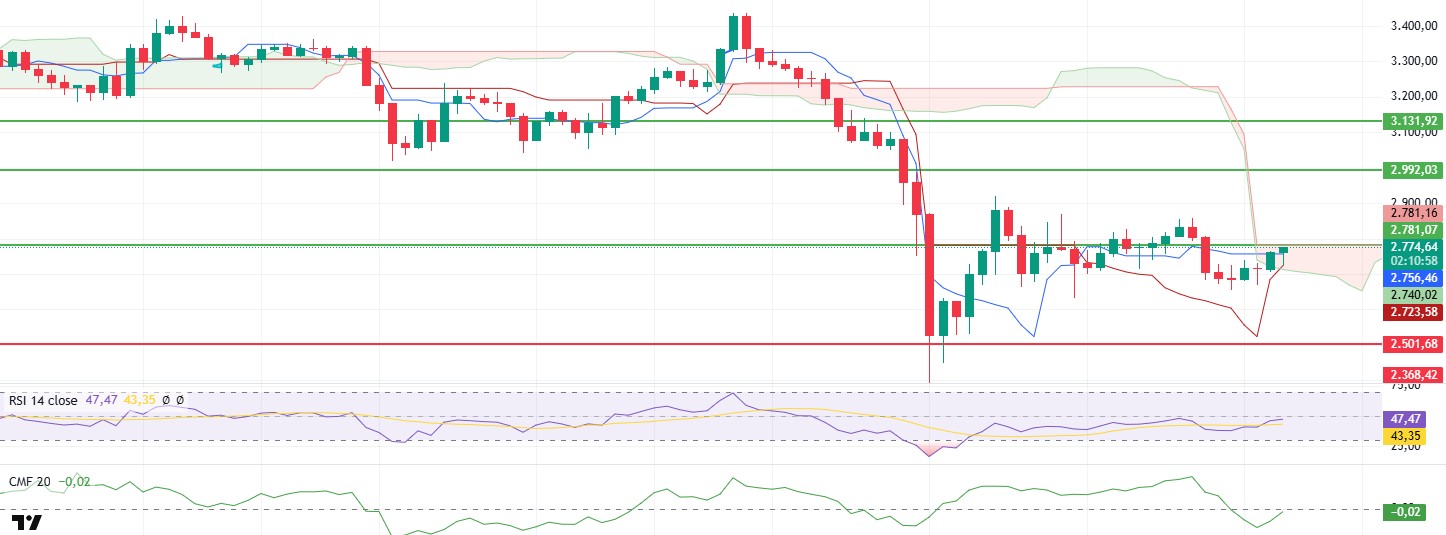
ETH managed to rise as high as $3,770 during the day. However, after the US non-farm employment data was announced, it entered a fluctuating price movement by exhibiting high volatility. ETH, which entered the Ichimoku Kumo Cloud with the effect of the rise seen in the morning hours, gained a more positive technical outlook with this situation. However, there are some technical indicators to be considered at this point.
In particular, the upward movement of the kijun level, while the tenkan level, one of the components of the Ichimoku indicator, remained stable, may signal a potential bearish signal. This creates a contradictory outlook for market participants. However, the notable rise in the Chaikin Money Flow (CMF) indicator suggests that liquidity entering the market is increasing. If CMF moves back into positive territory, it could be an important signal that buying appetite is strengthening.
In line with the current technical data, exceeding the $2,781 level during the day can be considered as an important breakpoint. If the price manages to break this level on the upside, the probability of seeing a bullish move on volume will increase. However, if there is a sharp rejection from this zone, the market may come under strong selling pressure again and the price may experience deep declines.
Supports 2,501 – 2,368 – 2,114
Resistances 2,781 – 2,992 – 3,131
XRP/USDT
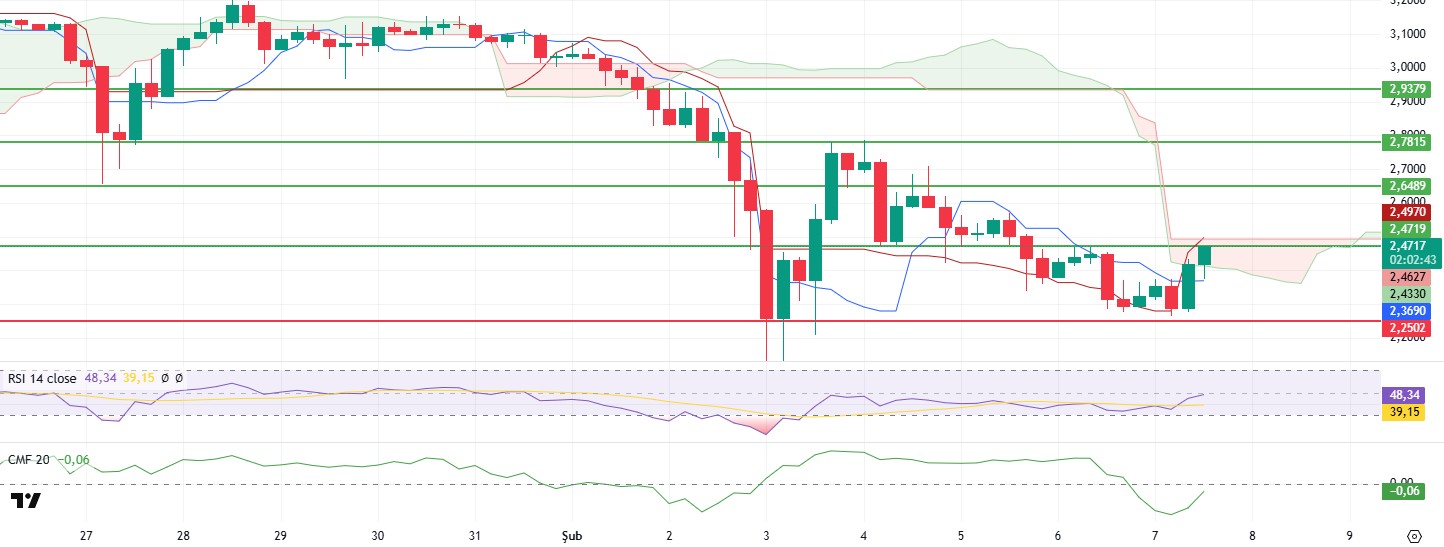
With the strong support it found from the $2.25 levels during the day, XRP managed to reach the $2.47 level, rising again. Price movements in this critical resistance zone can be decisive for the formation of a larger-scale trend going forward. In particular, the reaction of the price at this level is of great importance in terms of determining the short-term direction.
An analysis of technical indicators reveals that the sharp upward reversals observed in the Chaikin Money Flow (CMF) and Relative Strength Index (RSI) indicators suggest that XRP is regaining buyer dominance and momentum is strengthening. This supports the growing interest of market participants and the potential for the price to test higher levels. At the same time, XRP’s re-entry into the Ichimoku Kumo Cloud and gaining the Tenkan Sen level can be considered a very positive technical development. If this momentum continues, it seems quite possible that rises up to the upper limit of the Kumo Cloud to the level of $ 2.50.
In line with the general market structure and technical data, it stands out as a critical threshold for XRP to maintain above the $2.47 level in order to maintain its current positive outlook. If the price manages to hold above this level and exceeds the $2.50 level, a new uptrend may begin and higher resistance levels may be targeted. However, a rejection from the $2.47 level or the upper limit of the Kumo Cloud at the $2.50 level may cause the price to face selling pressure again and retreat to the $2.25 level.
Supports 2.2502 – 2.0201 – 1.6309
Resistances 2.4719 – 2.6489 – 2.7815
SOL/USDT
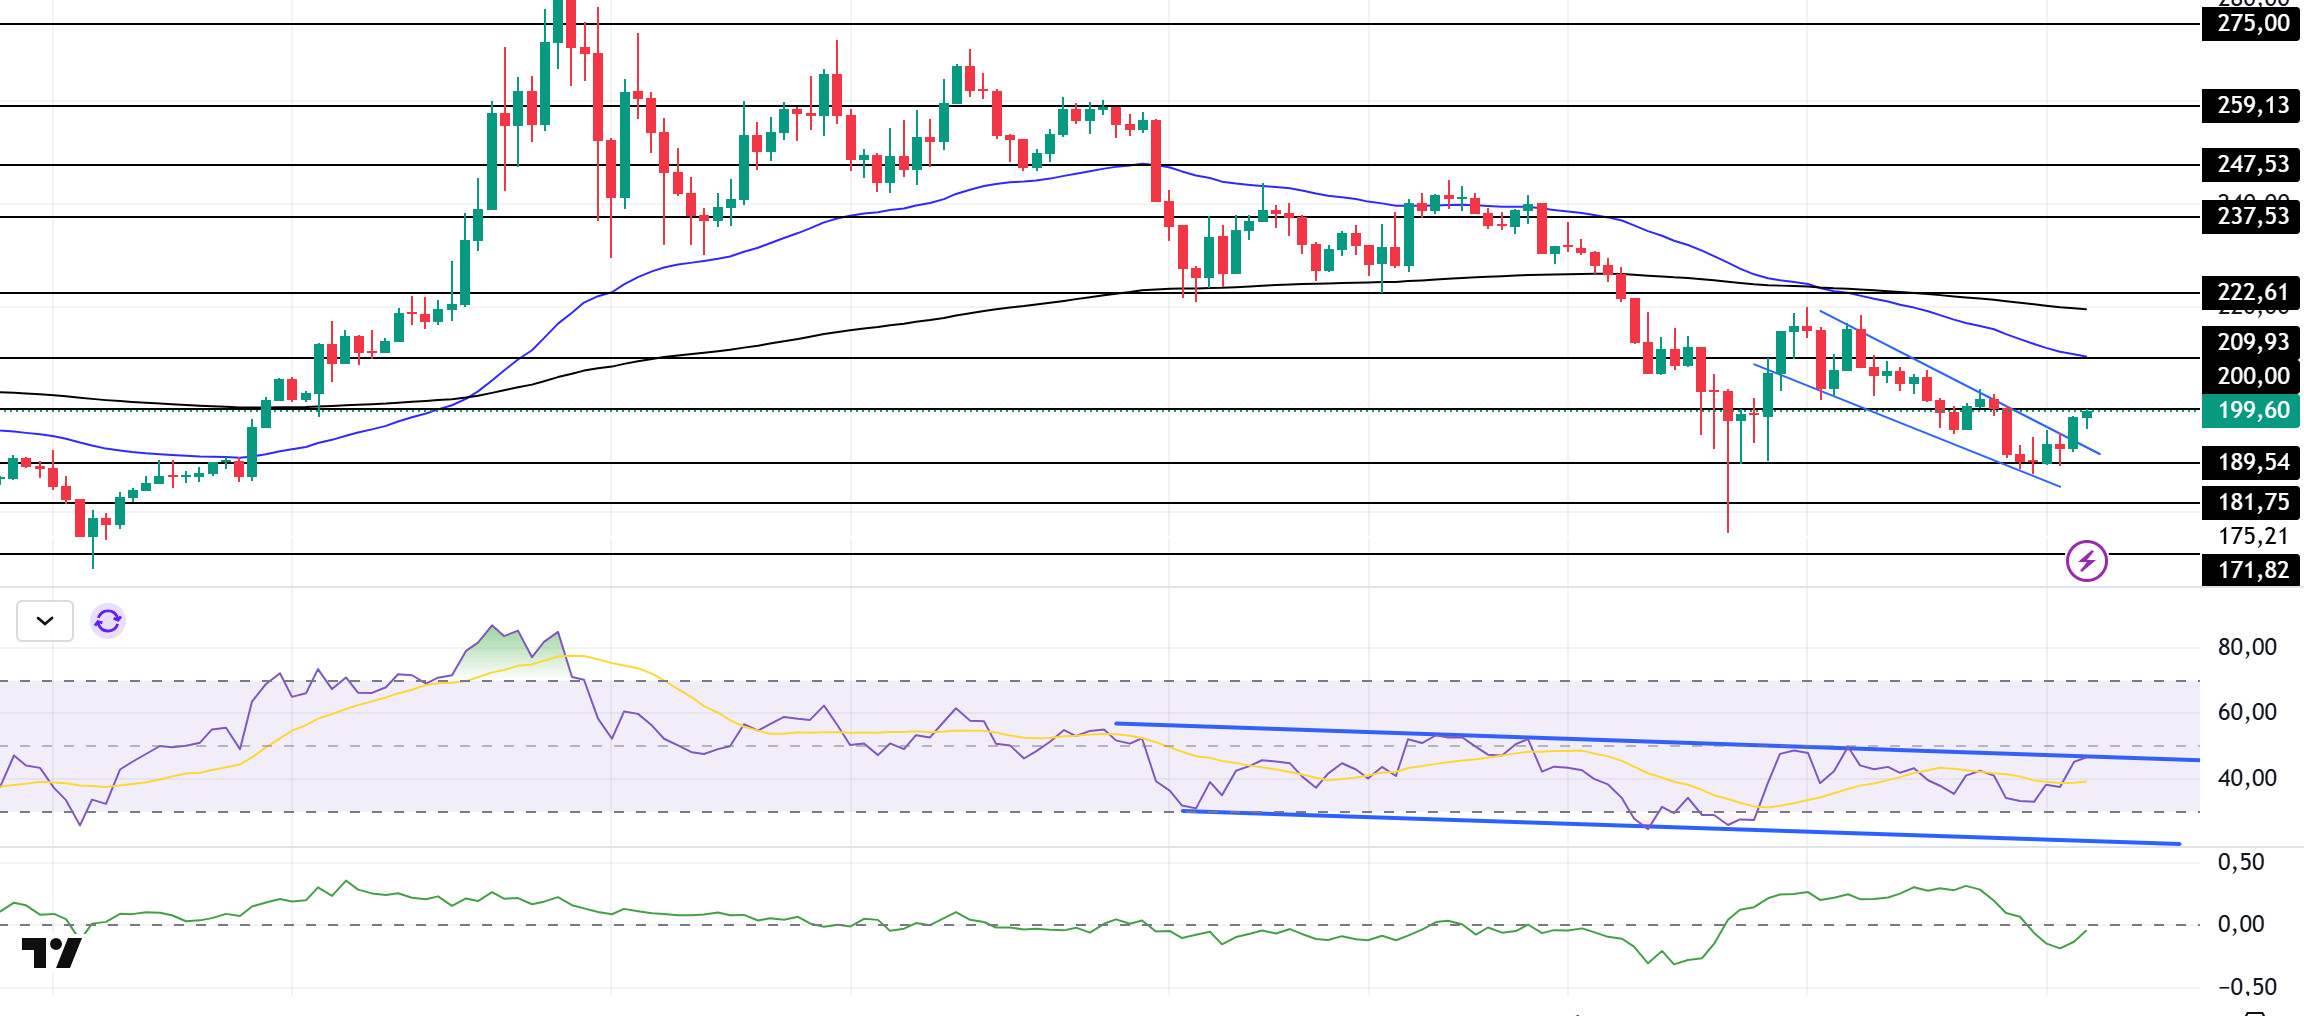
On the 4-hour timeframe, the 50 EMA (Blue Line) continues to be below the 200 EMA (Black Line). This could deepen the decline in the medium term. At the same time, the asset is priced below the 50 EMA and 200 EMA. On February 3, the descending wedge pattern that started to form has broken to the upside. The Chaikin Money Flow (CMF)20 indicator is in negative territory, but money outflows have started to decline. However, the Relative Strength Index (RSI)14 indicator is at the mid-level of the negative zone and the price is currently testing the ceiling level of the downtrend that started on January 19. If it breaks here, the price may rise. The 237.53 level is a very strong resistance point in the uptrend driven by both the upcoming macroeconomic data and the news in the Solana ecosystem. If it breaks here, the rise may continue. In case of retracements for the opposite reasons or due to profit sales, the 181.75 support level can be triggered again. If the price reaches these support levels, a potential bullish opportunity may arise if momentum increases.
Supports 189.54 – 181.75 – 171.82
Resistances 200.00 – 209.93 – 222.61
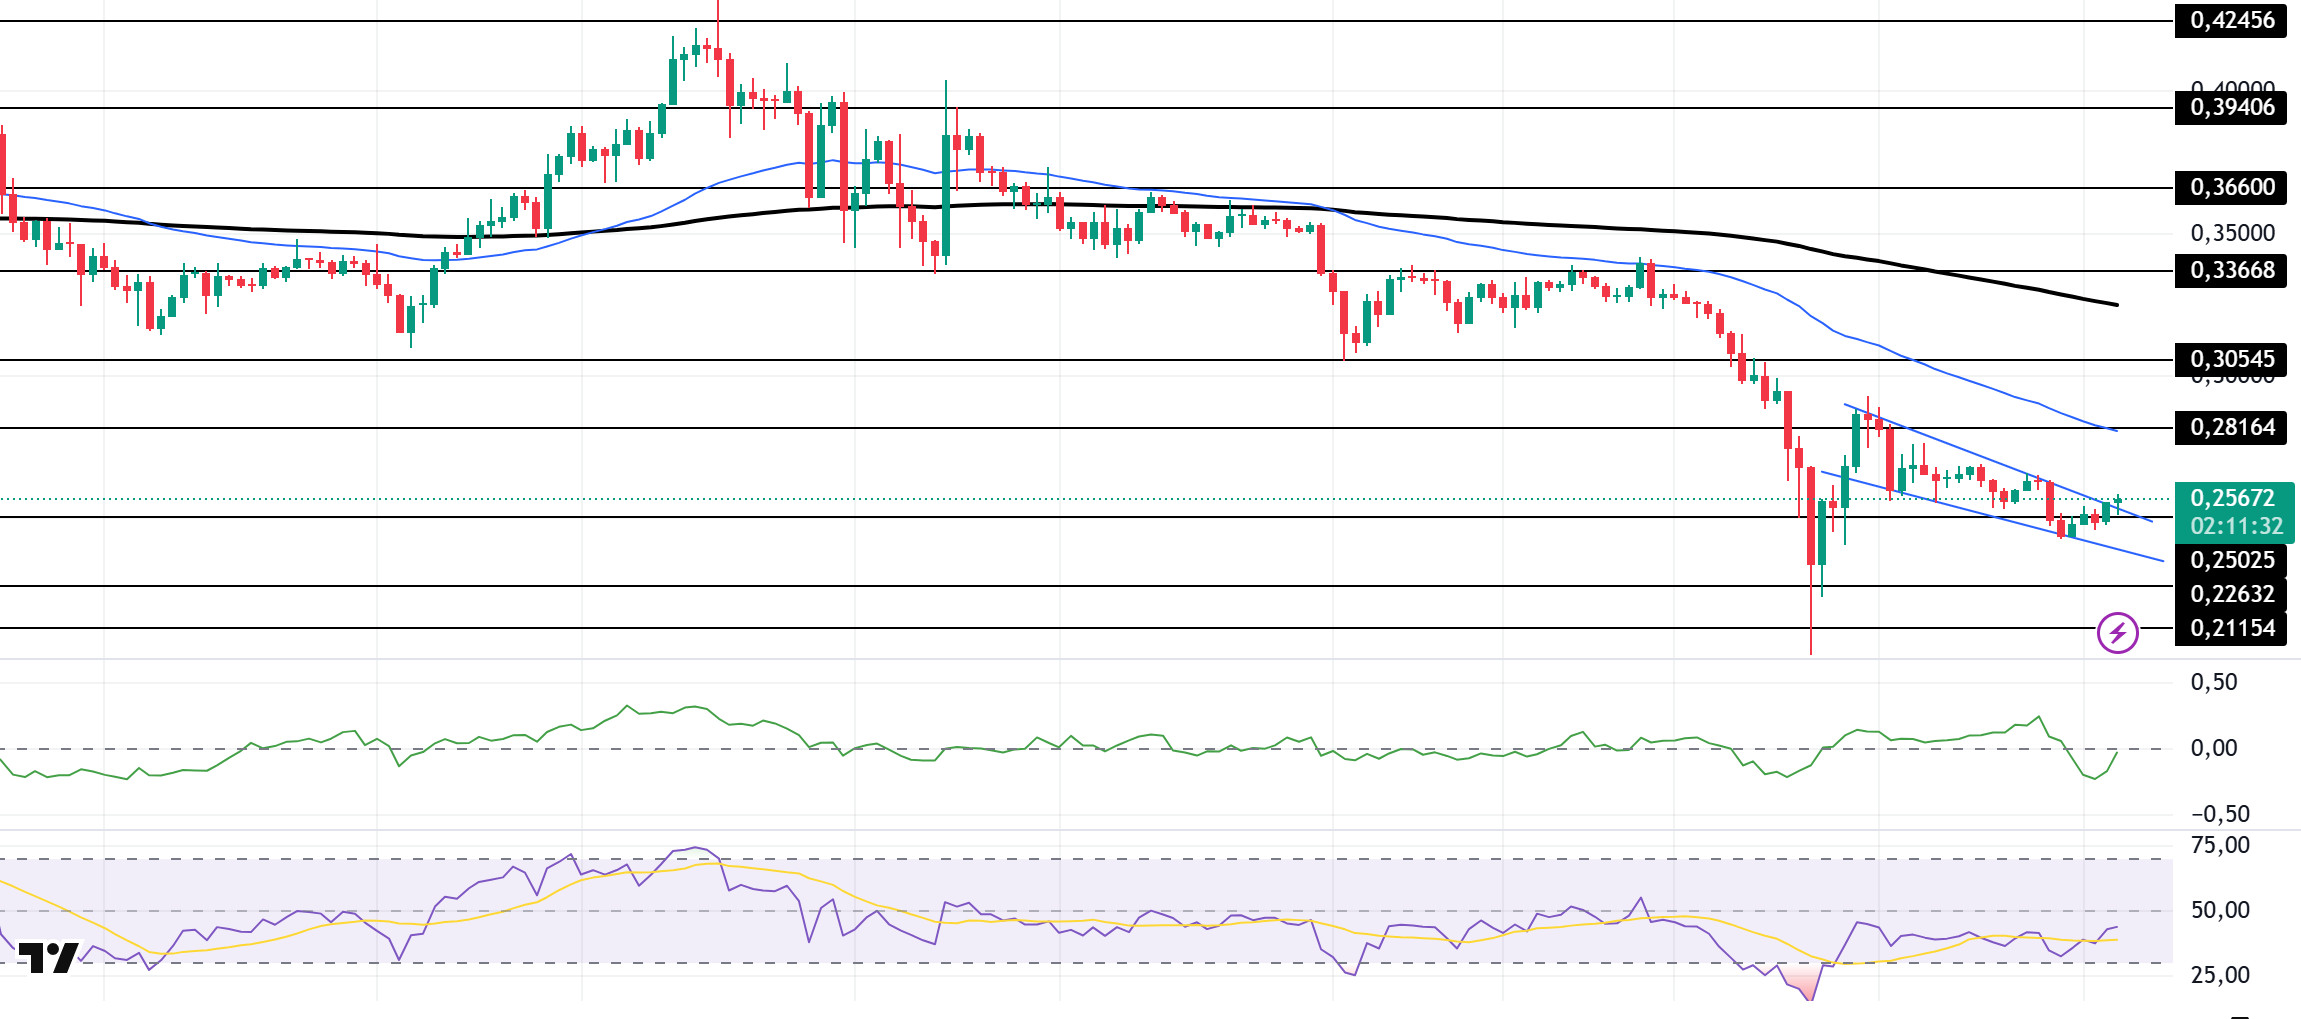
DOGE/USDT
Since our analysis in the morning, the price has been slightly bullish. On the 4-hour timeframe, the 50 EMA (Blue Line) remained below the 200 EMA (Black Line). This could mean that the decline could deepen further in the medium term. At the same time, the price is below the 50 EMA (Blue Line) and the 200 EMA (Black Line). However, the large gap between the two moving averages may increase the probability of the DOGE rising. The descending wedge pattern should be followed. When we analyze the Chaikin Money Flow (CMF)20 indicator, it is in the negative zone and money outflows started to decrease. At the same time, Relative Strength Index (RSI)14 is at the middle level of the negative zone. The 0.33668 level stands out as a very strong resistance point in the rises due to political reasons, macroeconomic data and innovations in the DOGE coin. In case of possible pullbacks due to political, macroeconomic reasons or negativities in the ecosystem, the 0.22632 level, which is the base level of the trend, is an important support. If the price reaches these support levels, a potential bullish opportunity may arise if momentum increases.
Supports 0.25025 – 0.22632 – 0.21154
Resistances 0.28164 – 0.30545 – 0.33668
LEGAL NOTICE
The investment information, comments and recommendations contained herein do not constitute investment advice. Investment advisory services are provided individually by authorized institutions taking into account the risk and return preferences of individuals. The comments and recommendations contained herein are of a general nature. These recommendations may not be suitable for your financial situation and risk and return preferences. Therefore, making an investment decision based solely on the information contained herein may not produce results in line with your expectations.

