MARKET SUMMARY
Latest Situation in Crypto Assets
| Assets | Last Price | Change (%) Weekly | Change (%) Monthly | Change (%) Since the Beginning of the Year | Market Cap. |
|---|---|---|---|---|---|
| BTC | 97,357.37$ | -7.37% | 1.62% | 3.07% | 1,93 T |
| ETH | 2,735.39$ | -15.69% | -18.81% | -18.30% | 330,22 B |
| XRP | 2.352$ | -23.41% | 1.00% | 1.20% | 135,75 B |
| SOLANA | 195.28$ | -16.87% | -1.24% | 0.88% | 95,39 B |
| DOGE | 0.2523$ | -22.87% | -28.07% | -22.17% | 37,34 B |
| CARDANO | 0.7266$ | -23.59% | -27.15% | -20.84% | 25,56 B |
| TRX | 0.2285$ | -10.16% | -8.68% | -10.44% | 19,69 B |
| LINK | 19.10$ | -23.39% | -8.89% | -11.85% | 12,19 B |
| AVAX | 25.19$ | -27.22% | -34.82% | -33.16% | 10,38 B |
| SHIB | 0.00001512$ | -18.80% | -30.33% | -30.07% | 8,92 B |
| DOT | 4.661$ | -25.10% | -32.80% | -33.56% | 7,22 B |
*Table was prepared on 2.7.2025 at 11:30 (UTC). Weekly values are calculated for 7 days based on Friday.
Fear & Greed Index
Source: Alternative
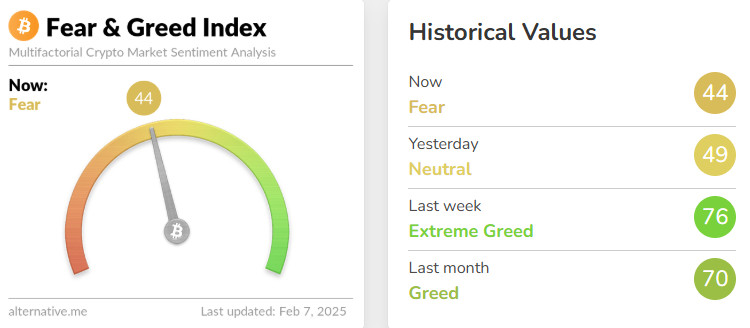
Change in Fear and Greed Value: -32
Last Week Level: 76
This Week’s Level: 44
This week, the Fear and Greed Index fell sharply by 32 points to 44. Trump’s tariffs on Canada, Mexico and China increased uncertainty in the markets and reduced risk appetite. Trump’s announcement that similar tariffs would be imposed on the European Union, but did not specify a date, further deepened the uncertainty. China’s retaliatory tariffs on some products imported from the US and the launch of an antitrust investigation against Google also increased tensions in global markets.
Against this backdrop, risk aversion strengthened and cryptocurrencies came under selling pressure. Despite positive developments such as the passage of Bitcoin investment legislation in Utah by the House of Representatives and the SEC’s consideration of some crypto ETF applications, overall market conditions weakened investor confidence. The sharp decline in the index reflects the growing uncertainty in the markets and the strengthening risk aversion.
Fund Flow
Source: CoinShares
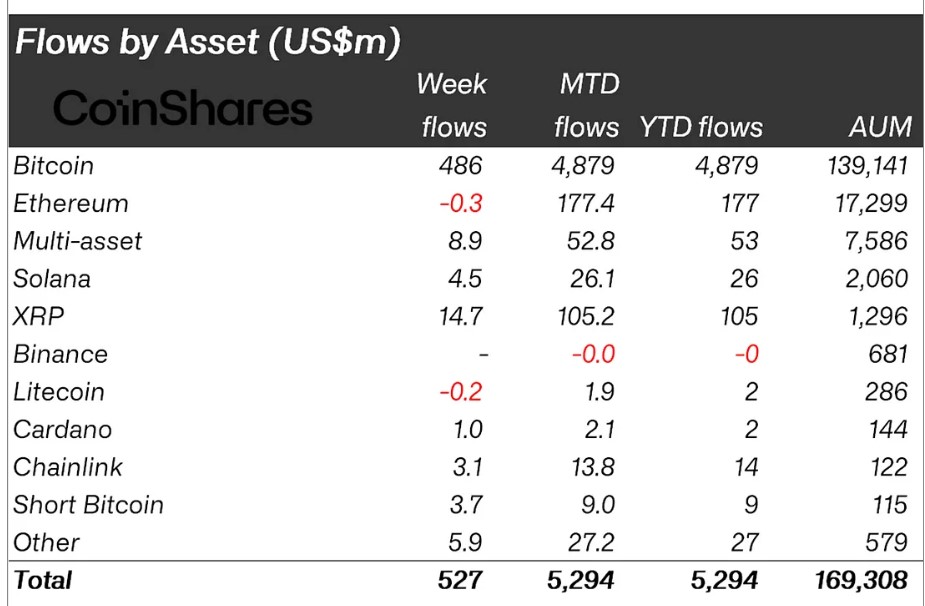
Overview: Digital asset investment products saw total inflows of $527 million this week
Fund Inputs.
- Bitcoin (BTC): $486 million in inflows.
- Ripple (XRP): $7 million logins.
- Solana (SOL): $5 million was login.
- Cardano (ADA): $1.0 million saw inflows.
- Other: $5.9 million inflows seen.
Fund Outflows; Short Bitcoin positions reached 3.7 million dollars.
- Ethereum (ETH): – saw an outflow of $0.30 million
Litecoin (LTC): – Saw an outflow of $0.2 million.
Assessment: The DeepSeek news and the tariff announcements led to digital assets seeing less than 500 million inflows compared to last week. Despite this sell-off, the market recovered later in the week with over $1 billion in inflows. Among altcoins, the biggest inflows were in Ripple, which is currently the 2nd best-performing altcoin with an inflow of $14.7 million this week, an increase of $105 million in 1 month
Total MarketCap

Source: Tradingview
Last Week Market Capitalization: 3.19 trillion Dollars
Market Capitalization This Week: 3.13 trillion Dollars
Last week, the crypto market suffered a total net loss of $56.70 billion, leading to a 1.78% decline. The total market capitalization, which stood at $3.19 trillion at the beginning of the week, rose to $3.13 trillion after falling as low as $2.81 trillion. If a negative close occurs on Sunday, it will be the second consecutive negative weekly close in terms of total market capitalization, which could be the beginning of a negative trend.
Total 2
A net outflow of $48.85 billion was recorded this week, resulting in a decline of 3.91%. Compared to the total, the altcoin market experienced a steeper decline. About 86% of the total net amount exiting the market came in the form of outflows from altcoins, which account for 40% of the total market capitalization.
Total 3
Looking at the Total 3 index, it is seen that there was an outflow of $32.47 billion, resulting in a decline of 3.59%. About 33% of this outflow in the altcoin market was caused by Ethereum, while the rest was caused by other altcoins.
In general, it is possible to say that a negative week was left behind in the crypto market. It is noteworthy that there is more pressure especially on altcoins.
Bitcoin Dominance
Source: Tradingview
Bitcoin Dominance
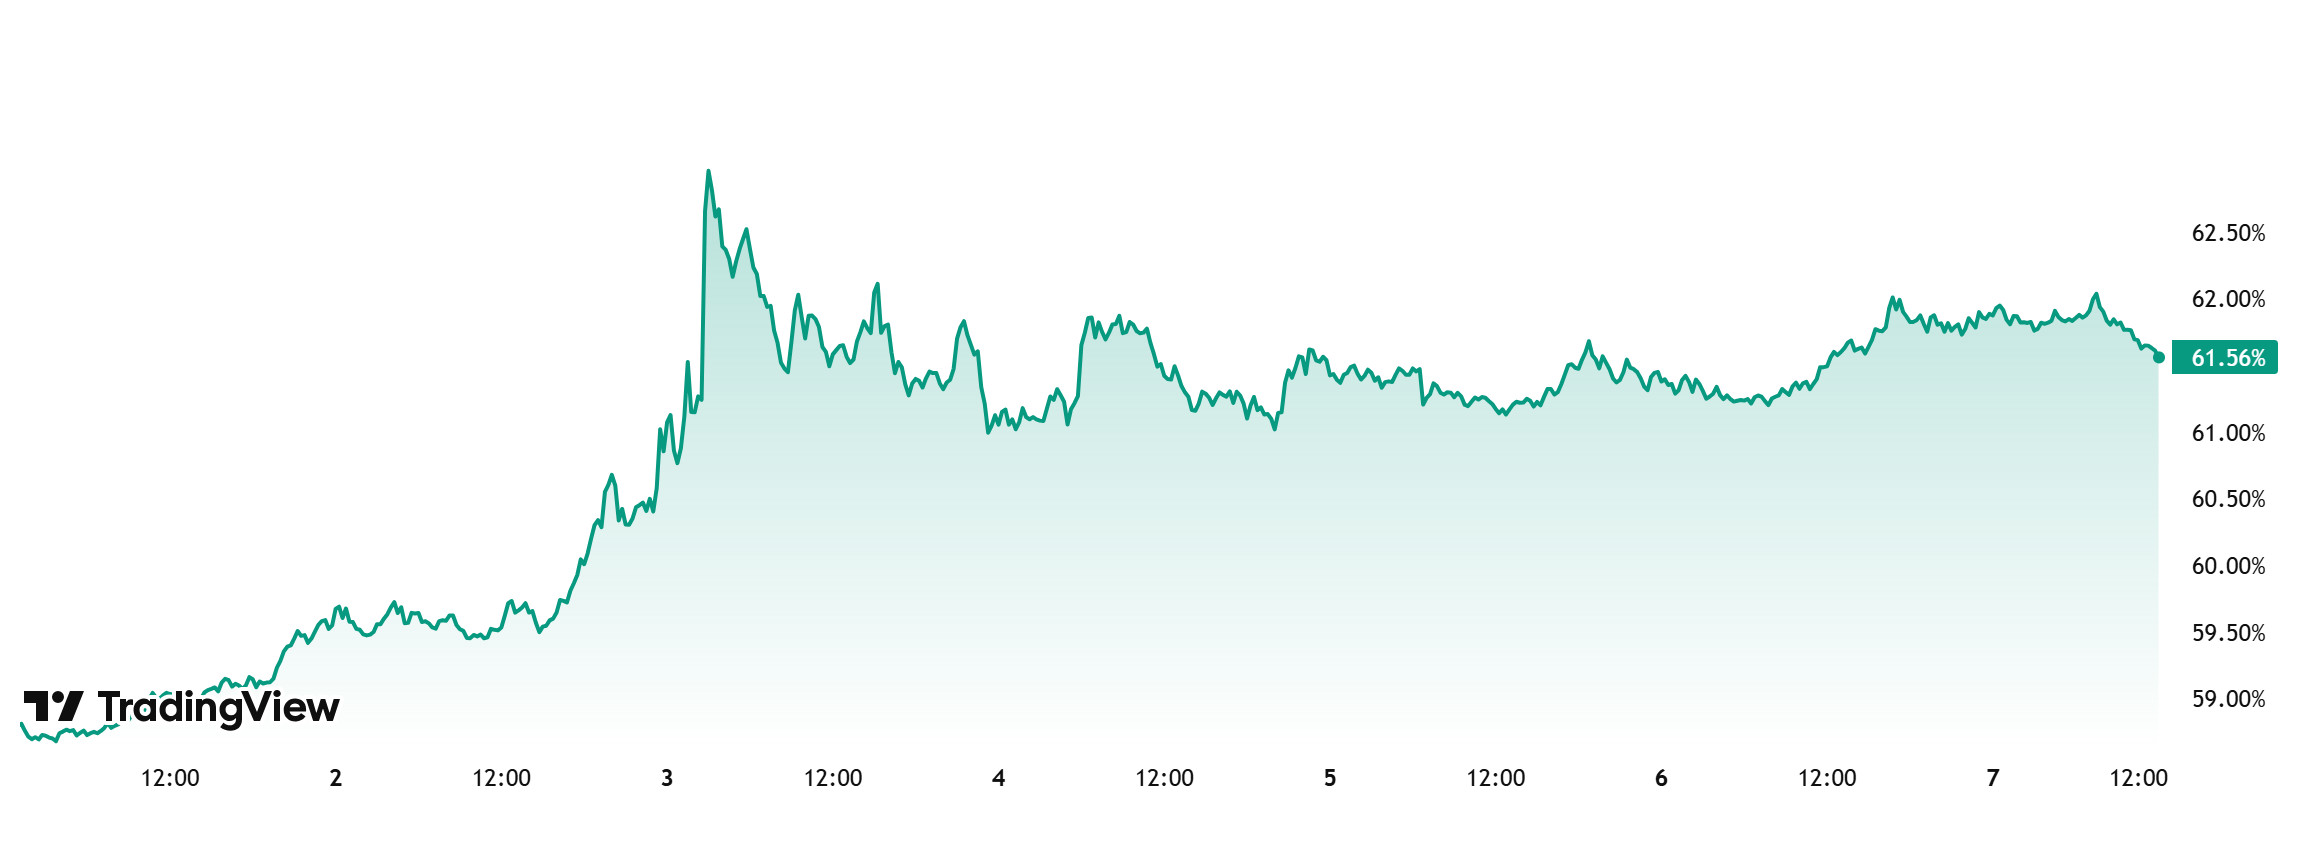
BTC dominance, which started the week at 60.76%, continued to rise throughout the week and is currently at 61.56%.
In the US, consumer price index, applications for unemployment benefits and producer price index unemployment rate data will be announced next week. Especially if the consumer price index is announced below expectations, it may be welcomed positively by the markets. At the same time, the US President Trump’s positive negotiations on tariffs and the cancellation or easing of these tariffs are positive for the markets and may greatly increase the interest of institutional and ETF investors.
If all these positive scenarios materialize, we can expect BTC dominance to rise to 62% – 63% in the new week.
Ethereum Dominance

Source: Tradingview
Weekly Change:
- Last Week’s Level: 10.86%
- This Week’s Level: 10.56%
Ethereum dominance continued its retreat for the fifth week in a row, starting at 12.90% in early January 2025. The negative trend that remained in effect during this period caused the dominance to fall to 9.23%, a level last seen in May 2020. However, it has recovered somewhat from this point and reached 10.56% as of the current week.
On the other hand, there has been a reversal in Bitcoin dominance over the last five weeks, with positive trends emerging on a weekly basis.
Accordingly, Ethereum dominance ended last week at 10.86% and is hovering at 10.56% as of the current week.
Bitcoin Spot ETF

Source: SosoValue
Featured Developments:
- Net Inflows: Between January 31 and February 06, 2025, Spot Bitcoin ETFs saw a total net inflow of $351.1 million. During this period, BlackRock IBIT ETF stood out with a net inflow of $657.2 million. Fidelity FBTC ETF attracted attention with a net outflow of $270.2 million.
- Bitcoin Price: Opening at $104,676 on January 31, 2025, Bitcoin closed at $96,515 on February 06, 2025, down 7.80% between January 31 and February 06, 2025. Bitcoin fell as low as $91,130 on February 03.
- Cumulative Net Inflows: Spot Bitcoin ETFs saw a total net inflow of $351.1 million between January 31 and February 06, 2025, while cumulative net inflows reached $40.53 billion at the end of the 269th trading day.
| DATE | COIN | PRICE | ETF Flow (mil$) | ||
|---|---|---|---|---|---|
| Open | Close | Change % | |||
| 31-Jan-25 | BTC | 104,676 | 102,379 | -2.19% | 318.6 |
| 03-Feb-25 | 97,664 | 101,293 | 3.72% | -234.4 | |
| 04-Feb-25 | 101,293 | 97,709 | -3.54% | 340.7 | |
| 05-Feb-25 | 97,709 | 96,553 | -1.18% | 66.4 | |
| 06-Feb-25 | 96,553 | 96,515 | -0.04% | -140.2 | |
| Total for 31 Jan – 06 Feb 25 | -7.80% | 351.1 | |||
General Evaluation:
Between January 31 and February 06, 2025, Bitcoin price declined by 7.80%, while Bitcoin ETFs were positive in terms of total net inflows during this period. BlackRock and Ark ETFs were the main source of large inflows, while Fidelity and Grayscale ETFs saw significant outflows. Despite the decline in Bitcoin price during this period, net inflows to Bitcoin ETFs continued on a daily basis, indicating that investor interest in ETFs continued. In the short term, fluctuations in the Bitcoin price have been associated with US President Donald Trump’s posts and the sanctions announced by the US against some countries. However, the continued investor interest in Bitcoin ETFs has increased the possibility of the price rising in the long term.
Ethereum Spot ETF

Source: SosoValue
Between January 31 and February 6, 2025, Spot Ethereum ETFs saw a total net inflow of $448 million. During this period, the positive net inflow streak in Spot Ethereum ETFs reached 6 days. In particular, the net inflow of $ 276.2 million to the BlackRock ETHA ETF on February 4 attracted attention. At the end of 137 trading days, total net inflows in Spot Ethereum ETFs reached $3.18 billion. In this process, Ethereum opened at $3,245 on January 31, 2025 and closed at $2,685 on February 6. Between January 31 and February 6, 2025, the Ethereum price fell by 17.26%. On February 3, Ethereum, which was affected by the sharp decline in the crypto market , recovered after falling below $ 2,100.
| DATE | COIN | PRICE | ETF Flow (mil$) | ||
|---|---|---|---|---|---|
| Open | Close | Change % | |||
| 31-Jan-25 | ETH | 3,245 | 3,212 | -1.02% | 27.8 |
| 03-Feb-25 | 2,868 | 2,878 | 0.35% | 83.6 | |
| 04-Feb-25 | 2,878 | 2,730 | -5.14% | 307.8 | |
| 05-Feb-25 | 2,730 | 2,787 | 2.09% | 18.1 | |
| 06-Feb-25 | 2,787 | 2,685 | -3.66% | 10.7 | |
| Total for 31 Jan – 06 Feb 25 | -17.26% | 448.0 | |||
The sharp decline in the crypto market following the US economic decisions also affected Ethereum. Between January 31 and February 6, 2025, Ethereum lost a total of 17.26%, while Spot Ethereum ETFs continued their streak of positive net inflows, indicating that investor interest remains intact. While short-term price volatility and market-wide uncertainties shape price movements, continued interest in Spot Ethereum ETFs could support the price’s upside in the long term.
Bitcoin Options Breakdown
Source: Laevitas
Deribit Data: About 26,000 BTC options contracts with a notional value of approximately $2.54 billion expire today, Deribit data showed. The BTC options market recorded a surge in trading activity during the sell-off. Bitcoin options appear to be on the rise, according to a report by Block Scholes. Options saw similar activity levels between late December 2024 and early January 2025. However, recent data shows more buying activity. Open interest data has also largely favored call options. Spot selling earlier this week caused traders to refrain from putting call options for a short period. “Short-term options are trading with lower volatility and neutral skew, while longer-term volatility smiles are trading with rising volatility expectations and a persistent bullish bias towards OTM calls,” the additional report said. Meanwhile, the Bitcoin options market recorded the highest single-day trading volume for calls this month, reaching $250 million during the spot price drop. Since then, however, volatility has continued to fall, both realized and implied.
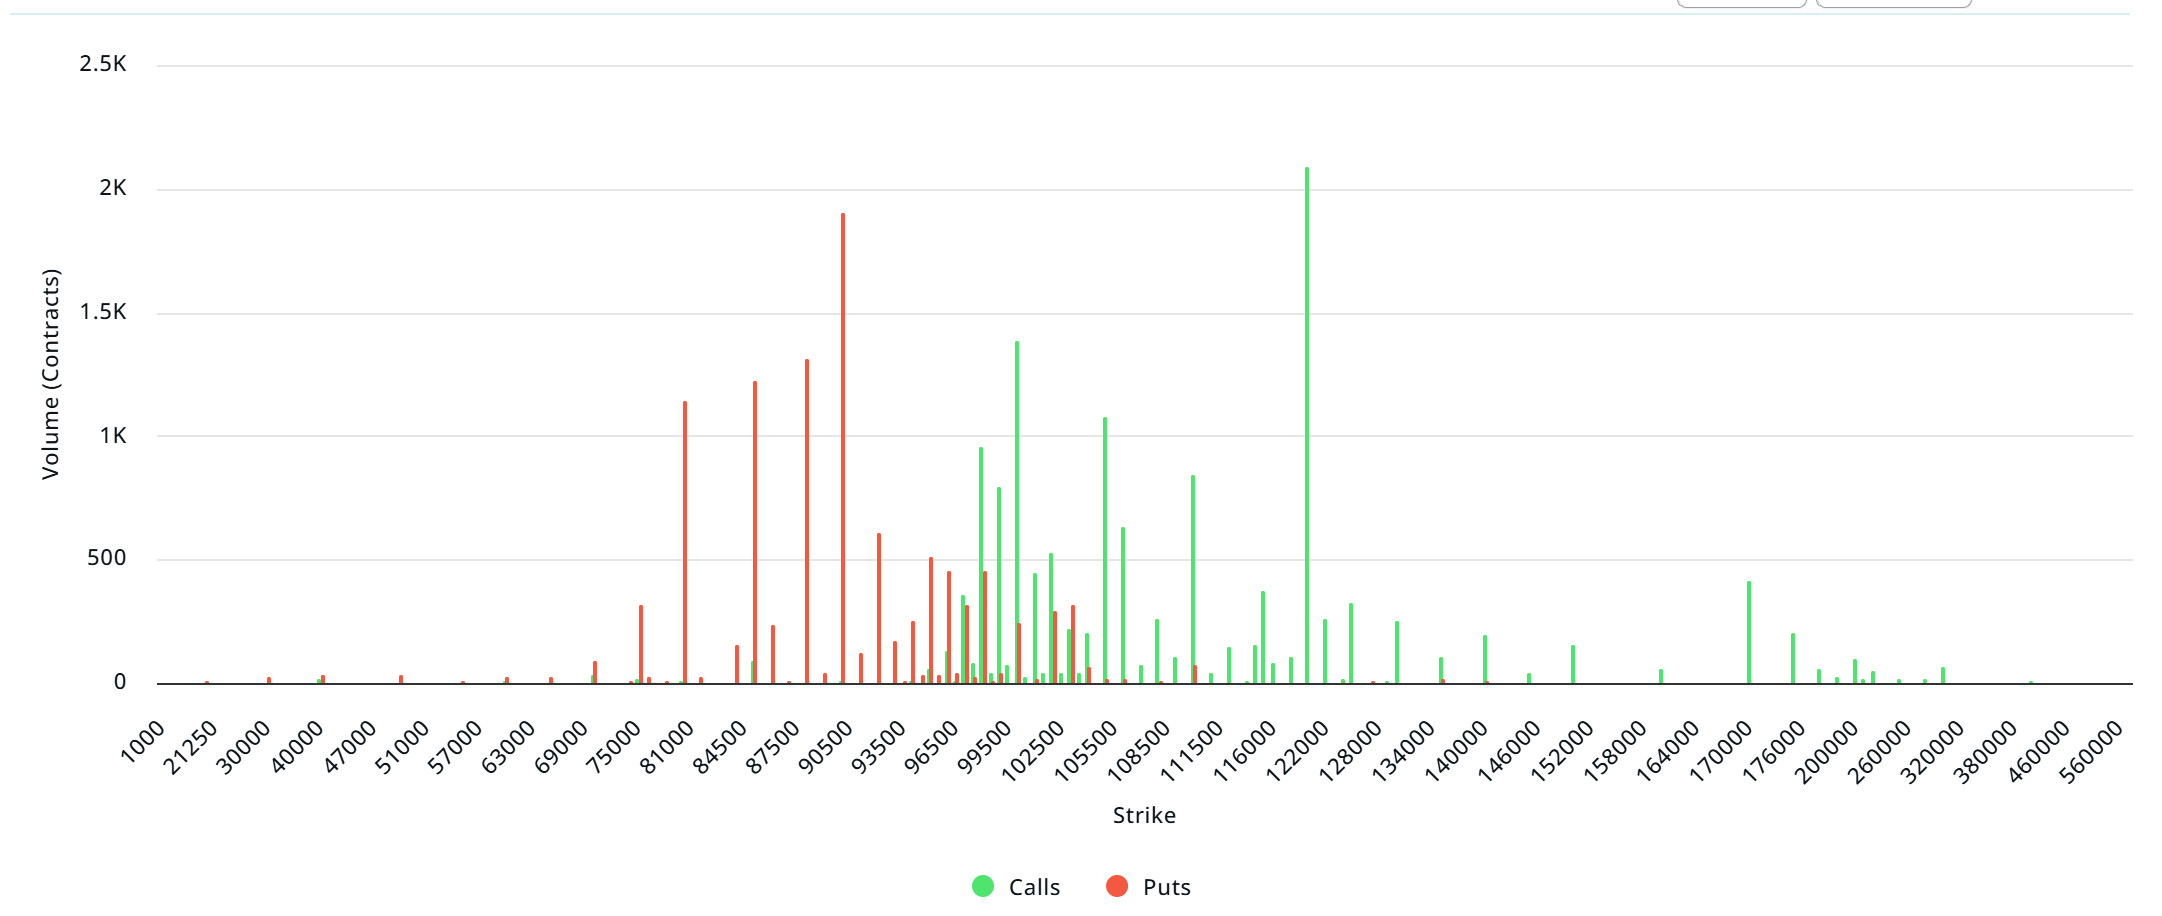
Laevitas Data: Bitcoin options volatility has been on the decline since Monday’s risk-off event. When we examine the chart, we see that put options are concentrated in the 80,000 – 98,500 level band. Call options are concentrated between 98,000 – 108,000 levels and the concentration decreases towards the upper levels. At the same time, resistance has formed in the band of approximately 95,000 – 98,000 dollars. On the other hand, there are 2.05K call options at the $120,000 level, where there is a peak and a sharp decline in volume after this level.
Option Expiration
Put/Call Ratio and Maximum Pain Point: In the last 7 days of data from Laevitas, the number of call options increased by about 45% compared to last week to 119.99K. In contrast, the number of put options was 69.03K, up 20% from last week. The put/call ratio for options was set at 0.63. A put/call ratio of 0.63 indicates that there is a strong preference for calls over puts among investors and a possible uptrend in the markets. Bitcoin’s maximum pain point is set at $99,500. In the next 7 days, there are 7.92K call and 6.04K put options at the time of writing.
Ethereum Options Distribution
Source: Laevitas
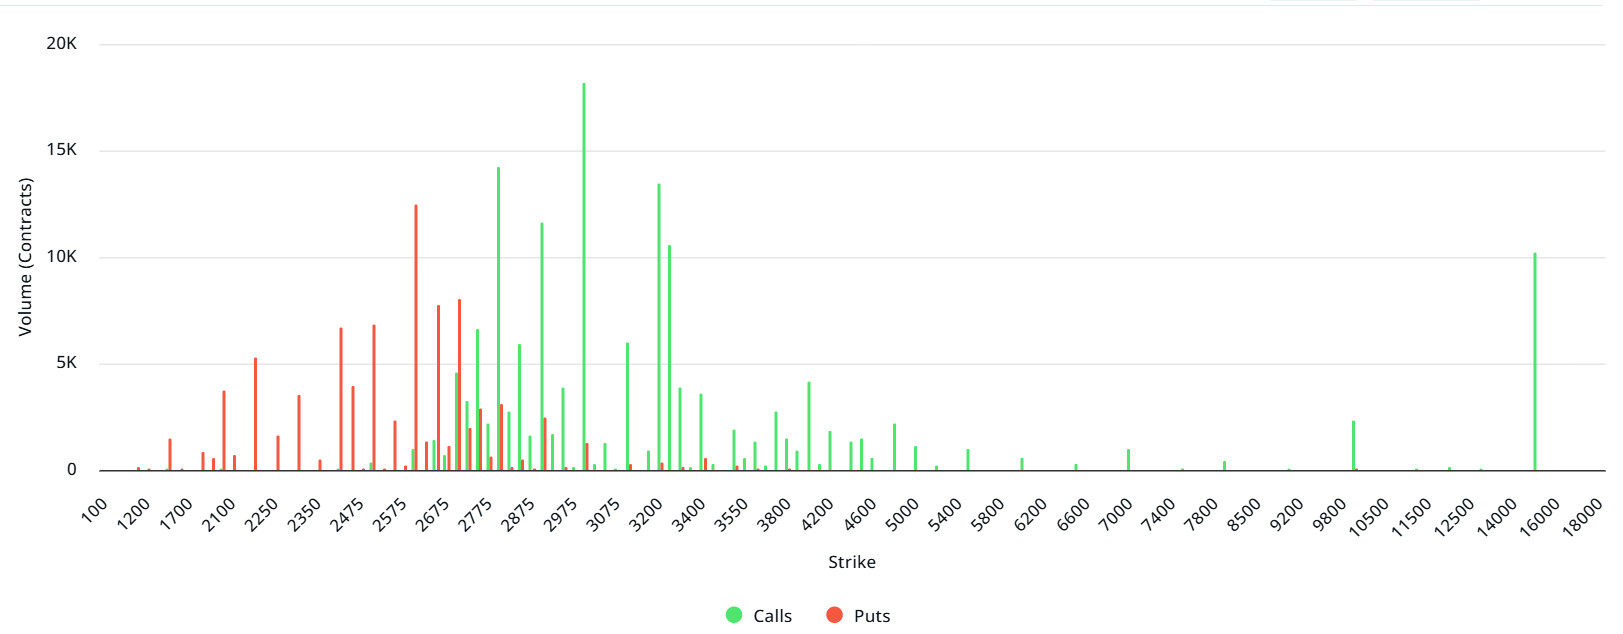
Laevitas Data: Looking at the chart, it is clear that Call options are more concentrated than Put options. There is a significant volume of Call options, especially at the $3,200-3,300 levels, suggesting that these levels could be an important resistance point for the market. The $2,575 and $2,675 ranges, where Put options are concentrated, may stand out as support levels in the market. At higher strike prices, especially at $16,000, there is a noticeable concentration of Call options, but it should be noted that this volume may be speculative.
Deribit Data: Ethereum options with a notional value of $47.85 million expire on February 8.
Maximum Pain Point: $2,750.
Put/Call Ratio: 0.57. This shows that investors in the market are in a strong position to expect the price to rise.
WHAT’S LEFT BEHIND
- Trump’s Tariffs sent Bitcoin down 7% and Ethereum down 25%.
- Trump signed an executive order to establish a sovereign wealth fund.
- Trump Media Group has filed a trademark application for “Truth.Fi Bitcoin Plus ETF”.
- The Trump Family’s Crypto Project WLFI plans to create a strategic token reserve.
- Trump’s Stablecoin Plans aim to attract regulation and investment to the US.
- The SEC has started considering ETF applications for XRP, Litecoin and Solana.
- The SEC is reviewing BlackRock’s proposal to allow physical redemptions in its spot Bitcoin ETF.
- MicroStrategy changed its name to “Strategy”.
- The Government of Bhutan transferred 751.31 BTC, amounting to $74.15 million.
- The Czech President has approved a law granting tax exemption for holding Bitcoin for three years.
- South Korea’s Bitcoin “Kimchi Premium” reached a 10-month high of 9.7%.
- Hong Kong granted crypto licenses to PantherTrade and YAX, allowing them to trade Bitcoin, Ether, LINK and AVAX.
- Bitcoin, USDT and Artificial Intelligence Partnership in El Salvador: Tether and Lightning Labs integrated USDT into the Lightning Network.
- The Ethereum Pectra Upgrade will be tested on the Holesky and Sepolia test networks.
- CZ: “Europe Needs Bitcoin”, ECB will not include Bitcoin in reserves.
- Tether has integrated USDT into the Bitcoin Lightning Network, providing speed and scalability.
- Vitalik Buterin revealed that his Bitcoin holdings account for less than 10% of his portfolio.
- Purpose Investments has applied for the world’s first XRP spot ETF.
- LayerZero finalized a $150 million settlement with FTX, ending the legal process.
- The probability of Bitcoin dropping to $75,000 is 22% (Derive.xyz data).
- Bitwise expects $59 billion of inflows into Bitcoin spot ETFs by the end of 2025.
- Utah could become the first US state planning to establish a Bitcoin reserve.
- Raydium overtook Uniswap to become the largest DEX with a 27% market share.
- US Core PCE Price Index was realized as 2.8%, in line with expectations.
- US ADP Non-Farm Payrolls were announced as 183K, above the expectation of 148K.
- Ohio Senator introduces Bitcoin reserve bill.
- USDC Treasury minted 68.9 million USDC on the Ethereum network.
MARKET COMPASS
This is a difficult time for digital asset investors to manage. Outside of fundamental metrics and other analysis, we are seeing a relatively more news-sensitive pricing behavior, and this is not making it easier to manage the assets in the portfolio. With the new US President Trump’s tariffs and foreign policy on the one hand, and the rise of China’s DeepSeek on the other, 2025 will not be such an easy year. In addition, the US Federal Reserve’s (FED) recent Federal Open Market Committee (FOMC) decision to end its cycle of interest rate cuts also led to a recalibration of expectations regarding the tightness of financial conditions and a further shift of capital. We believe that we are in for a week where macro dynamics will start to have a little more impact on the direction of prices and in this context, we detail the important data from the US and FED Chairman Powell’s speech below.
Eyes on Inflation After Employment Data
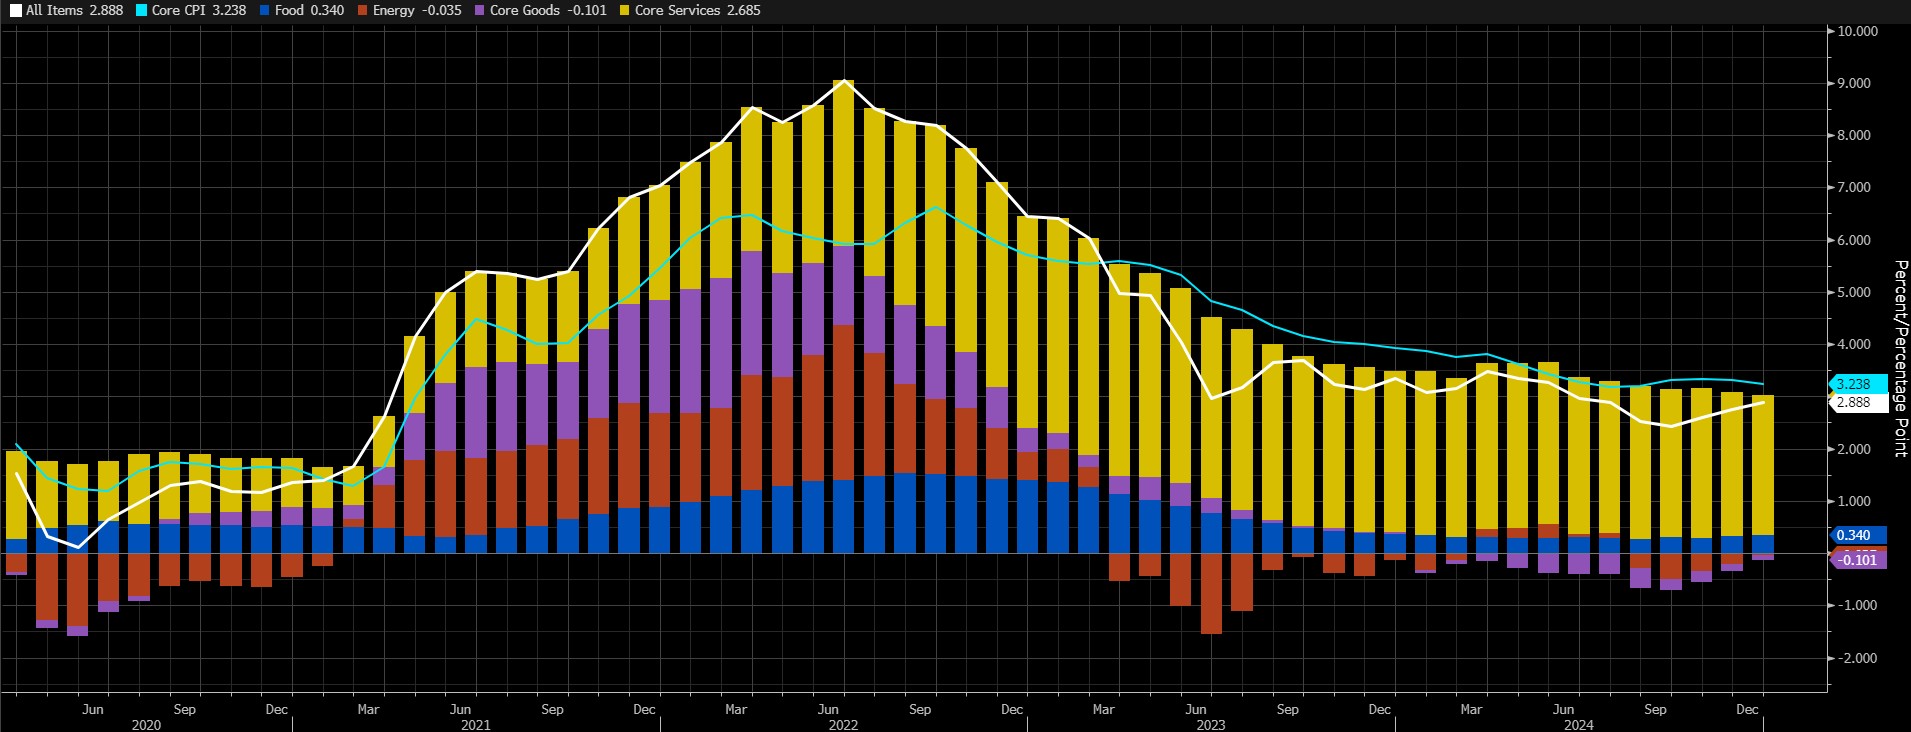
We received the first critical macro indicators of January on Friday with the US employment data. In the new week, the focus of the markets will shift to the Consumer Price Index (CPI) as well as Powell’s speech. In December, monthly CPI rose by 0.4% and core CPI by 0.2%, bringing annual headline inflation to 2.9% (November: 2.7%).
Source: Bloomberg
Inflation in the US is no longer falling as it was from June 2022 to early 2024. The change in the Consumer Price Index is more stable. This may also be due to the fact that the cycle in which the FED cut interest rates has come to an end. The importance of the inflation data lies in the fact that it may give clues as to how far the FED may cut interest rates in 2025.
A higher-than-expected CPI data set may strengthen expectations that the FED may extend the process of postponing interest rate cuts, leading to an appreciation of the dollar, a decrease in risk appetite and, consequently, a depreciation of cryptocurrencies. Also, if we see CPI data that is not as high as feared and below expectations, this could have the opposite effect. In such a scenario, digital assets could find a basis for a rally.
Powell’s Defenses
FED Chair Powell will make two defense appearances next week. The first will be on Tuesday in Washington DC before the Senate Banking Committee on the Semiannual Monetary Policy Report. The other will be the following day, to the House of Representatives Financial Services Committee, and as usual, the text of the speech will remain unchanged.
Markets will be looking for clues from the Fed’s top official about the timing and path of the Bank’s rate cuts in 2025. The Chairman’s test against questions from the members of the relevant Committees about the tight labor market and the recent rise in inflation will be as important this time as it is twice a year.
We do not expect Powell to provide any major new information on the rate cut path, but he may feel the need to update his rhetoric in the wake of recent macro indicators. Accordingly, if the chairman hints at a relatively faster or earlier-than-priced rate cut (25 basis points in June, according to CME FedWatch), there could be an opportunity for a rally in digital assets. In the opposite scenario, cryptocurrencies could come under pressure. Our expectation is that we will not see a major change of stance, as we have underlined before, but the surprise could be a stronger speech that there will be no rush to cut rates.
DARKEX RESEARCH DEPARTMENT CURRENT STUDIES
Onchain Weekly Report – February 5
Trump’s Alleged America First Strategic Crypto Reserve Plan
Scott Bessent’s Economic Policies and Impact on the Crypto Market
Silk Road and the Fate of Bitcoins Seized by the US Government
Market and Digital Economy Impacts of Tether’s Relocation to El Salvador
Regulations and the Future of Privacy Coins
The Digital Asset Funds Revolution: Crypto ETFs
Inflation and Cryptocurrency: Observations and Forecasts in 2025
The Most Important Airdrop Projects Expected in 2025
Click here for all our other Market Pulse reports.
IMPORTANT ECONOMIC CALENDAR DATA
Click here to view the weekly Darkex Crypto and Economy Calendar.
INFORMATION
*The calendar is based on UTC (Coordinated Universal Time) time zone.
The calendar content on the relevant page is obtained from reliable data providers. The news in the calendar content, the date and time of the announcement of the news, possible changes in the previous, expectations and announced figures are made by the data provider institutions.
Darkex cannot be held responsible for possible changes arising from similar situations. You can also check the Darkex Calendar page or the economic calendar section in the daily reports for possible changes in the content and timing of data releases.
LEGAL NOTICE
The investment information, comments and recommendations contained in this document do not constitute investment advisory services. Investment advisory services are provided by authorized institutions on a personal basis, taking into account the risk and return preferences of individuals. The comments and recommendations contained in this document are of a general type. These recommendations may not be suitable for your financial situation and risk and return preferences. Therefore, making an investment decision based solely on the information contained in this document may not result in results that are in line with your expectations.


