
MARKET SUMMARY
Latest Situation in Crypto Assets
| Assets | Last Price | 24h Change | Dominance | Market Cap |
|---|---|---|---|---|
| BTC | 96,030.85 | 0.19% | 59.91% | 1.90 T |
| ETH | 2,689.00 | 3.30% | 10.19% | 323.71 B |
| XRP | 2.439 | 1.67% | 4.43% | 140.84 B |
| SOLANA | 193.41 | -0.21% | 2.97% | 94.45 B |
| DOGE | 0.2580 | 2.31% | 1.20% | 38.19 B |
| CARDANO | 0.7740 | 1.94% | 0.86% | 27.21 B |
| SHIB | 0.00001652 | 6.16% | 0.31% | 9.74 B |
| DOT | 5.095 | 6.16% | 0.25% | 7.89 B |
*Prepared on 2.13.2025 at 07:00 (UTC)
WHAT’S LEFT BEHIND
US Government Productivity Department to Announce Details of Cost Cuts
The Elon Musk-led US Department of Government Efficiency (DOGE) has launched its official website doge.gov. The platform details government organizational structure and expenditures, and provides an “Unconstitutionality Index” on the compliance of regulations with the constitution.
Musk’s X reaches $10 million settlement with Trump over lawsuit
X (former Twitter), owned by Elon Musk, has agreed to pay $10 million to settle a lawsuit over the banning of Donald Trump’s account.
Cboe BZX Proposes Staking for 21Shares Ethereum ETF, Awaiting SEC Decision
The Cboe BZX Exchange has submitted a proposal that would allow 21Shares’ Ethereum ETF to participate in staking. According to Bloomberg analyst James Seyffart, this is the first ETF to file a staking application with the SEC. Previously, staking was omitted from the Ethereum ETF applications of large funds such as BlackRock and Fidelity.
Pump.fun 82% Decline in Daily Trading Volume
The daily trading volume of Solana-based meme coin platform Pump.fun fell to $560 million from $3.13 billion, its lowest level since Christmas.
Robinhood’s Crypto Trading Volume Increased 400% to $70 Billion
According to Robinhood’s Q4 report, the platform’s crypto trading volume increased 400% year-on-year to $70 billion. This is well above the total trading volume in the first three quarters of 2024.
BNB overtakes Solana to 5th place in market capitalization
According to Coingecko data, Binance Coin (BNB) surged 23.7% in the last week, surpassing Solana with a market capitalization of $103.5 billion. Thus, BNB became the fifth largest asset in the crypto market.
Metaplanet to be Included in MSCI Japan Index
Metaplanet, listed on the Japanese stock exchange, will be included in the MSCI Japan Index as of February 28, 2025. This development is expected to attract more institutional investors.
Japan Proposes New Regulations for Crypto Exchanges
Japan’s Financial Services Agency (FSA) has proposed legislation that would require crypto exchanges to keep a certain amount of assets within the country. The proposal aims to protect user assets, with lessons learned from the bankruptcy of FTX in 2022.
HIGHLIGHTS OF THE DAY
Important Economic Calender Data
| Time | News | Expectation | Previous |
|---|---|---|---|
| – | Polygon (MATIC): Deribit Delisting | – | – |
| – | AxonDAO Governance Token (AXGT): 122 Million Token Burn | – | – |
| 13:30 | US Core PPI (MoM) (Jan) | 0.3% | 0.0% |
| 13:30 | US PPI (MoM) (Jan) | 0.3% | 0.2% |
| 13:30 | US Initial Jobless Claims | 217K | 219K |
INFORMATION
*The calendar is based on UTC (Coordinated Universal Time) time zone.
The economic calendar content on the relevant page is obtained from reliable news and data providers. The news in the economic calendar content, the date and time of the announcement of the news, possible changes in the previous, expectations and announced figures are made by the data provider institutions. Darkex cannot be held responsible for possible changes that may arise from similar situations.
MARKET COMPASS
In global markets, yesterday’s US inflation data for January, Federal Reserve Chairman Powell’s statements and President Trump’s meeting with Putin stand out as the most influential headlines on prices.
In the US, the Consumer Price Index (CPI) came in above expectations in the first month of the year, reinforcing expectations that the Fed will not be in a hurry to cut rates. According to CME FedWatch, markets have shifted to the September meeting (we have seen pricing for May and June) as the closest rate cut and only one rate cut is expected in 2025. Powell also supported the perception formed by the data, stating that they have more work to do on inflation. In this parallel pricing, we saw that the dollar appreciated yesterday and bond yields rose.
On the other hand, US President Donald Trump announced that he had a phone call with Russian leader Putin and agreed with Russia to start negotiations to end the war in Ukraine. The President also announced that he will meet with Putin in the near future, possibly in Saudi Arabia. This agenda created some optimism in the markets. The rise in the US dollar after the inflation data was replaced by retreats with the said agenda (with the effect of increasing peace hopes in Ukraine and the appreciation of the Euro).
This morning, Asia-Pacific stock markets are generally on the rise. On the Chinese side, the artificial intelligence theme continues to contribute to the positive sentiment. With the Ukraine agenda, European stock markets are expected to start the new day slightly positive-horizontal. Wall Street futures contracts are also pointing to a slightly positive opening after yesterday’s mixed session.
While digital assets are looking for direction with these agenda items, we maintain our expectation that they will be volatile in the short term, difficult to relieve pressure in the medium term and bullish in the long term. Today, US Producer Price Index (PPI) and weekly jobless claims will be closely monitored.
From the short term to the big picture…
Trump’s victory on November 5, one of the main pillars of our bullish expectation for the long-term outlook in digital assets, produced a result in line with our predictions. In the process that followed, the appointments made by the president-elect and the increasing regulatory expectations for the crypto ecosystem in the US, as well as the emergence of BTC as a reserve, continued to take place in our equation as positive variables. Then, 4 days after the new President took over the White House, he signed the “Cryptocurrency Working Unit” decree, which was among his election promises, and we think that the positive reflection of the outputs it will produce in the coming days on digital assets may continue.
On the other hand, the expectations that the FED will continue its interest rate cut cycle, albeit on hiatus for now, and the fact that the volume in crypto-asset ETFs indicates an increase in institutional investor interest, support our upside forecast for the big picture. In the short term, given the nature of the market and pricing behaviors, we think it would not be surprising to see occasional pause or pullbacks in digital assets. However, at this point, it is worth underlining again that we think the fundamental dynamics continue to be bullish.
TECHNICAL ANALYSIS
BTC/USDT
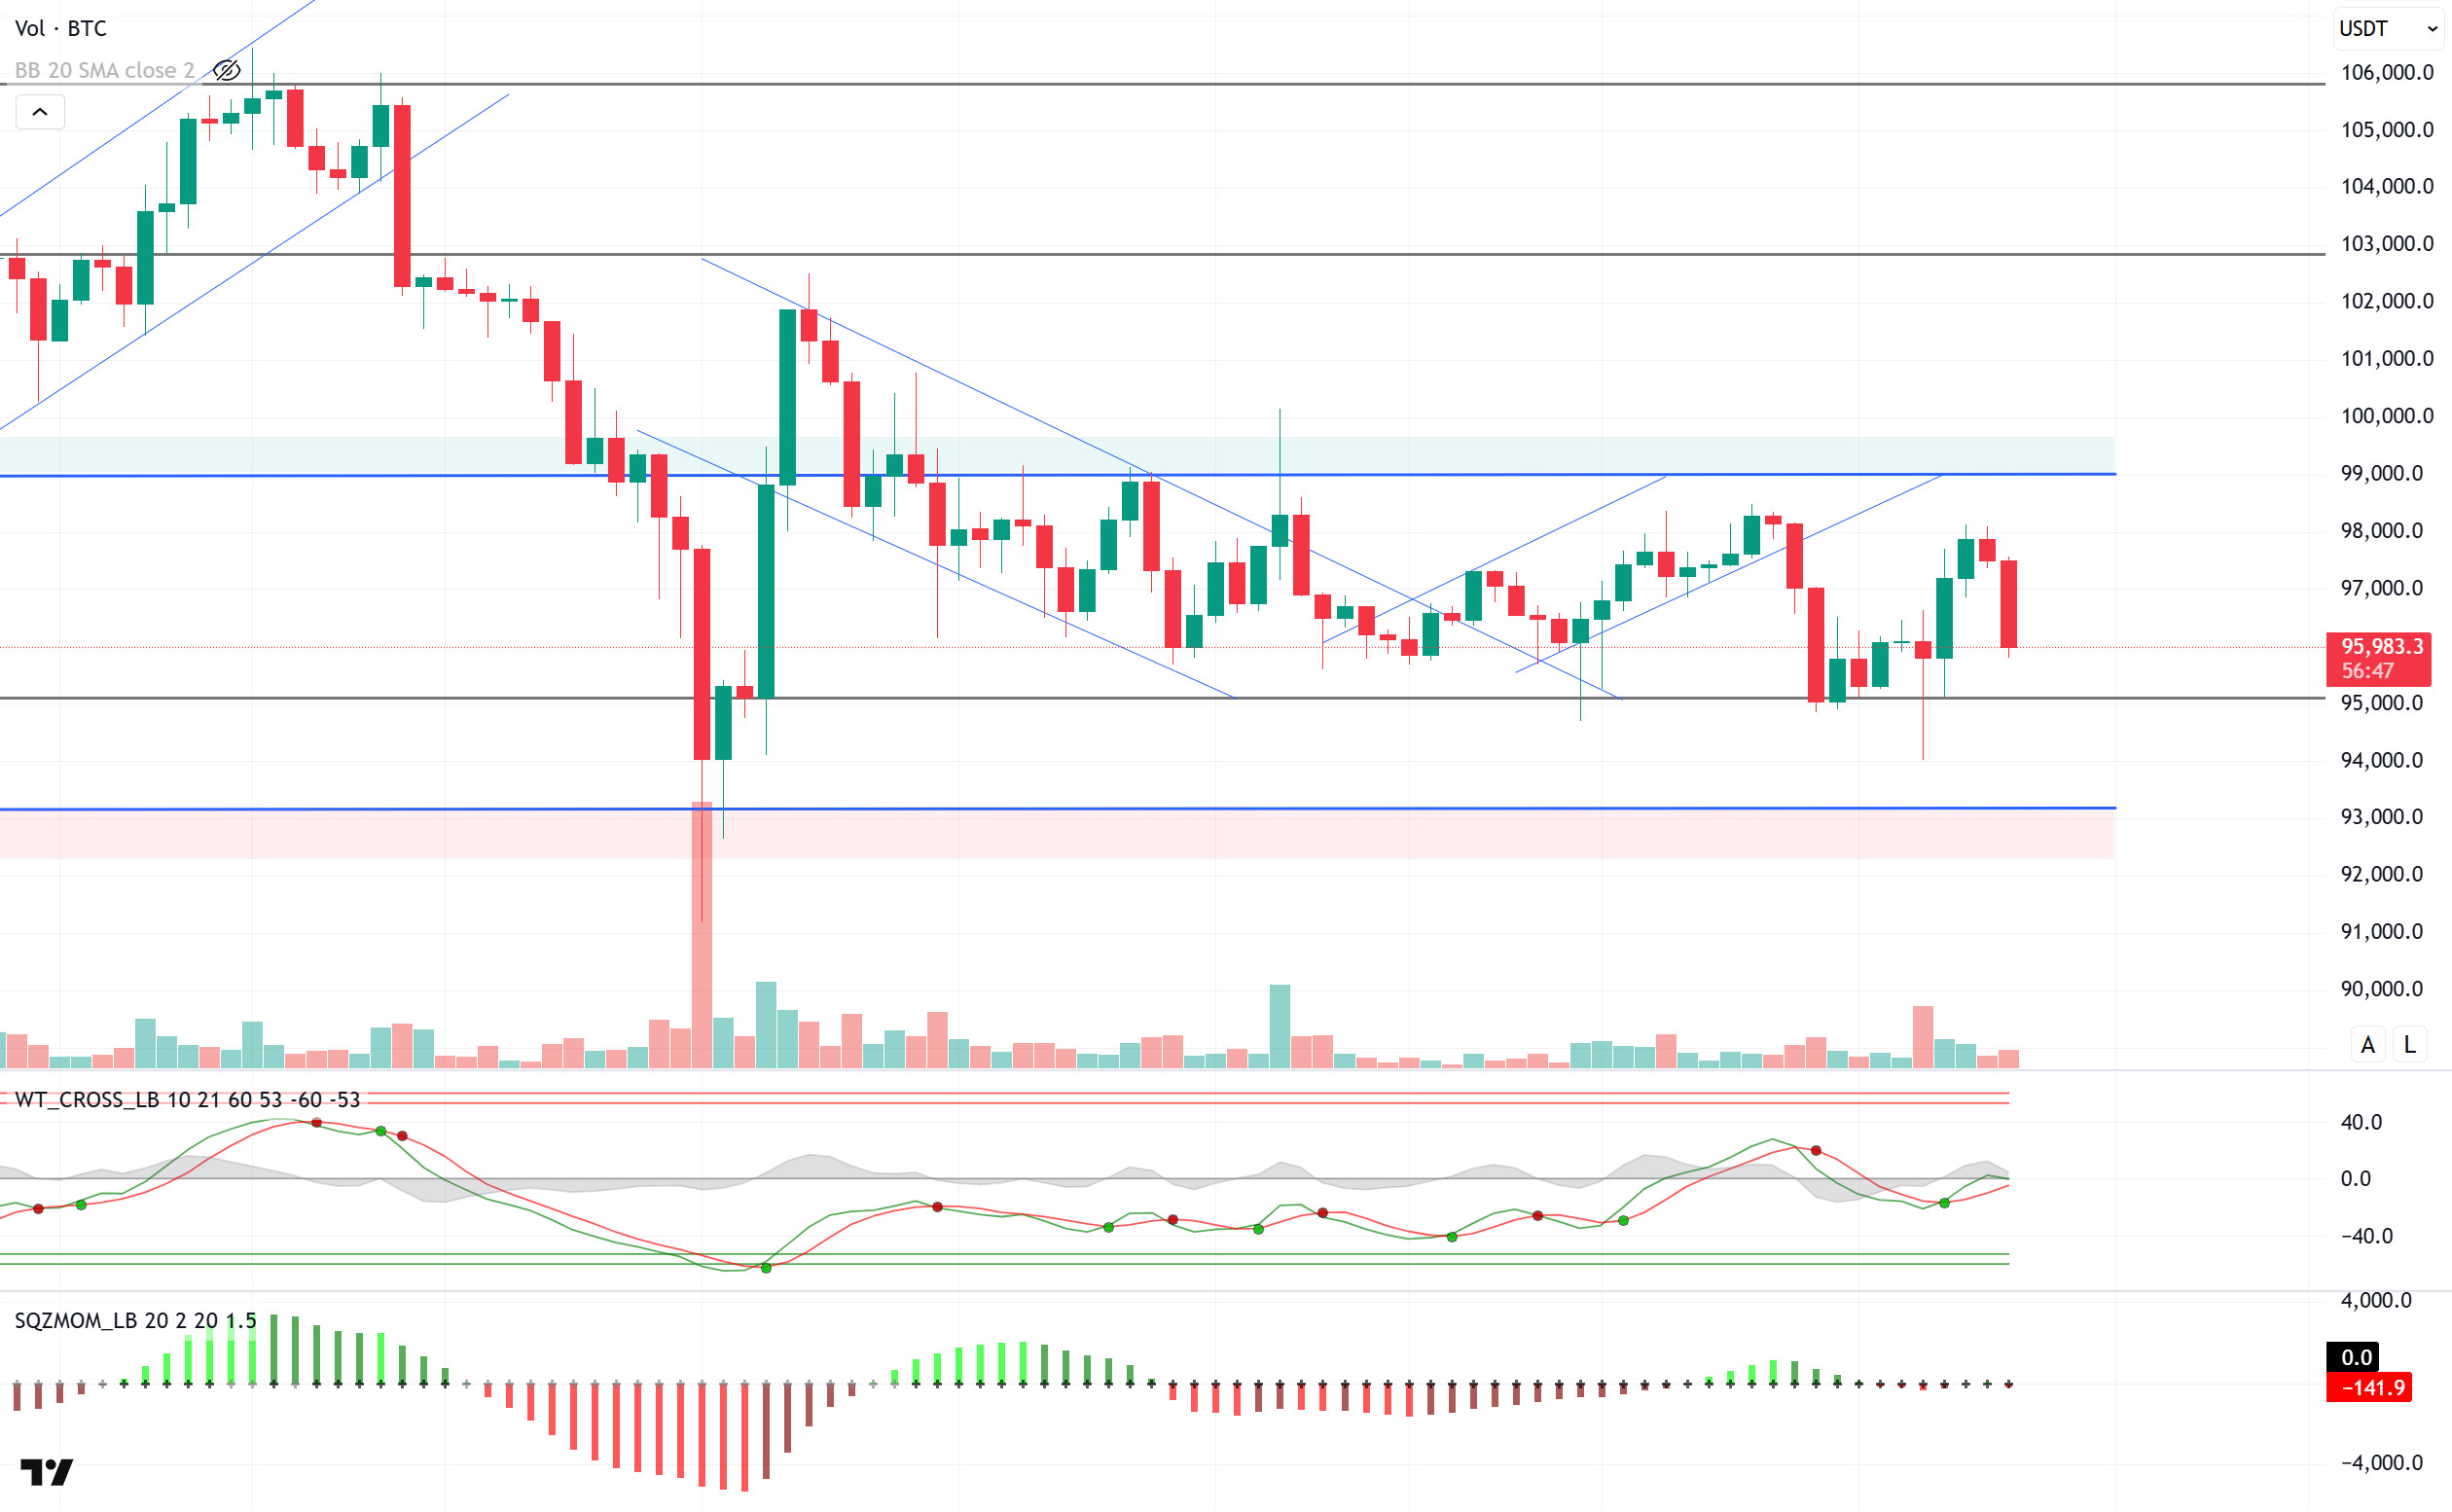
After the increased volatility after the inflation data, the markets have taken a calm outlook again. Bitcoin suffered a sharp pullback as inflation data exceeded expectations, but managed to rebound and returned to its pre-data price band. However, outflows from BTC spot ETFs have been notable, suggesting that institutional investors are losing interest due to market uncertainty.
Looking at the technical outlook, BTC, which fell sharply after the US inflation data, moved downwards again with selling pressure despite its recovery effort. In BTC, which is currently trading at 96,000, technical oscillators produce a sell signal on hourly charts, while a weakening buy signal is observed on 4-hour charts. Momentum indicators have been showing a weak outlook for a while. Due to the uncertainty in the market, BTC seems to be struggling to find direction and is following a neutral course. In this process, the impact of news flows on price movements will be closely monitored. If the decline deepens, the 95,000 level stands out as a critical major support point, while the 97,000 level will be followed as a resistance zone in a possible bullish scenario.
Supports 95,000 – 92,800 – 90,400
Resistances: : 97,000 – 99,100 -101,400
ETH/USDT
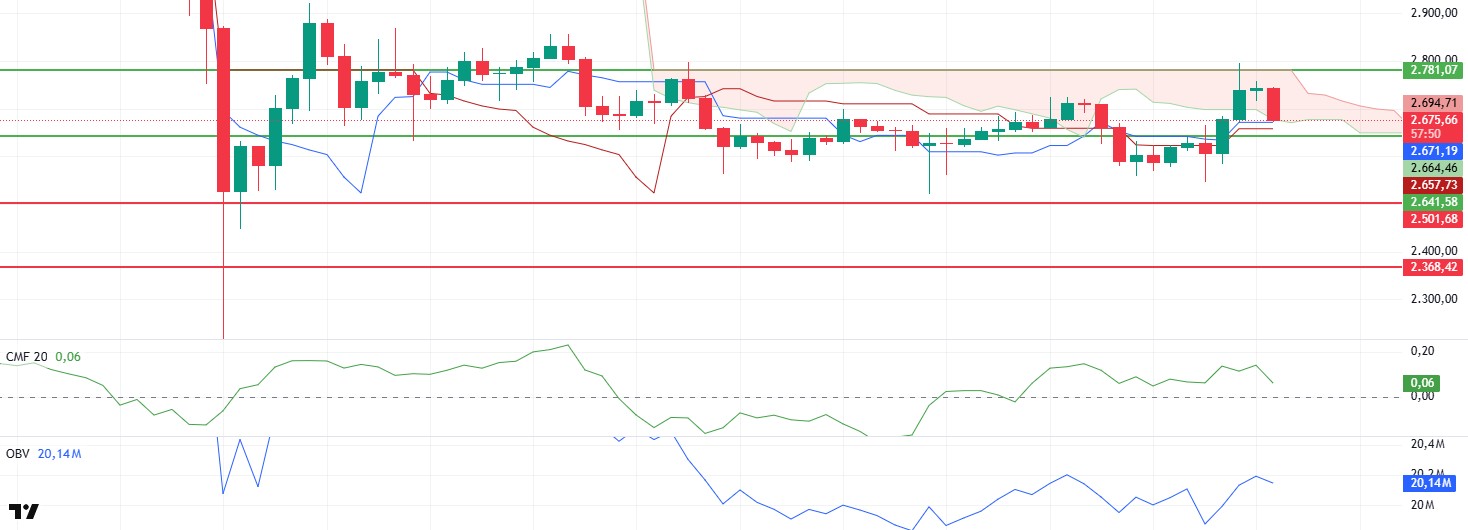
ETH rallied sharply after the announcement of the staking offer for ETH ETFs launched by 21Shares yesterday evening. With this rise, the price gained momentum by overcoming the intermediate resistance at $ 2,641 and climbed to the main resistance point at $ 2,781. However, at this point, it retreated, facing increasing selling pressure and fell back to the kumo cloud support.
Technical indicators show that there is a negative divergence on On Balance Volume (OBV). Under normal circumstances, such divergence can be considered as a bearish signal, but with OBV reaching the 20.15 million level, it can also be said that a positive structure has formed. This shows that volume-based momentum is supporting the price action and the uptrend is not completely over. The Chaikin Money Flow (CMF) indicator, on the other hand, converged to the zero line with the recent pullback, indicating that the selling pressure in the market is increasing. The fact that sellers are starting to take control suggests that fluctuations in short-term price movements may continue. The Ichimoku indicator shows that the price has not yet lost the kijun, tenkan and Kumo cloud boundaries. This indicates that the pullback does not yet indicate a trend reversal and that upward movements may occur again during the day. The preservation of the Ichimoku components can be considered as a strong signal that the price may continue its upward trend in the medium term.
In general terms, if the price does not close below the intermediate support point at $ 2,641, an upward movement towards the $ 2,781 level can be seen again. Exceeding this level could increase the momentum of the price and trigger sharper rises. However, it should be kept in mind that if the $2,641 level is lost, the price may decline to the $2,501 level with increased selling pressure. The direction of short-term movements will be shaped depending on whether the support level at $ 2,641 is maintained.
Supports 2,501 – 2,368 – 2,127
Resistances 2,641 – 2,781 – 2,881
XRP/USDT
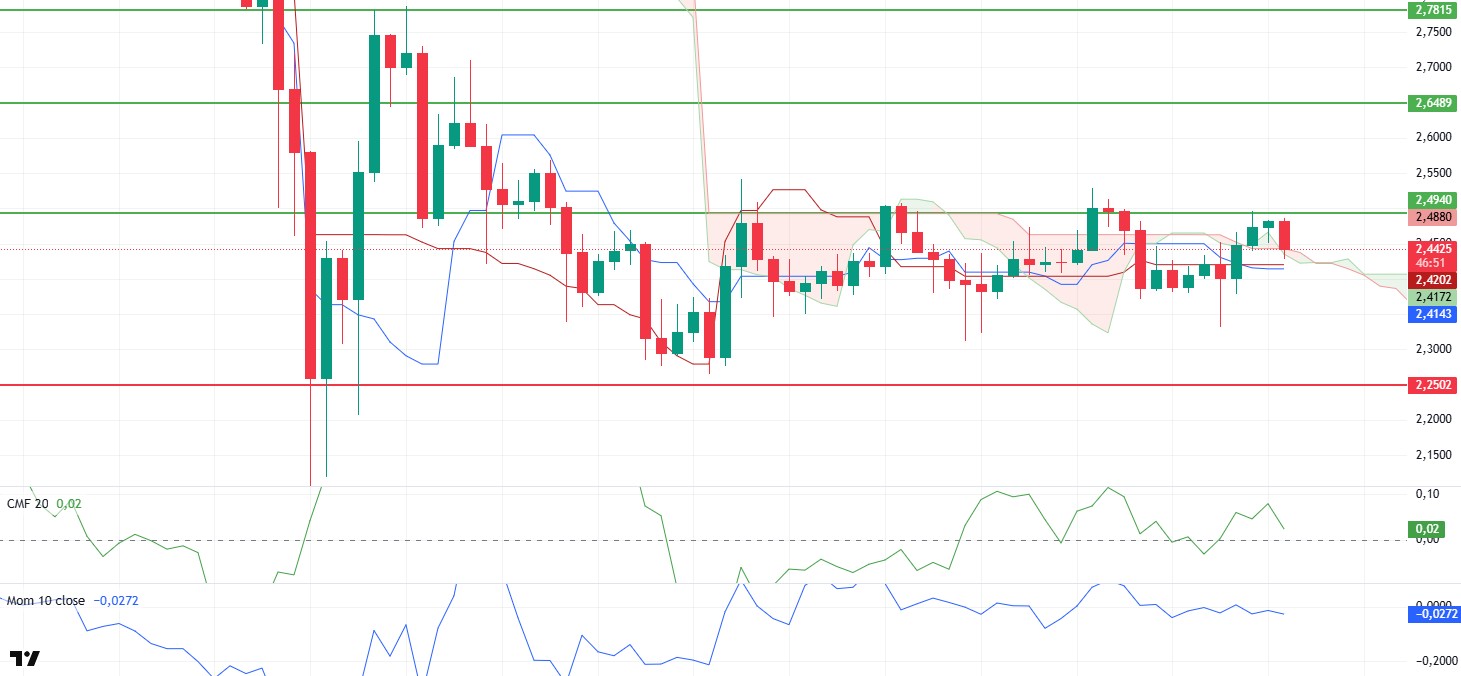
XRP rose as high as $2,494 yesterday evening in parallel with the general bullish movement in the cryptocurrency market. However, at this point, it faced strong selling pressure and turned its direction down again and fell back to the kumo cloud levels. This pullback shows that the rise is not sufficiently supported by market dynamics.
Technical indicators do not give a clear signal about the sustainability of the price action. Momentum and trading volume are not at levels that would support the start of a strong uptrend. The Chaikin Money Flow (CMF) indicator, on the other hand, remains flat, indicating that there is no clear inflow of money into the market, suggesting that investor confidence is still weak and price action may continue to be stuck at certain levels.
The current outlook shows that there is no clear trend in the direction for XRP and the price may move within a narrow band for a while. In this process, the $2.49 level stands out as a critical resistance point. If the price can break through this level with a volume breakout, we can see an acceleration towards higher levels with an increase in momentum. On the other hand, the $2.25 level remains important as the main support. If this level is broken downwards, it may become likely that the selling pressure will deepen and sharper declines may be experienced.
Supports 2.2502 – 2.0201 – 1.6309
Resistances 2.4940 – 2.6486 – 2.7815
SOL/USDT
Coinbase derivatives is preparing to launch its SOL futures contract product later this month. Accordingly, the product will be launched on February 18 based on self-certification.
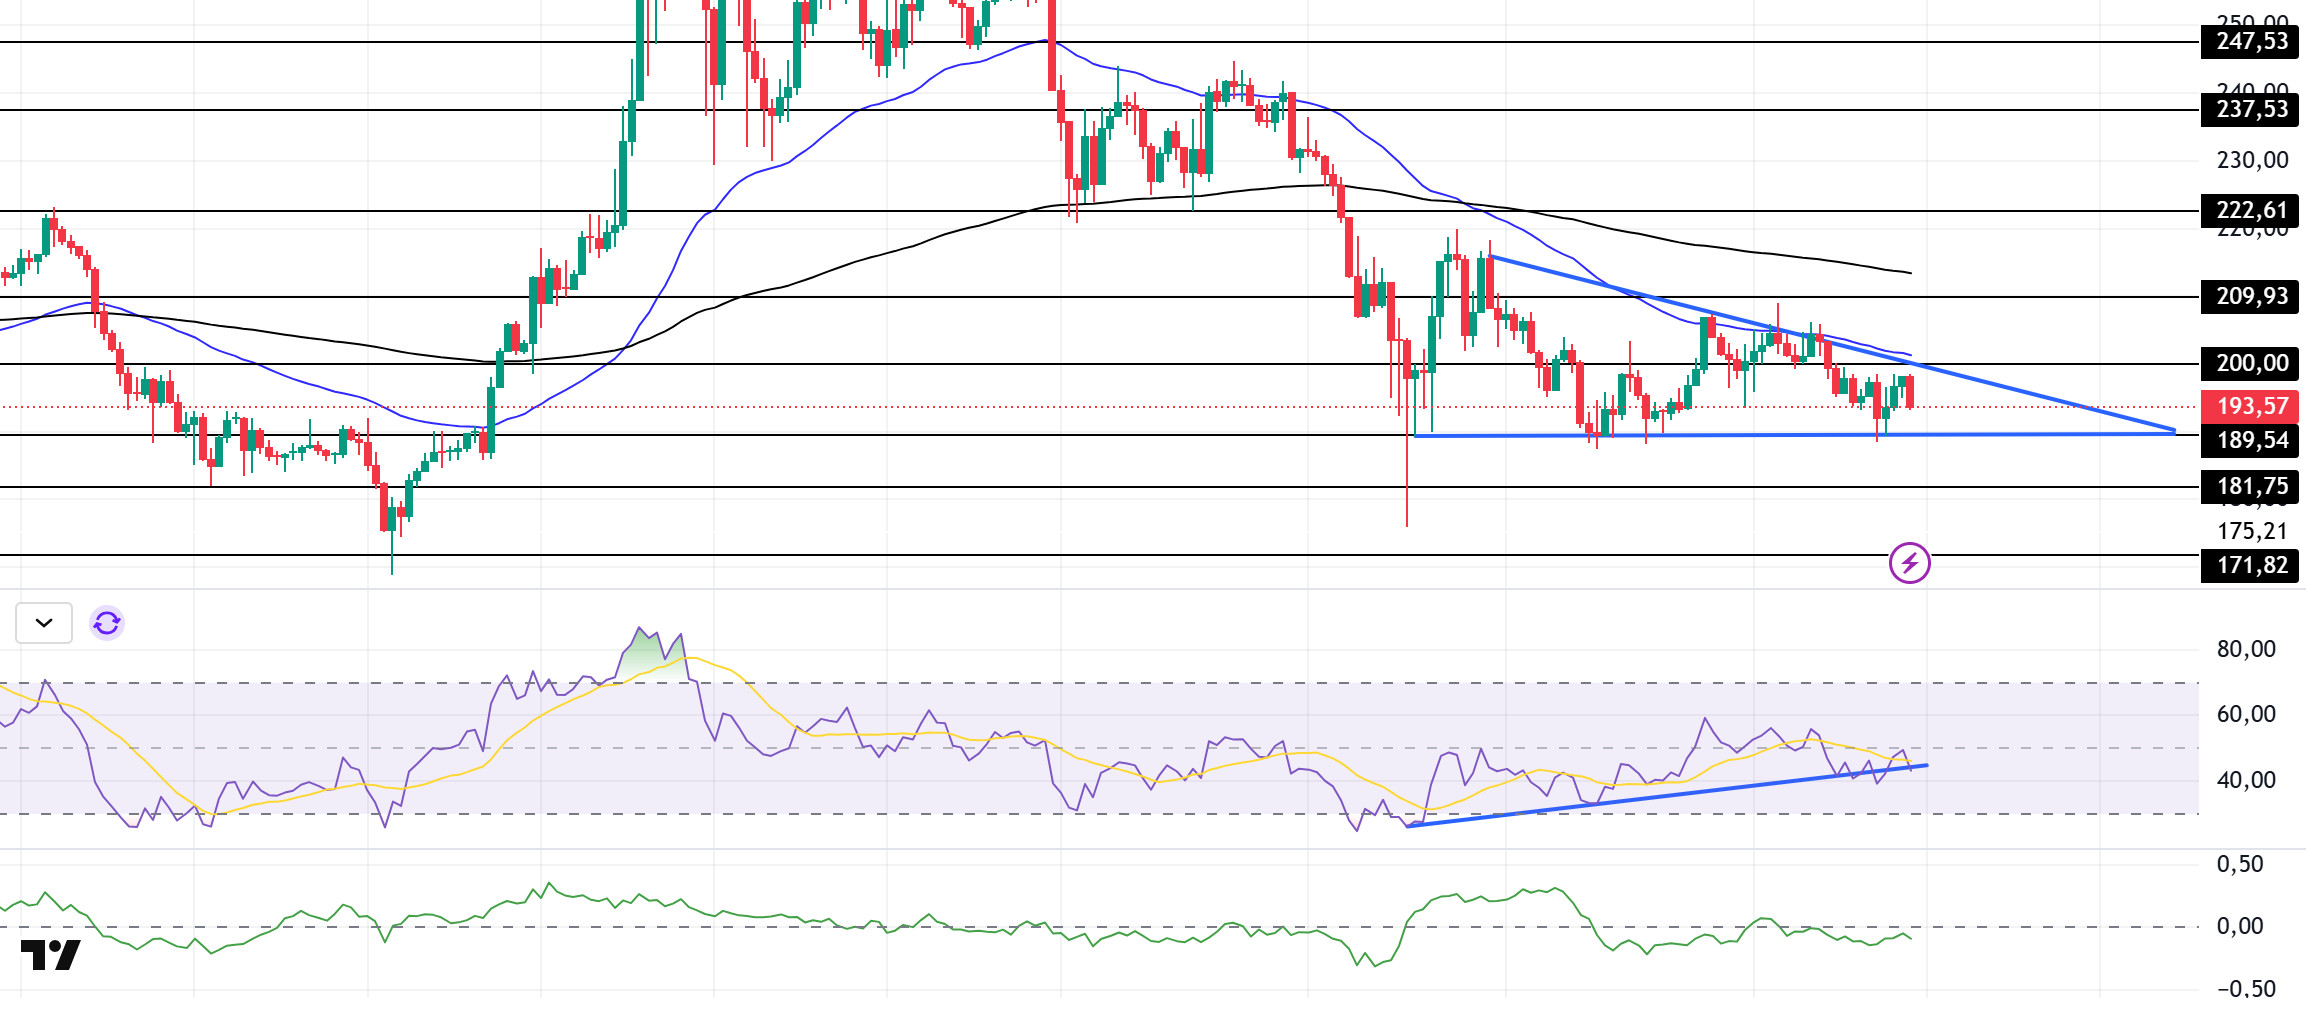
SOL continues to accumulate inside the symmetrical triangle pattern. On the 4-hour timeframe, the 50 EMA (Blue Line) continues to be below the 200 EMA (Black Line). This could deepen the decline in the medium term. At the same time, the asset is priced below the 50 EMA and 200 EMA. The asset, which continues to move sideways, continues to be in a falling triangle pattern. When we examine the Chaikin Money Flow (CMF)20 indicator, it is close to the neutral level of the negative zone. However, the Relative Strength Index (RSI)14 indicator is in the negative zone and the uptrend in RSI, which started on February 3, continues. The $ 237.53 level stands out as a very strong resistance point in the rises driven by both the upcoming macroeconomic data and the news in the Solana ecosystem. If it breaks here, the rise may continue. In case of retracements for the opposite reasons or due to profit sales, the support level of $ 181.75 can be triggered again. If the price comes to these support levels, a potential bullish opportunity may arise if momentum increases.
Supports 189.54 – 181.75 – 171.82
Resistances 200.00 – 209.93 – 222.61
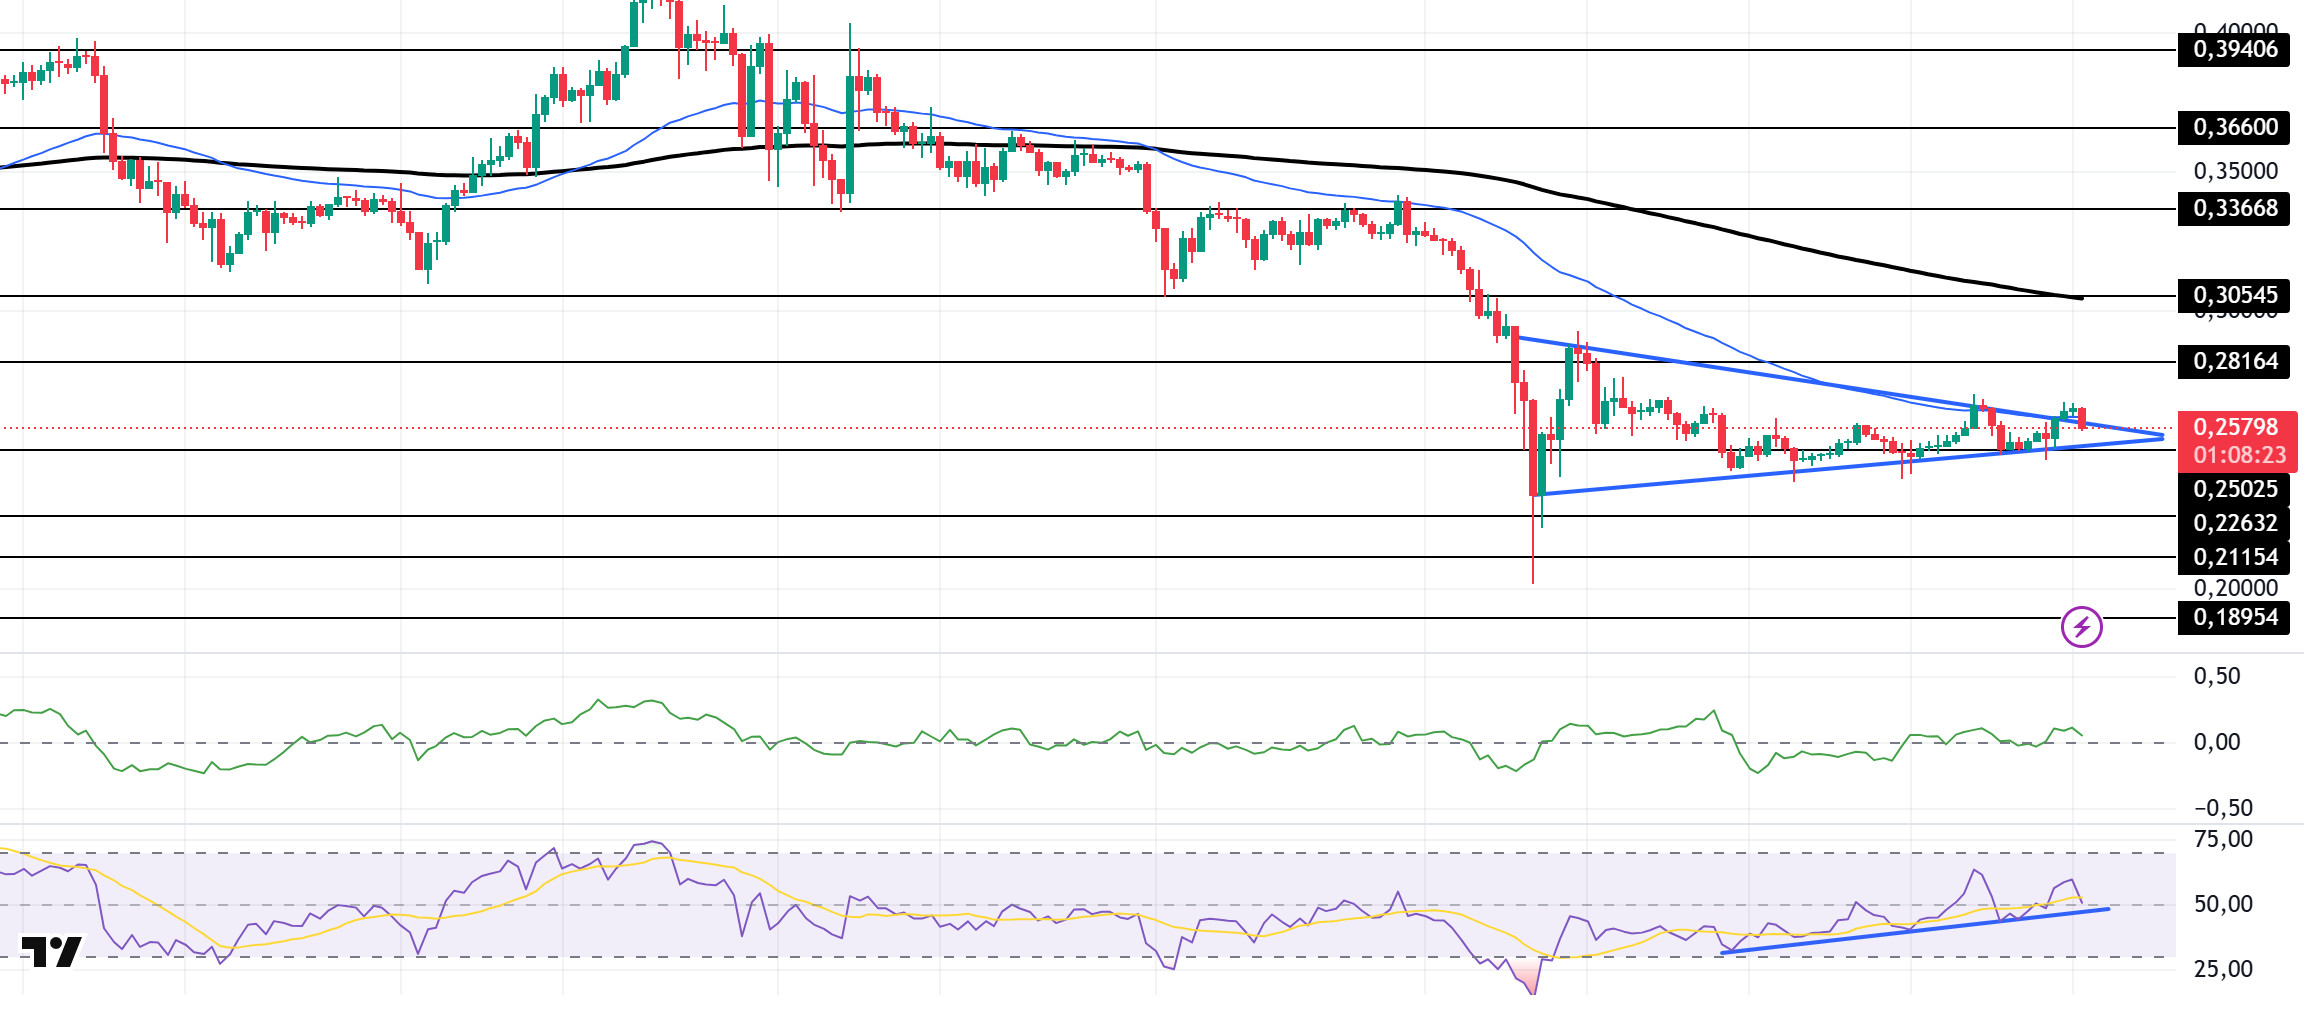
DOGE/USDT
Since our analysis yesterday, DOGE encountered resistance at the top of the symmetrical triangle pattern but broke through it. On the 4-hour timeframe, the 50 EMA (Blue Line) remains below the 200 EMA (Black Line). This could mean that the decline could deepen further in the medium term. At the same time, the price is hovering between the 50 EMA (Blue Line) and the 200 EMA (Black Line). However, the larger difference between the two moving averages may increase the probability that the DOGE will rise. It is currently testing the 50 EMA and the ceiling of the symmetrical triangle pattern as support. The Chaikin Money Flow (CMF)20 indicator is in positive territory and money inflows have started to decline. At the same time, Relative Strength Index (RSI)14 is close to the neutral level of the positive zone and the uptrend that started on February 6 continues. The $0.33668 level stands out as a very strong resistance in the uptrend due to political reasons, macroeconomic data and innovations in the DOGE coin. In case of possible pullbacks due to political, macroeconomic reasons or negativities in the ecosystem, the base level of the trend, the $ 0.22632 level, is an important support. If the price reaches these support levels, a potential bullish opportunity may arise if momentum increases.
Supports 0.25025 – 0.22632 – 0.21154
Resistances 0.28164 – 0.30545 – 0.33668
LEGAL NOTICE
The investment information, comments and recommendations contained herein do not constitute investment advice. Investment advisory services are provided individually by authorized institutions taking into account the risk and return preferences of individuals. The comments and recommendations contained herein are of a general nature. These recommendations may not be suitable for your financial situation and risk and return preferences. Therefore, making an investment decision based solely on the information contained herein may not produce results in line with your expectations.

