
MARKET SUMMARY
Latest Situation in Crypto Assets
| Assets | Last Price | 24h Change | Dominance | Market Cap. |
|---|---|---|---|---|
| BTC | 96,364.21 | -1.15% | 59.85% | 1,91 T |
| ETH | 2,685.77 | -0.86% | 10.14% | 323,82 B |
| XRP | 2.676 | -3.92% | 4.84% | 154,60 B |
| SOLANA | 183.45 | -6.06% | 2.81% | 89,58 B |
| DOGE | 0.2632 | -2.90% | 1.22% | 38,93 B |
| CARDANO | 0.8081 | 3.21% | 0.89% | 28,46 B |
| TRX | 0.2442 | 2.38% | 0.66% | 21,01 B |
| LINK | 19.03 | -0.15% | 0.38% | 12,15 B |
| AVAX | 25.10 | -1.05% | 0.32% | 10,38 B |
| SHIB | 0.00001592 | -1.16% | 0.29% | 9,37 B |
| DOT | 4.921 | -1.20% | 0.24% | 7,57 B |
*Prepared on 2.17.2025 at 07:00 (UTC)
WHAT’S LEFT BEHIND
Michael Saylor: Bitcoin Will Keep Buying
Michael Saylor, founder of Strategy (formerly MicroStrategy), stated that they see Bitcoin as a “digital Manhattan” and will continue to buy it. Saylor said that as the price of Bitcoin increases, they will see more opportunities and will start new businesses using BTC as collateral.
Argentine President Javier Milei Accused of Fraud in LIBRA Token Scandal
Argentine lawyers sued President Javier Milei for his involvement in the LIBRA token project. The plaintiffs claimed that this project was used for fraudulent purposes and that Milei played a key role in it. The lawsuit is supported by several prominent figures, including the former head of the Central Bank of Argentina.
ETH Options Market on a Bullish Trend
According to CoinGlass data, more than 70% of ETH options positions are bullish. Nansen analyst Nicolai Sondergaard noted that investors are cautiously optimistic about ETH’s medium-term appreciation potential. However, ETH is still trading 44% below its all-time high of $4,890 in November 2021
Russian Brokerage Finam to Issue Bonds Linked to BlackRock’s Bitcoin ETF
Russian retail investment firm Finam announced on February 17 that it will offer investment products based on BlackRock’s iShares Bitcoin Trust ETF (IBIT). This product will give Russian investors exposure to a spot Bitcoin ETF for the first time. The bonds will be denominated in rubles and the yield will be calculated based on the Bank of Russia’s exchange rate.
FTX to Start Paying Creditors from February 18, 2025
FTX announced that it will begin debt repayments on February 18th. Creditors of $50,000 or less will be prioritized. Repayments will be calculated at an annual interest rate of 9% from November 11, 2022.
Germany Goes to the Polls on February 23
Germany’s parliamentary elections on February 23rd could lead to major changes in the financial sector. The far-right Alternative for Germany (AfD) party proposes that Germany leave the Eurozone and deregulate Bitcoin. However, other parties have announced that they will not enter into a coalition with the AfD, which could make their policies difficult to implement.
Ethereum Foundation Opens Applications for Pectra Proactive Grant Round
The Ethereum Foundation will provide $200,000 in grant funding to support the Pectra ecosystem upgrade. Applications will be open until February 23rd.
HIGHLIGHTS OF THE DAY
Important Economic Calender Data
| Time | News | Expectation | Previous |
|---|---|---|---|
| ApeCoin (APE) 15.60M Token Unlock | |||
| Echelon Prime (PRIME) 750K Token Unlock | |||
| Polkadot (DOT) V2.0 Deep Dive | |||
| All Day | Holiday United States – Washington’s Birthday | ||
| 14:30 | FOMC Member Harker Speaks | ||
| 15:20 | FOMC Member Bowman Speaks | ||
| 23:00 | FOMC Member Waller Speaks |
INFORMATION
*The calendar is based on UTC (Coordinated Universal Time) time zone.
The economic calendar content on the relevant page is obtained from reliable news and data providers. The news in the economic calendar content, the date and time of the announcement of the news, possible changes in the previous, expectations and announced figures are made by the data provider institutions. Darkex cannot be held responsible for possible changes that may arise from similar situations.
MARKET COMPASS
In global markets, President Trump’s steps on “tariffs” and the expectations regarding the same, as well as forecasts for the Federal Reserve’s monetary policy decisions, are on the agenda. Seeking a balance between expectations that Donald Trump will use the threat of tariffs as a negotiating tool and the continued rise in inflation, investors will look for direction in the low-volume environment that the US markets, which are closed today, may bring. Major digital assets, which managed to rise on Friday with the decline in the dollar index after retail sales in the US fell below forecasts, generally remained flat over the weekend and then started the week with a decline. The sideways trend in digital assets continues. We maintain our expectation of flat to volatile in the short term, slightly pressured in the medium term and bullish in the long term. Bond and equity markets are closed in the US today, but Wall Street index futures will be traded in Hong Kong and London.
From the short term to the big picture.
Trump’s victory on November 5, one of the main pillars of our bullish expectation for the long-term outlook in digital assets, produced a result in line with our predictions. In the aftermath, the appointments made by the president-elect and the increasing regulatory expectations for the crypto ecosystem in the US, as well as the emergence of BTC as a reserve, continued to take place in our equation as positive variables. Then, 4 days after the new President took over the White House, he signed the “Cryptocurrency Working Unit” decree, which was among his election promises, and we think that the positive reflection of the outputs it will produce in the coming days on digital assets may continue.
On the other hand, the expectations that the FED will continue its interest rate cut cycle, albeit on hiatus for now, and the fact that the volume in crypto-asset ETFs indicates an increase in institutional investor interest, support our upside forecast for the big picture. In the short term, given the nature of the market and pricing behavior, we think it would not be surprising to see occasional pause or pullbacks in digital assets. However, at this point, it is worth underlining again that we think the fundamental dynamics continue to be bullish.
TECHNICAL ANALYSIS
BTC/USDT
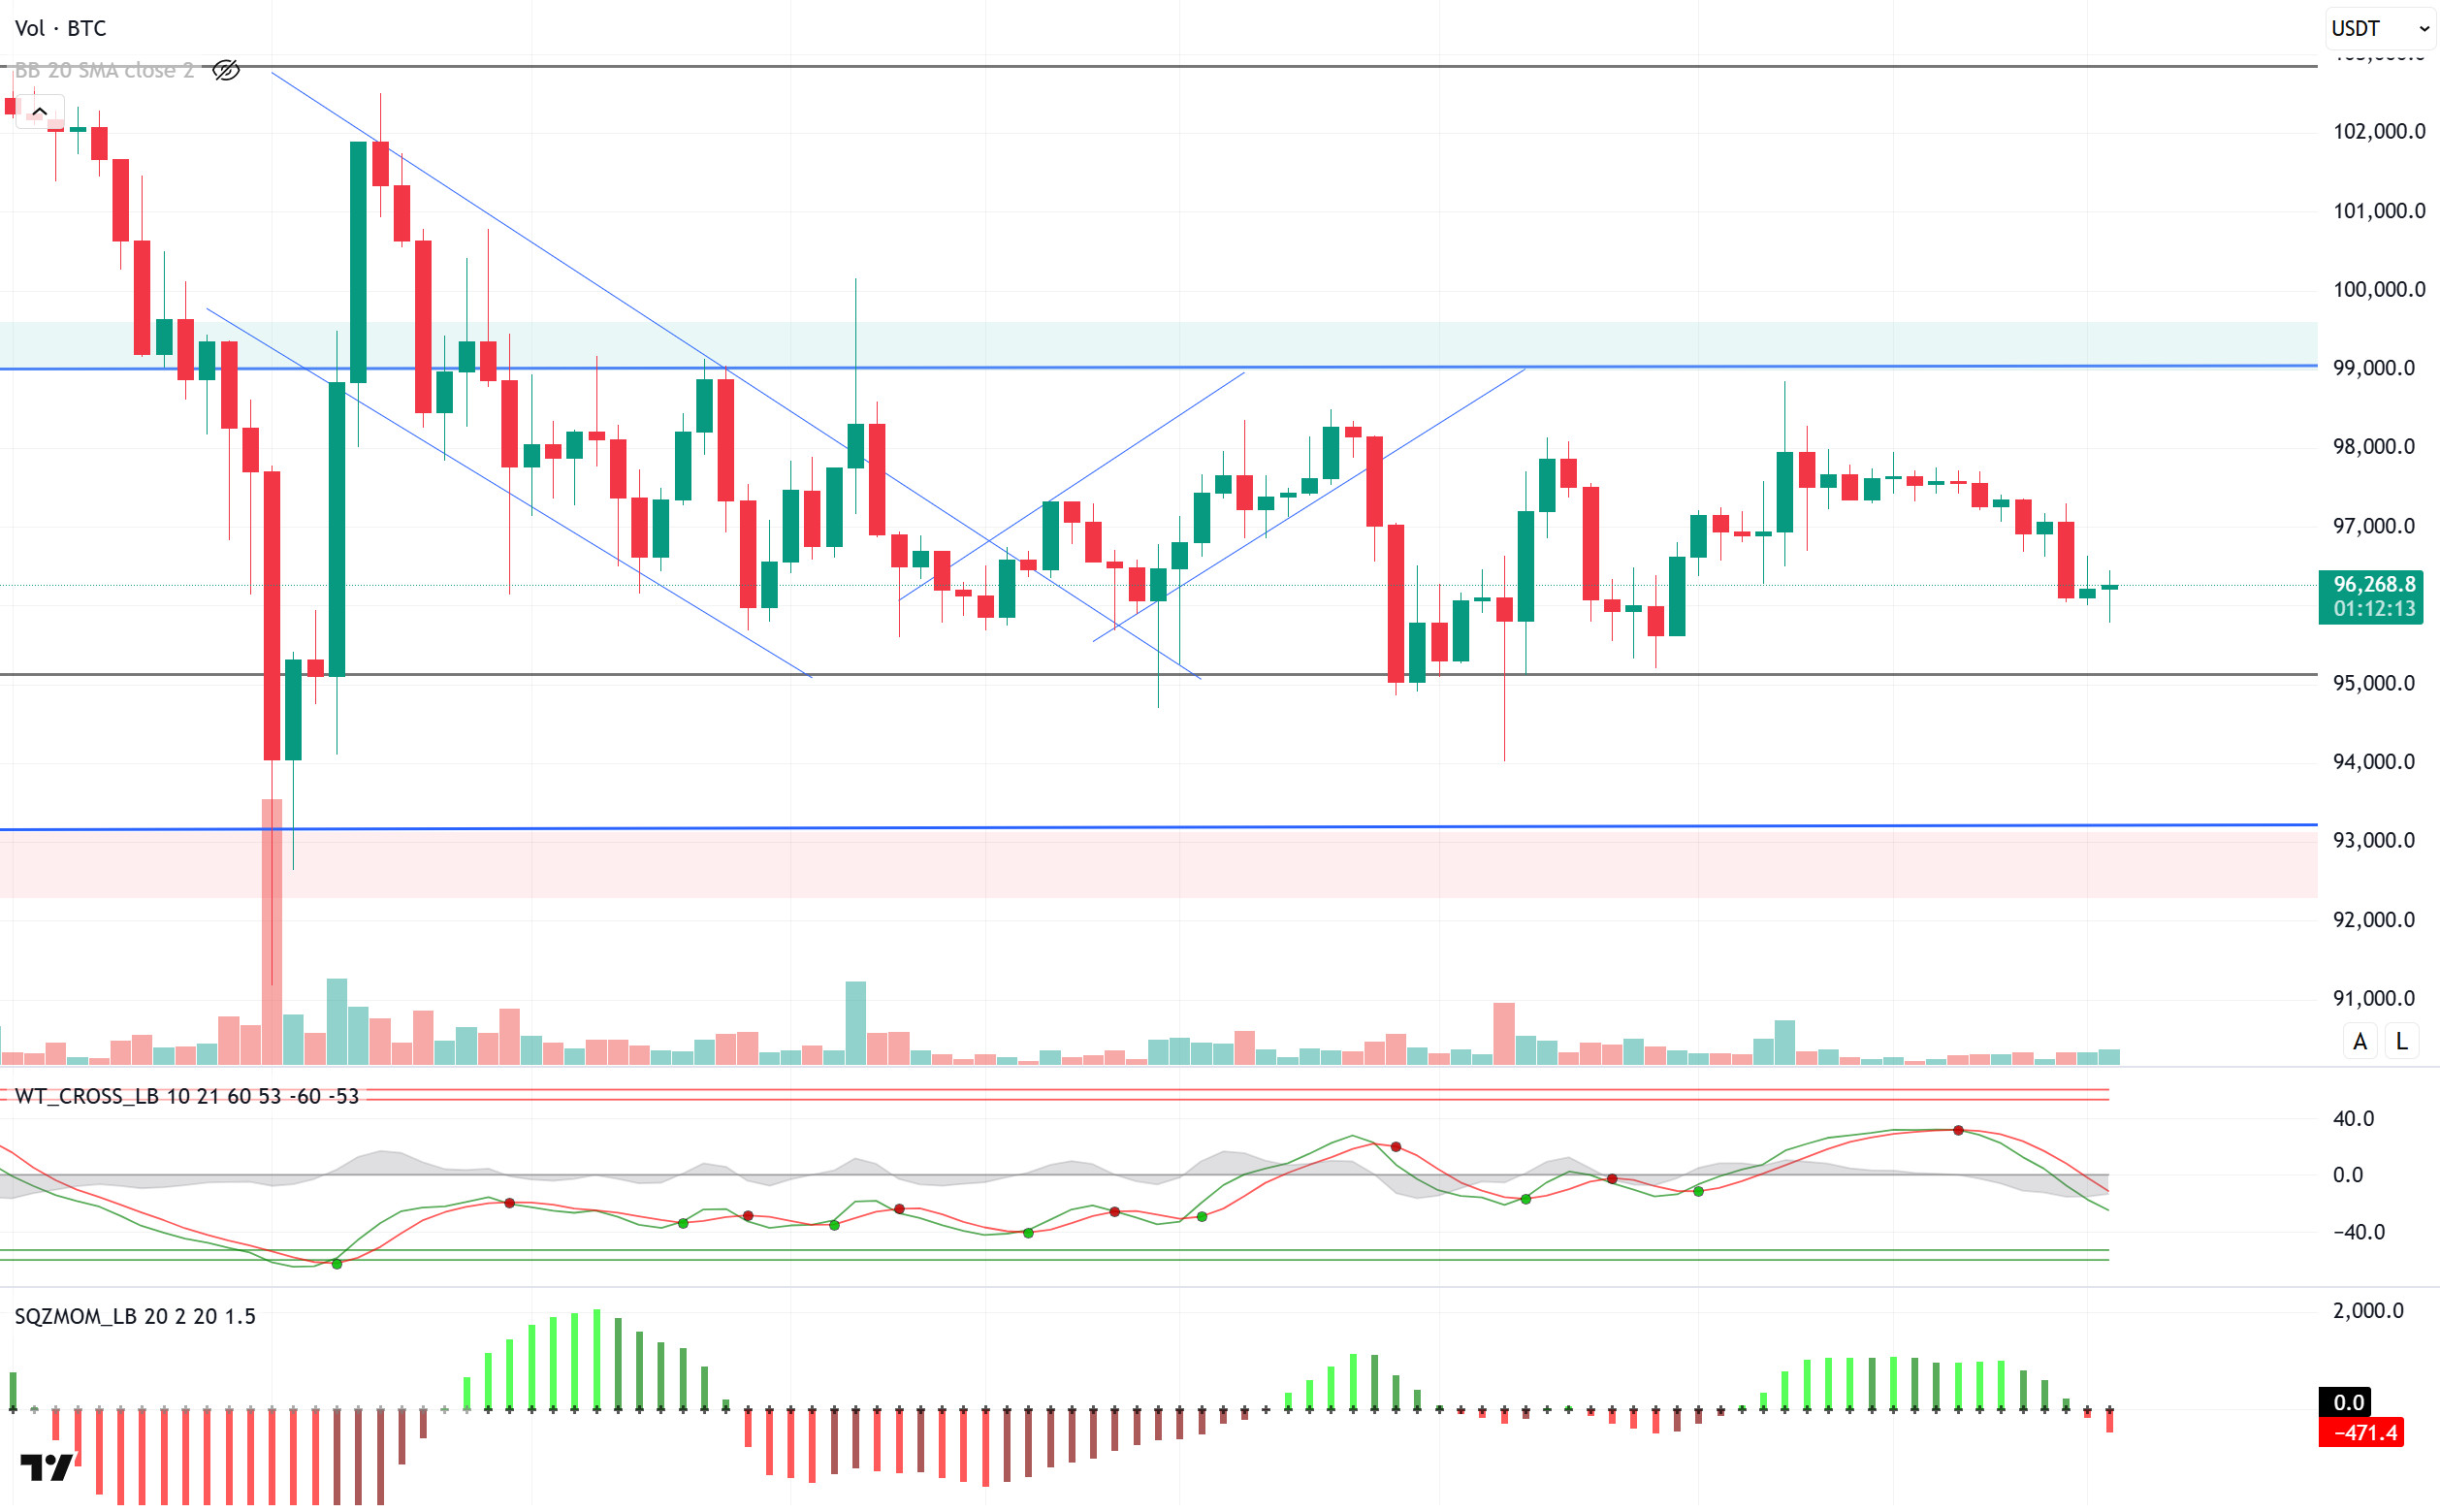
Strategy founder Michael Saylor, who continues his interest in Bitcoin, stated that they see BTC as a “digital Manhattan”. Saylor emphasized that they will continue to buy Bitcoin, stating that as the price rises, new opportunities will arise and they will turn to different business areas by using BTC as collateral. On the other hand, the bankrupt crypto exchange FTX announced that it will start user refunds as of February 18. When we look at today, the fact that the US markets are closed due to the official holiday may cause the Bitcoin price to continue its horizontal movements.
When we look at the technical outlook, the price, which shot to the 98,800 level on Friday, could not stay here. BTC, which declined with low volatility over the weekend, started the week at 95,900. BTC, which is currently trading at 96,400, continues to maintain a sell signal on the 4-hour chart despite the buy signal of technical oscillators on hourly charts. When we look at the momentum indicators, we observe that it has moved into the negative zone. In the continuation of the rise, closures above the 97,000 minor support level will be followed, and with the deepening of the decline, we will follow the 95,000 major support point. In BTC, which is in search of direction within a narrow band, the uncertainty arising from macro data continues to suppress the price.
Supports 95,000 – 92,800 – 90,400
Resistances 97,000 – 99,100 -101,400
ETH/USDT
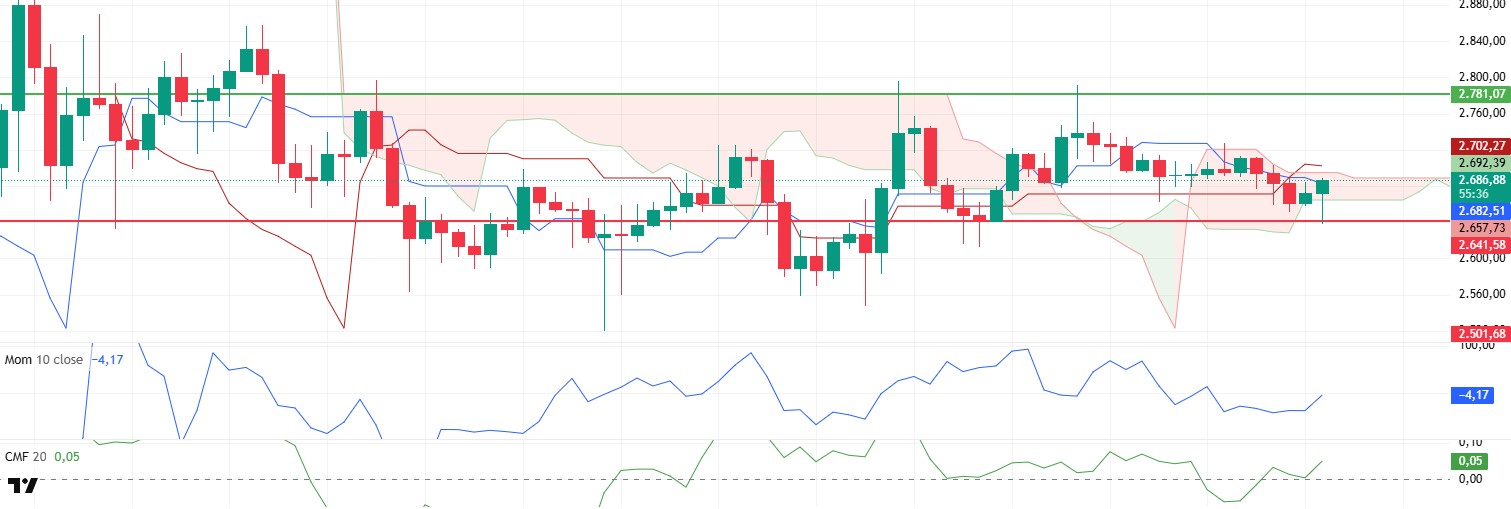
ETH, after rising as high as $ 2,781 on Friday with the rise it experienced on Friday, followed a slightly negative course throughout the week with the sales reaction from this region and fell to the intermediate support level of $ 2,641. Technical indicators offer important clues for ETH, which started the week slightly positive with the support it found from this point.
First of all, the momentum and volume, which weakened over the weekend, can be considered positive as of the beginning of the week. The fact that the Chaikin Money Flow (CMF) indicator is also on the rise with support from the zero zone indicates the intensity of liquidity inflows. When the Ichimoku indicator is analyzed, it is seen that there is a sell signal formed by the tenkan level cutting the kijun level downwards, although it seems positive that the price is included in the kumo cloud boundaries again. In order for this outlook to shift to positive, it seems important to exceed the $2,694 kumo cloud resistance.
As a result, although technical indicators show that the positive mood continues in general, it is critical to see a pricing above $ 2,700 to overcome the sell signal, especially in the ichimoku indicator. Above this zone, the price may be inclined to rise again to the level of $ 2,781. Exceeding the $ 2,781 level may bring more drastic rises. However, if the price cannot hold above this region, it may retreat to the intermediate support level of $ 2,641. Violation of this level may bring declines to the $ 2,501 level.
Supports 2,641 – 2,501 – 2,368
Resistances 2,781 – 2,881 – 2,992
XRP/USDT
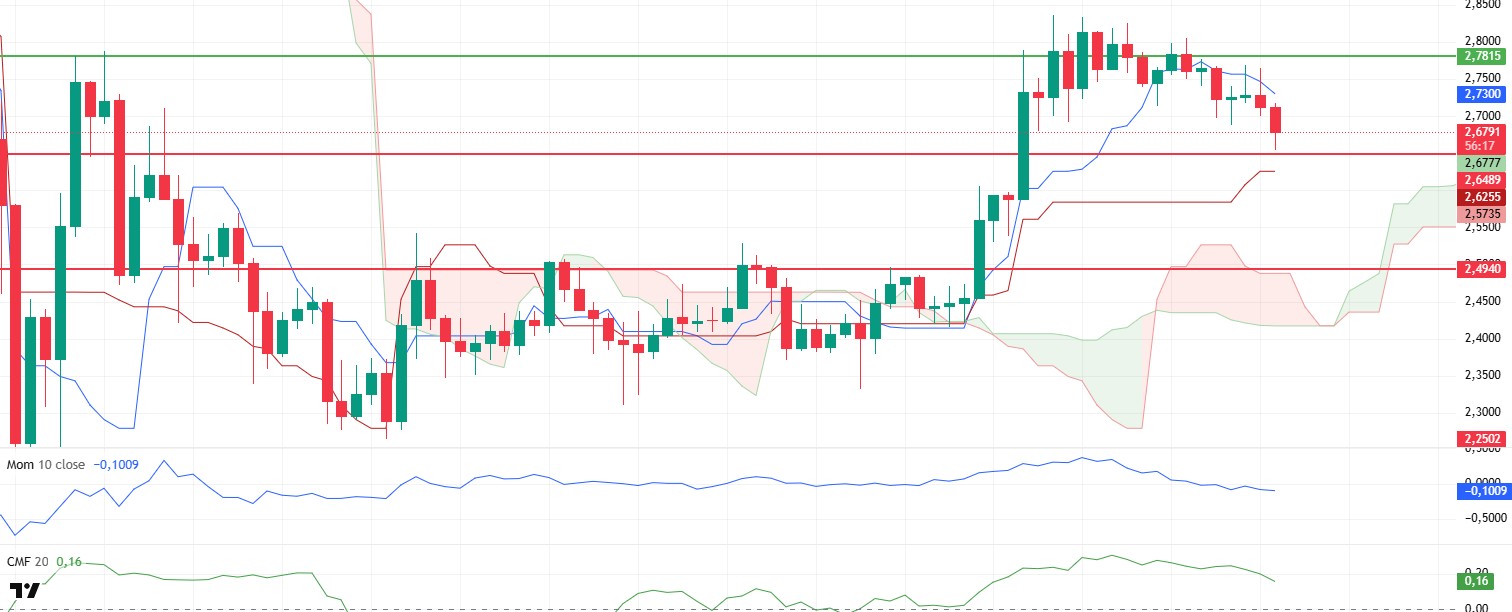
XRP managed to break the $2.78 resistance with the rise it experienced on Friday. However, XRP, which could not hold in this region, exhibited a downward trend over the weekend and broke the 0.786 fib level and fell back to $ 2.65 support.
With this move, a serious downtrend in momentum has started and spot sales are intense in Cumulative Volume Delta (CVD) data. With this decline, XRP, which also lost the tenkan level, has converged to the kijun level. Chaikin Money Flow (CMF), on the other hand, declined without any divergence and shows that sellers are strong.
With all these indicators, it can be said that the price may fall a little more as it violates the resistance of $ 2.65 during the day. However, if the $2.65 level is maintained, the fact that the general market also tends to recover slightly indicates that a reaction from this region may move the price slightly up again. In short, it may be healthier to determine the direction with the price movement at the $ 2.65 level. Breach of the $2.65 level may bring sharp declines up to $2.49.
Supports 2.6486 – 2.4940 – 2.2502
Resistances 2.7815 – 2.9379 – 3.1567
SOL/USDT
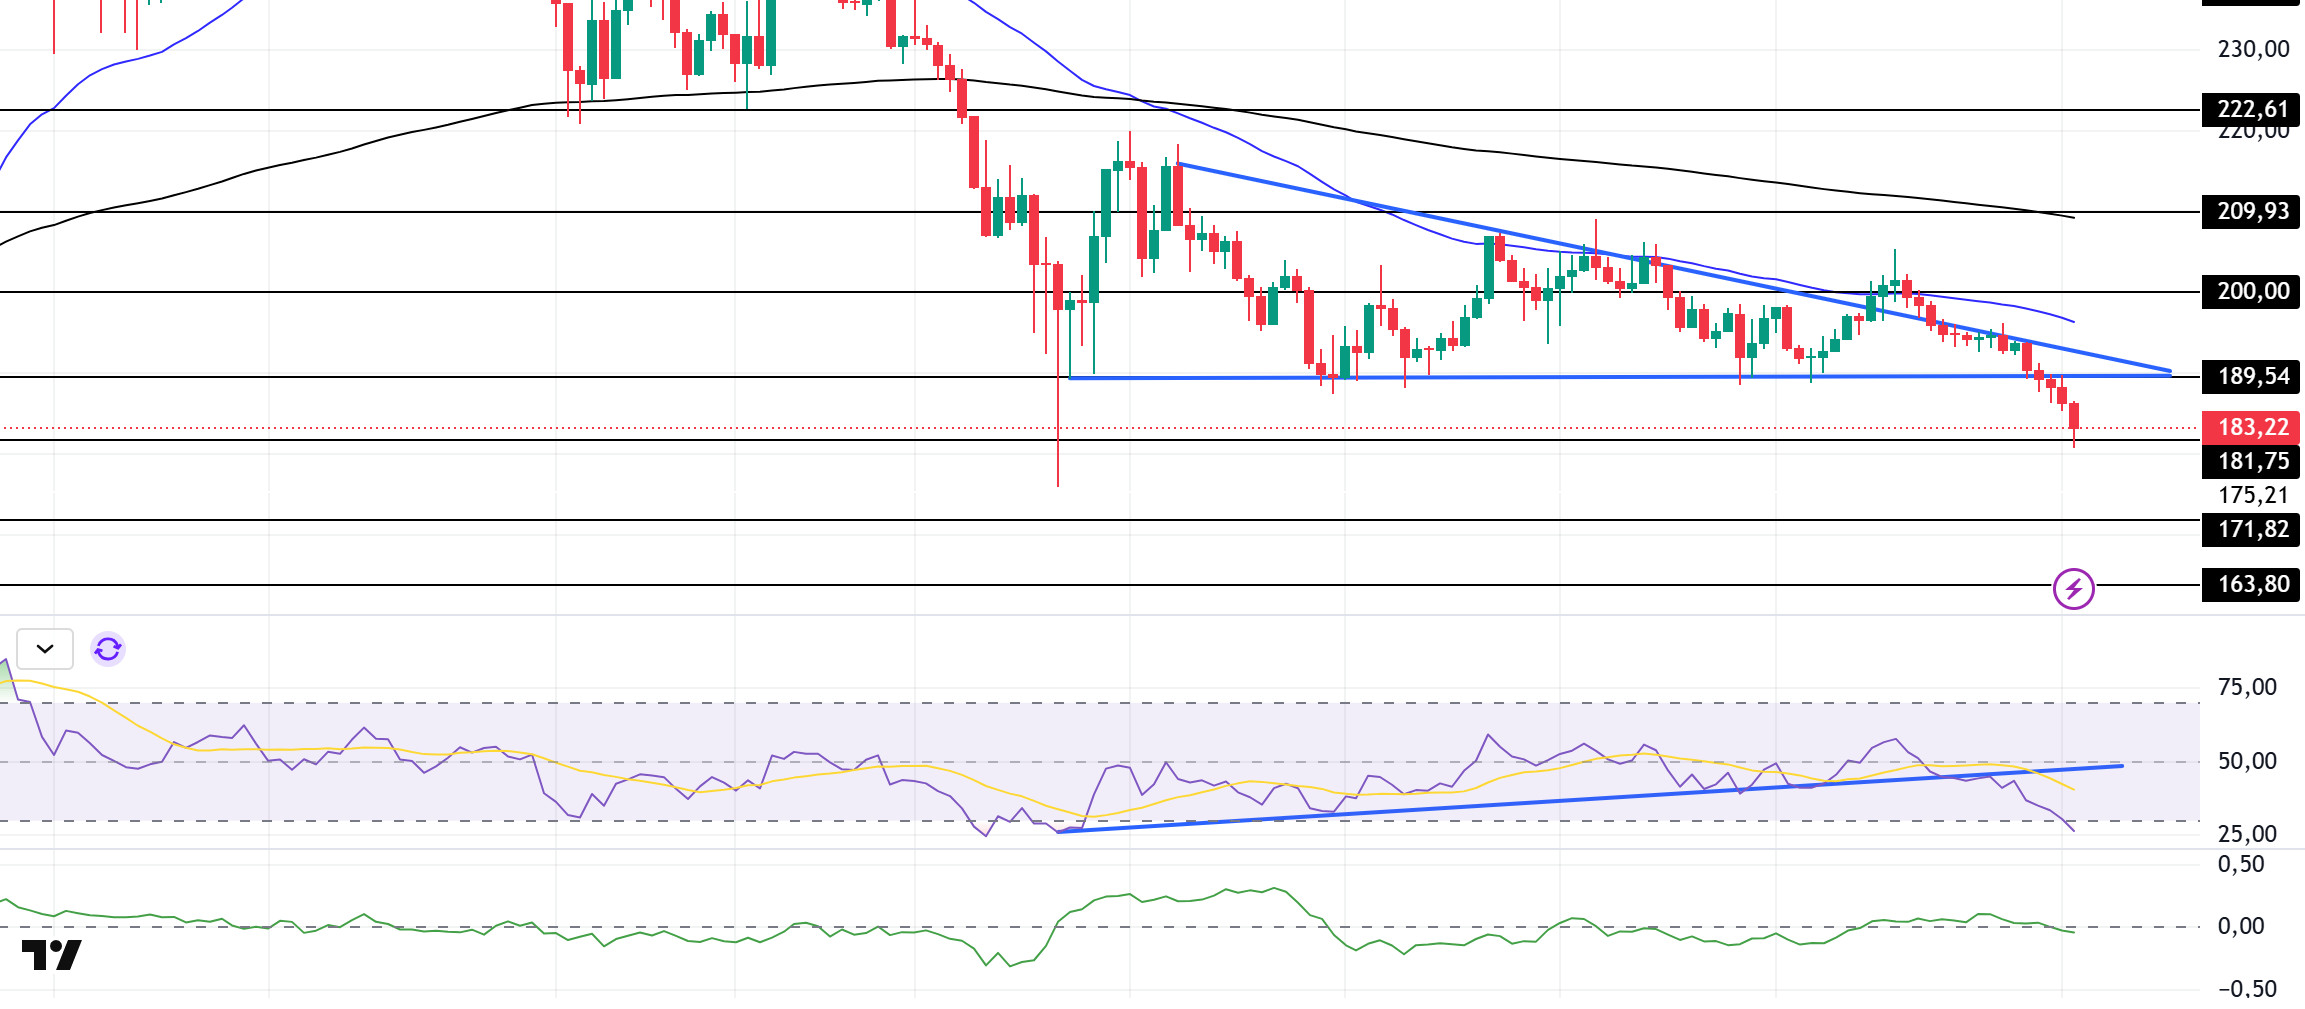
Solana will unlock 11.16 million SOLs worth over $2 billion at current prices on March 1. Solana launched the Pump.fun mobile app, the memecoin launchpad. On the other hand, the platform has seen a significant drop in daily trading volume, down from its high in January 2025.
SOL broke the falling triangle pattern strongly to the downside and found support at 181.75, which is currently a strong resistance. On the 4-hour timeframe, the 50 EMA (Blue Line) continues to be below the 200 EMA (Black Line). This could deepen the decline in the medium term. At the same time, the asset continued to hover below both moving averages. The Chaikin Money Flow (CMF)20 indicator is at a neutral level despite the increase in volume. This shows that buyers and sellers are in balance. However, the Relative Strength Index (RSI)14 indicator is in oversold territory and the uptrend in the RSI that started on February 3 has experienced a strong downward break. The $ 200.00 level stands out as a very strong resistance point in the rises driven by both the upcoming macroeconomic data and the news in the Solana ecosystem. If it breaks here, the rise may continue. In case of retracements for the opposite reasons or due to profit sales, the support level of $ 181.75 can be triggered again. If the price reaches these support levels, a potential bullish opportunity may arise if momentum increases.
Supports 181.75 – 171.82 – 163.80
Resistances 189.54 – 200.00 – 209.93
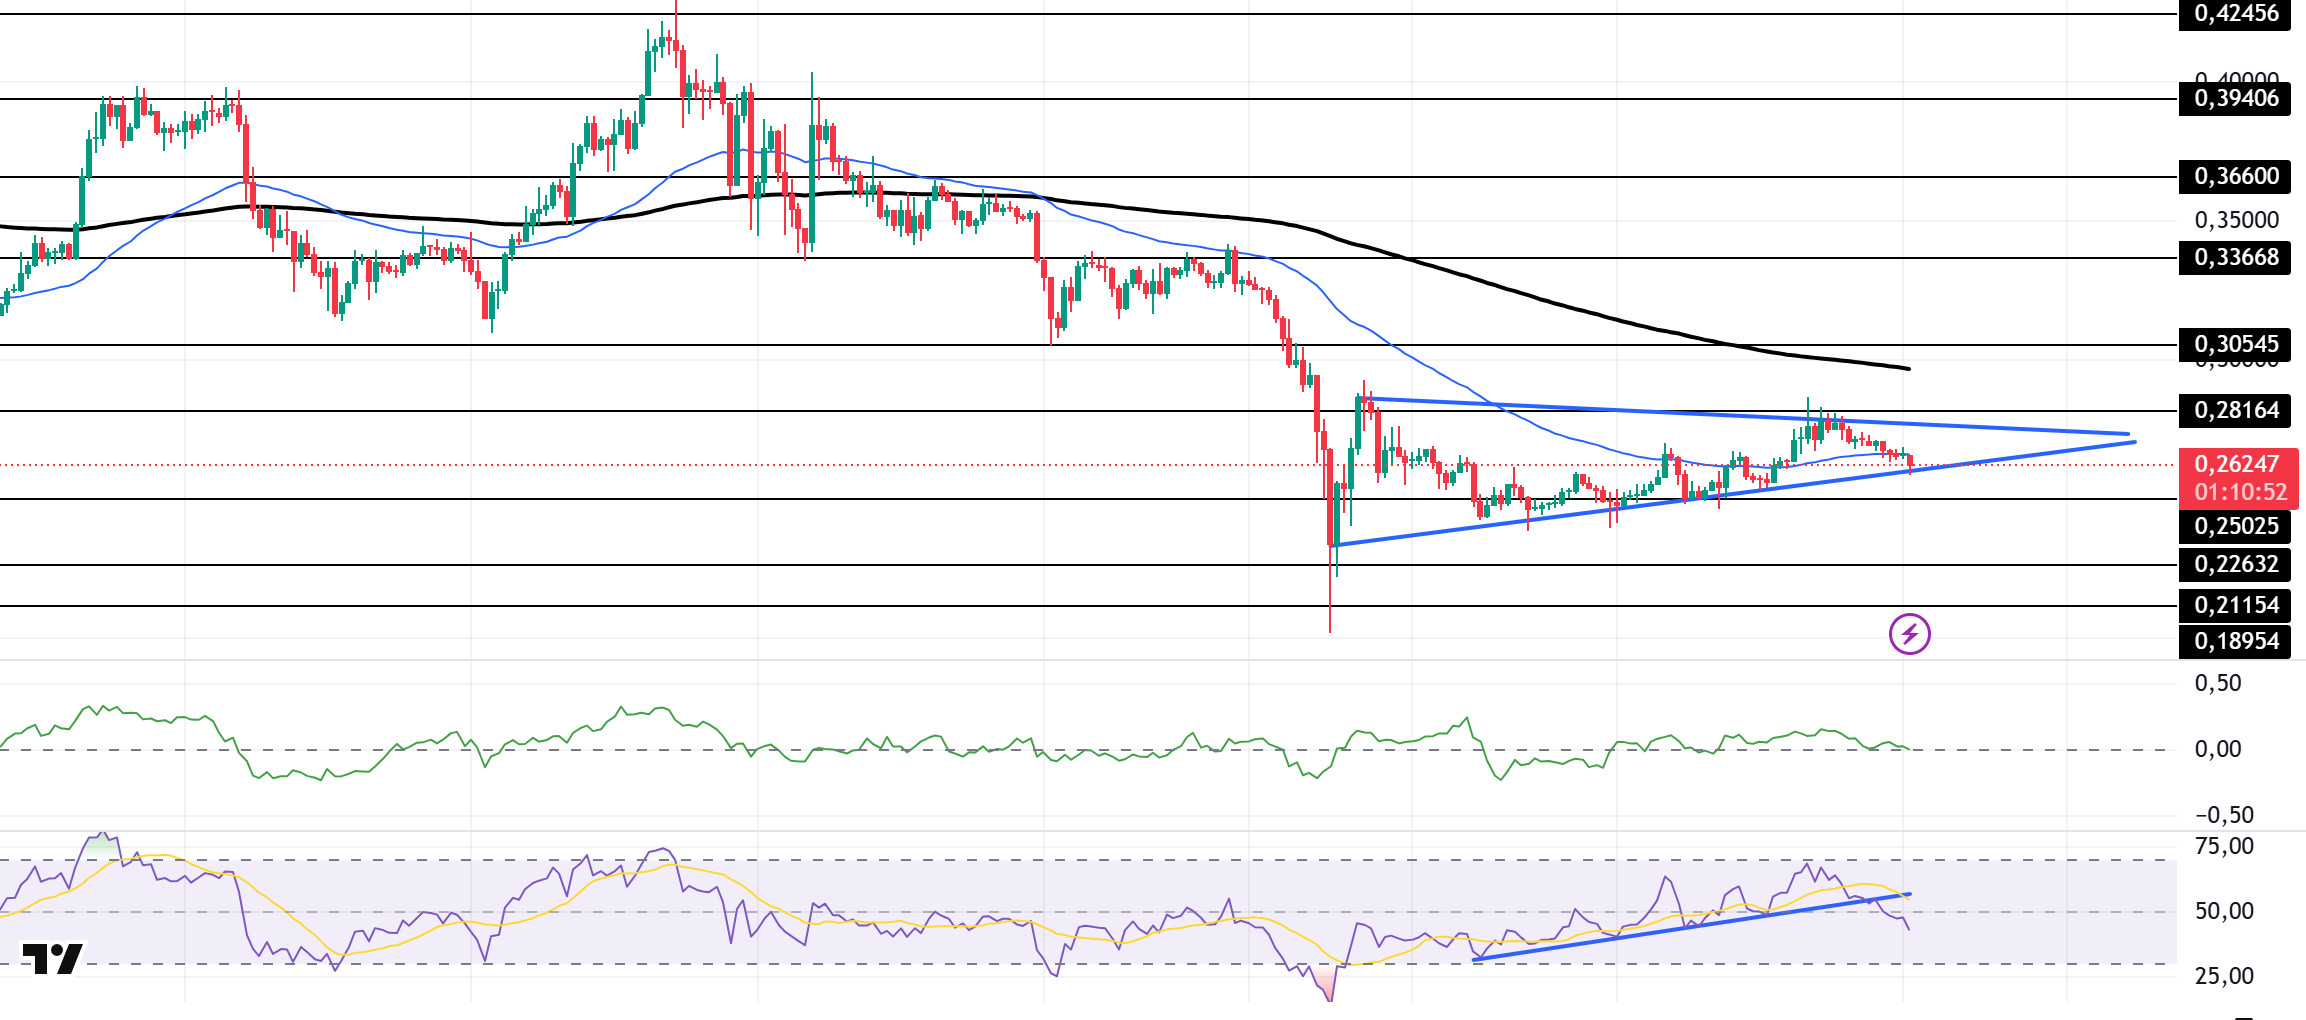
DOGE/USDT
Betting markets are showing that the spot Dogecoin (DOGE) ETF has a higher probability of approval. According to Polymarket data, the chances of approval by the end of 2025 currently stand at 74%, up from 37% since Donald Trump’s inauguration. According to CoinGlass data, a total of $12.02 million was liquidated in the last 24 hours.
At the time of writing, DOGE is testing the base of the symmetrical triangle pattern. On the 4-hour timeframe, the 50 EMA (Blue Line) remains below the 200 EMA (Black Line). This could mean that the decline could deepen further in the medium term. At the same time, the price is hovering between two moving averages with a strong downside break of the 50 EMA (Blue Line). However, the larger gap between the two moving averages could further increase the probability of DOGE moving higher. The Chaikin Money Flow (CMF)20 indicator is in neutral territory and money inflows and outflows are balanced. Low volume and a balanced CMF may push the price higher. At the same time, Relative Strength Index (RSI)14 is near the mid-level of the negative zone and has broken the uptrend that started on February 6. The $0.33668 level is a very strong resistance point in the uptrend due to political reasons, macroeconomic data and innovations in the DOGE coin. In case of possible pullbacks due to political, macroeconomic reasons or negativities in the ecosystem, the base level of the trend, the $ 0.22632 level, is an important support. If the price reaches these support levels, a potential bullish opportunity may arise if momentum increases.
Supports 0.25025 – 0.22632 – 0.21154
Resistances 0.28164 – 0.30545 – 0.33668
LEGAL NOTICE
The investment information, comments and recommendations contained herein do not constitute investment advice. Investment advisory services are provided individually by authorized institutions taking into account the risk and return preferences of individuals. The comments and recommendations contained herein are of a general nature. These recommendations may not be suitable for your financial situation and risk and return preferences. Therefore, making an investment decision based solely on the information contained herein may not produce results in line with your expectations.

