
BTC/USDT
Global markets and the crypto ecosystem are under the influence of critical macroeconomic data from the US. Non-farm payrolls data came in at 143K, below expectations (169K), while the unemployment rate came in at 4.0%, below forecasts (4.1%). Inflation indicators surprised on the upside; Producer Price Index (PPI) and Consumer Price Index (CPI) came in at 3.5% and 3%, respectively, beating expectations. FED Chairman Jerome Powell postponed the easing expectations by stating that there would be no rush to cut interest rates.
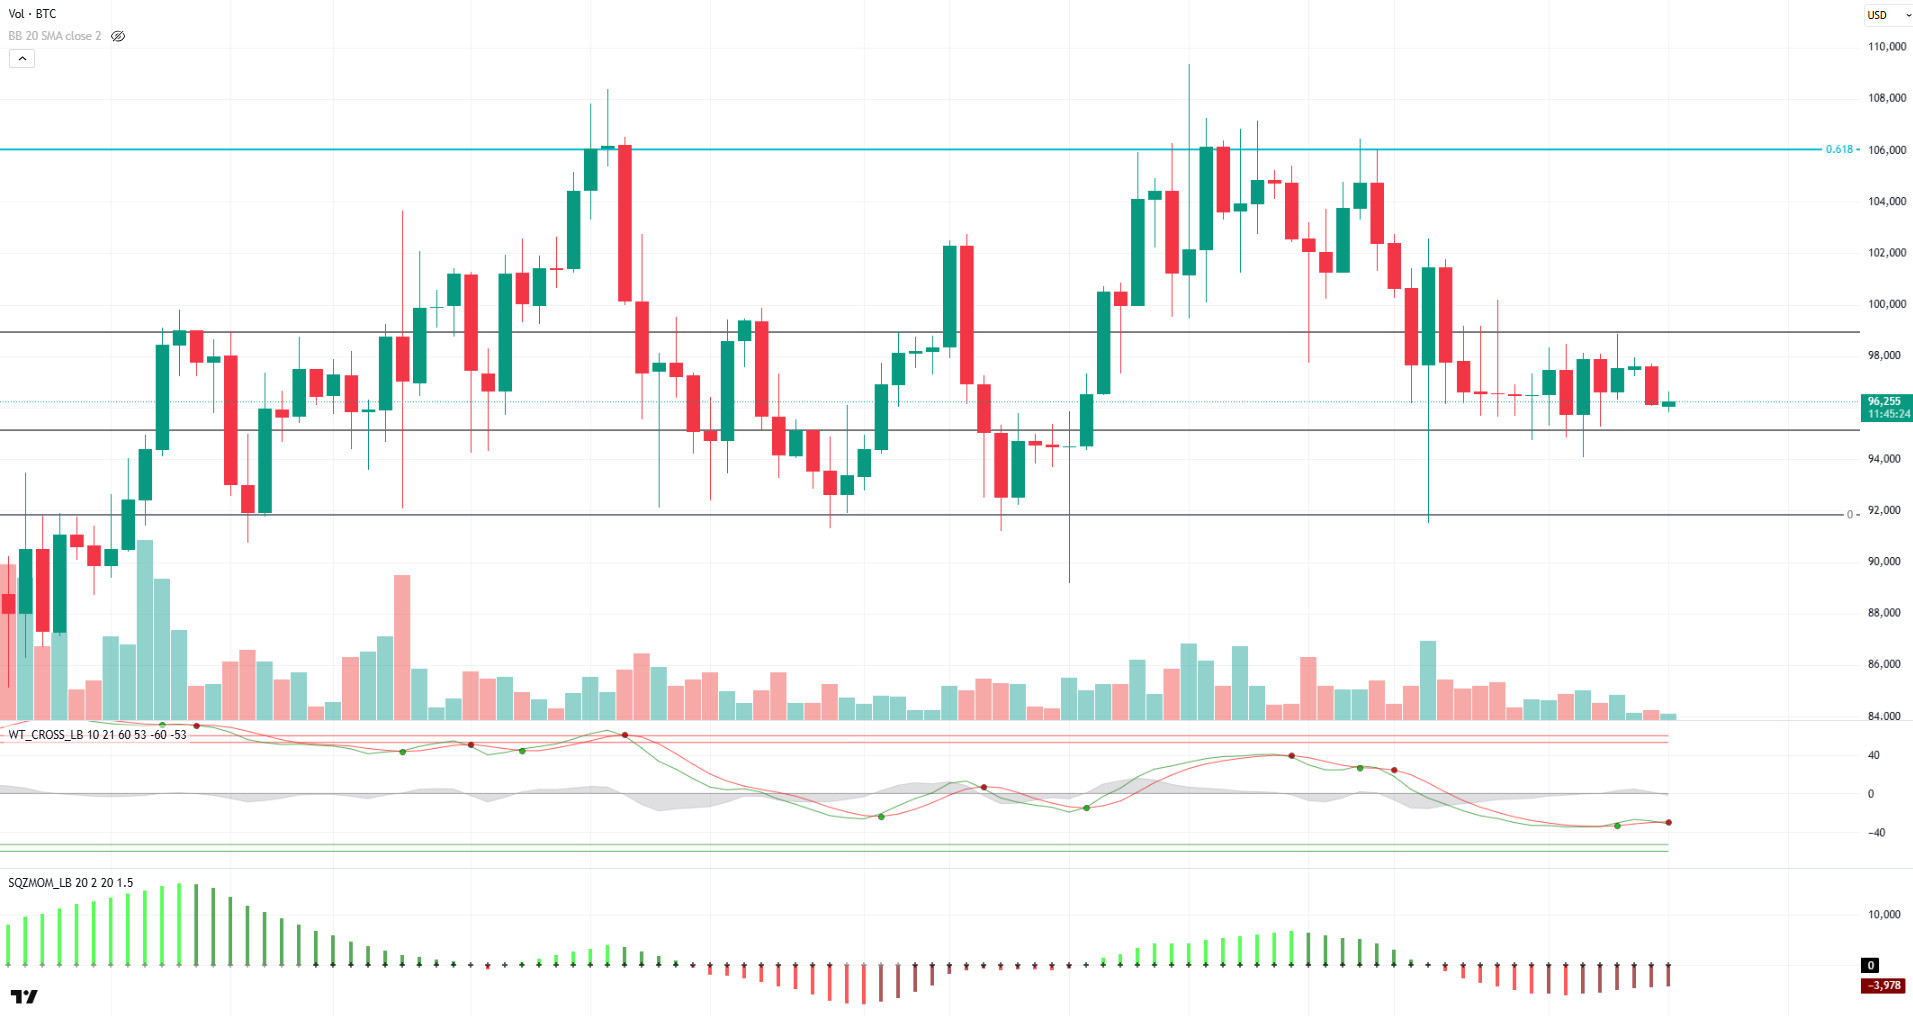
When we look at Bitcoin’s daily technical outlook, a small depreciation of 0.37% on a weekly basis stands out. BTC, which started the week at 97,700, fell to 95,000 levels from time to time, but managed to recover. Currently trading at 96,200, Bitcoin is moving in a horizontal band, while technical oscillators continue to suppress the price by generating sell signals near the oversold zone on the daily chart. Momentum indicators remain weak in the negative territory, while moving averages (MA20, MA50 and MA100) confirm the sell signal. The 95,000 level stands out as a critical reference point for the price to remain in positive territory, while pricing below this level may increase selling pressure and lead to deeper declines.
Supports 95,000 – 92,800 – 90,000
Resistances 98,800 – 99,100 – 101,400
ETH/USDT
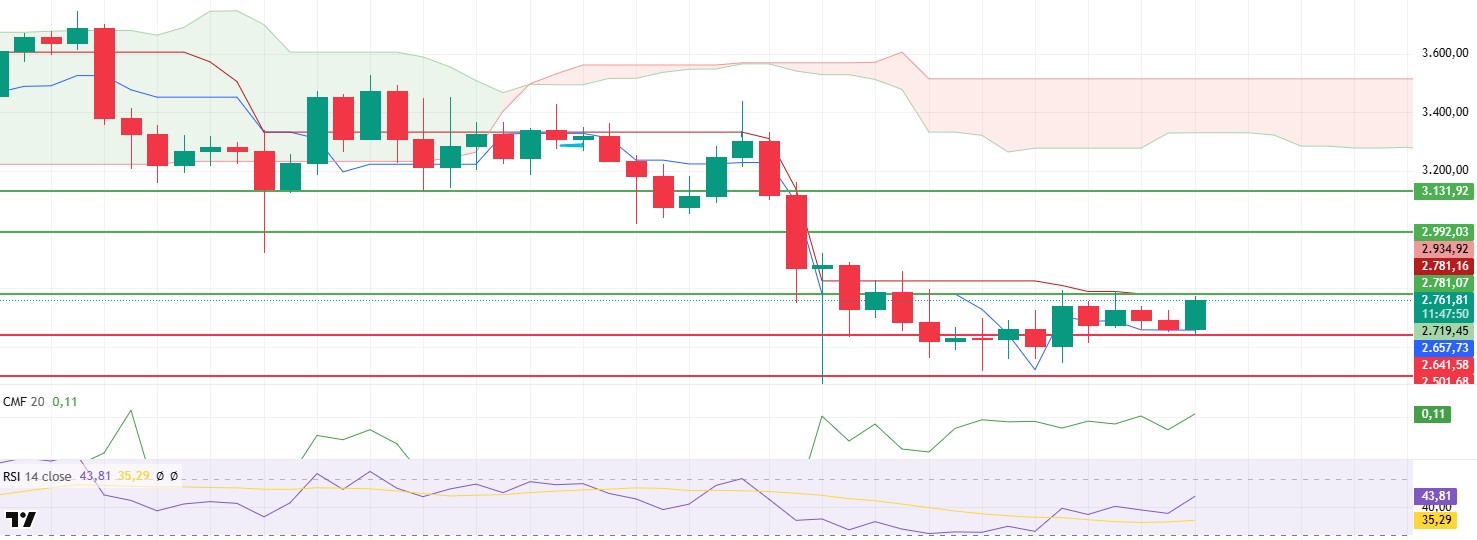
Last week, following the NYSE’s application to the US Securities and Exchange Commission (SEC) for ETH staking in Grayscale’s spot Ether ETFs, the ETH price, which has been under pressure for a long time, started to observe upward movements. ETH, which has been trading in a narrow price range between $2,501 and $2,781 for about 12 days , made a strong start to the new week and rose above the $2,700 level again, despite closing the weekend negatively. However, on-chain activity has weakened in line with the overall bearish trend in the markets. Especially in the NFT and DeFi ecosystems, it is noteworthy that the lowest activity levels in recent months have been reached.
When technical indicators are analyzed, there are important signals that the current movement in ETH price is gaining strength. The fact that the Relative Strength Index (RSI) indicator is starting a new uptrend by exceeding the previous peak levels stands out as an important technical development indicating that the momentum is accelerating upwards. Cumulative Volume Delta (CVD) analysis reveals that the price declines over the last week were mainly driven by the futures market, while the recent uptrend was supported by the spot market. This can be considered as a critical factor indicating that the price action is proceeding on a healthier ground. When the Ichimoku indicator is analyzed, while the positioning of the price above the tenkan level exhibits a positive structure, the fact that the $ 2,781 level also intersects with the kijun makes it critical to exceed this resistance point. Price movements above this level could allow the rise to continue more aggressively. The fact that the Chaikin Money Flow (CMF) indicator has been on the rise after remaining flat in recent days can be considered as another important indicator that the liquidity entering the market has started to strengthen.
Taking all these technical indicators and current news flows together, ETH is expected to exhibit an upward momentum throughout the week. In particular, daily closes above the $2,781 level could pave the way for price movements to continue upwards in a more drastic and decisive manner. In contrast, while the $2,501 level remains the main support zone, a downside break of this level could weaken the current structure and trigger deeper retracements.
Supports 2,641 – 2,501 – 2,368
Resistances 2,781 – 2,881 – 2,992
XRP/USDT
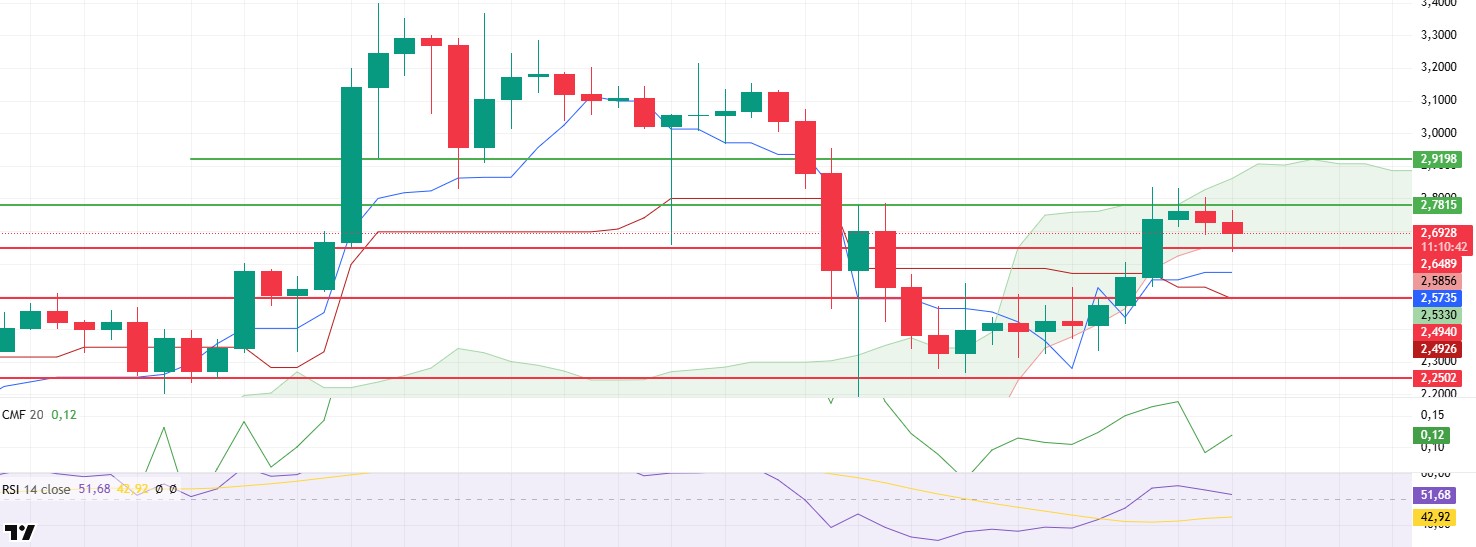
With the US Securities and Exchange Commission (SEC) officially accepting the DOGE and XRP ETF applications made by Grayscale, XRP exhibited a significant rise. Following this development, XRP broke through two critical resistance levels and managed to rise above the $2.78 level. However, selling pressure in this region caused the price to retreat again, leading to a correction to the kumo cloud support at the $ 2.64 level. At this point, it is seen that buyers have come into play and it is observed that the price has received support from this region.
When technical indicators are analyzed, it is noteworthy that there is a positive divergence in the Chaikin Money Flow (CMF) indicator, indicating that the entering liquidity supports the upward movement and constitutes an important signal in terms of maintaining the upward momentum. At the same time, looking at the ichimoku indicator, the buy signal formed by the intersection of tenkan and kijun levels is seen as another important factor that reinforces the positive trend in the technical outlook. Taken together with the reaction from the Kumo cloud, these factors indicate that XRP is on a positive ground in terms of short-term price movements.
As long as the current technical structure is maintained, the XRP price can be expected to continue its upward trend as long as it remains above the sand cloud support at the $2.68 level. In this context, the $2.78 level stands out as the first critical resistance point, while exceeding the $2.92 level, which is the upper band of the sand cloud in the broader perspective, could lead to further acceleration of the uptrend and trigger a sharp upward movement. On the other hand, in case the price dips below the $2.68 level, the possibility of a pullback to the $2.49 levels will increase. Therefore, whether the XRP price can hold above these support levels will be one of the most critical factors that will determine the direction of the trend in the coming period.
Supports 2.6486 – 2.4940 – 2.2502
Resistances 2.7815 – 2.9198 – 3.1567
SOL/USDT
Last week, the US Securities and Exchange Commission accepted the application for a Solana-based exchange-traded fund, officially starting the countdown to approval or rejection. The regulator has until October 2025 to make its final decision. At the same time, CBOE reported that it officially accepted the listing application for the Spot Solana (SOL) ETF submitted by BZX Exchange and that the applicants are 21Shares, Bitwe, Canary Capital and Vaneck. However, Franklin Templeton, which manages more than $1.2 trillion in assets, has applied for a “Franklin Solana Trust” in Delaware. Coinbase derivatives are preparing to launch the SOL futures contract product later this month. Accordingly, the product will be launched on February 18 based on self-certification. On the other hand, Solana validators will now receive 100% of the priority fees instead of 50% under the new model. Under the previous fee distribution model, Solana validators only received 50% of the network’s priority fees, with the remaining 50% being burned. Taurus launches Solana-based custody and tokenization platform for banks. Deutsche Bank-backed Taurus has launched a Solana-based custody and tokenization platform that allows banks to issue and manage digital assets. On the Onchain side, starting this month, the crypto market will unlock 15.7 million SOLs worth around $3 billion over the next three months. According to data from Glassnode, more than 5 million new addresses are created on the chain every day. Solana’s all-time inbound bridge volume since 2021 has exceeded $10.1 billion, a 114% increase compared to its total volume of $4.7 billion through February 2024. On the other hand, Doodles, one of Ethereum’s largest NFT brands, chose to launch its official token, DOOD, on the Solana network.
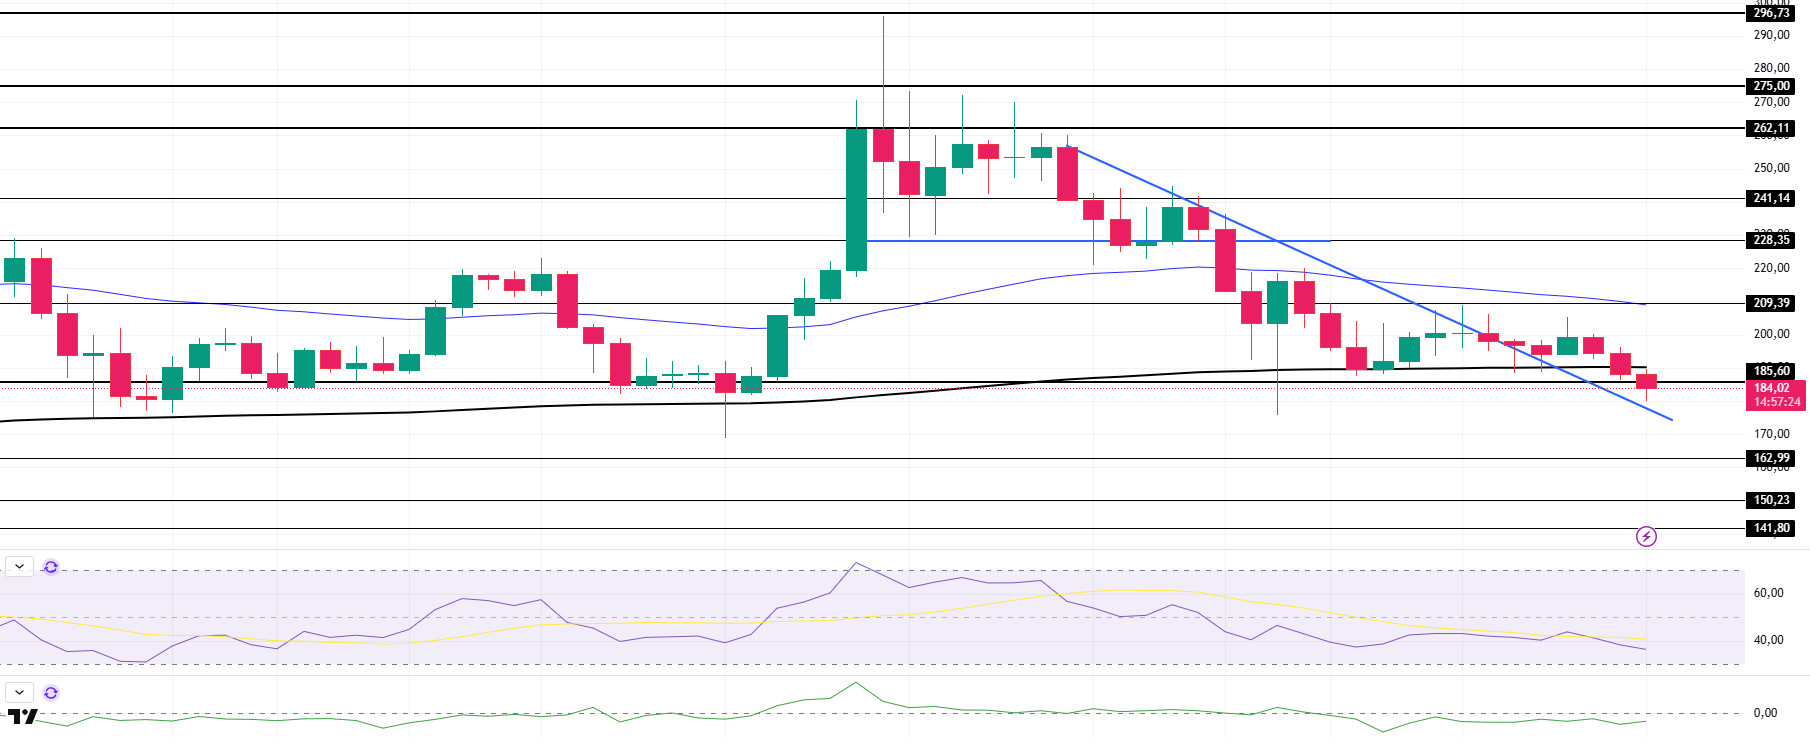
SOL continues to exhibit declines in line with the broader market. The price is below the 50 EMA (Blue Line) and the 200 EMA. As a matter of fact, the asset tested the 200 EMA (Black Line) level twice but failed to hold strong and continued its decline. On our daily chart, the 50 EMA (Blue Line) continues to be above the 200 EMA (Black Line). This shows that the trend is bullish in the medium term, but the difference between the two averages is about 10%, which could keep the price retracement going. Although it broke the January 26 downtrend to the upside, it may use the continuation of this trend as support. Relative Strength Index (RSI) 14 is located near the oversold level of the negative zone. However, when we examine the Chaikin Money Flow (CMF)20 indicator, it is close to the neutral zone and money inflows and outflows are balanced. If the positive results in macroeconomic data and positive developments in the ecosystem continue, it may test the first major resistance level of $ 209.39. In case of negative news from macroeconomic data or the Solana ecosystem, the $ 162.99 level can be followed and a buying point can be determined.
Supports 162.99 – 150.23 – 141.80
Resistances 185.60 – 209.39 – 228.35
DOGE/USDT
The US SEC accepted Grayscale’s 19b-4 application for a Dogecoin ETF, paving the way for the potential approval of the fund. Brian Armstrong, CEO of a US-based exchange, called for blockchain-based transparency at the US Treasury after DOGE revealed a $100 billion spending gap.
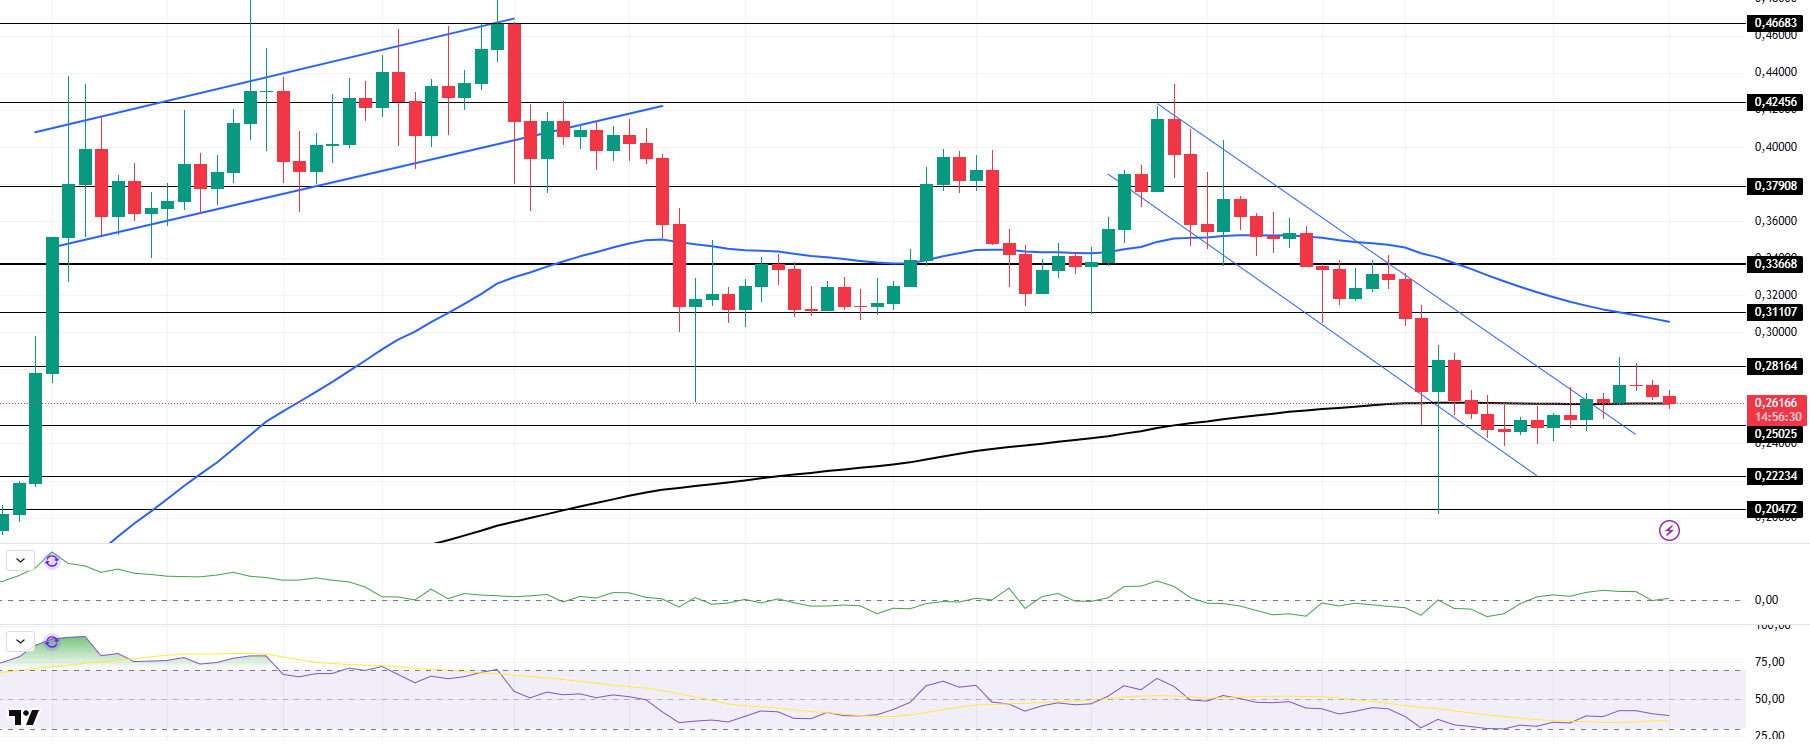
Looking at the daily chart, the asset, which has been in a downtrend since January 17, continued its decline and fell to the level of $ 0.25025. It is currently testing the 200 EMA (Black Line) as support. Although the 50 EMA (Blue Line) remains above the 200 EMA (Black Line), indicating that the bull continues for the asset, the difference between the two averages is about 16.90%, which may increase the probability of continuing to fall. If this bearish momentum continues, the asset may test the $0.20472 level once again. When we look at the Chaikin Money Flow (CMF)20 indicator, although it is in the neutral zone, the low volume indicates that there may be a price increase. However, money inflows and outflows are balanced. Relative Strength Index (RSI)14, on the other hand, found value at the middle level of the selling zone. In case of possible macroeconomic conditions and negative developments in the ecosystem and retracements, the level of 0.20472 dollars can be followed as a strong support. In case the retracement ends and the rises begin, the 0.33668-dollar level should be followed as a strong resistance.
Supports: 0.25025 – 0.22234 – 0.20472
Resistances: 0.28164 – 0.31107 – 0.33668
TRX/USDT
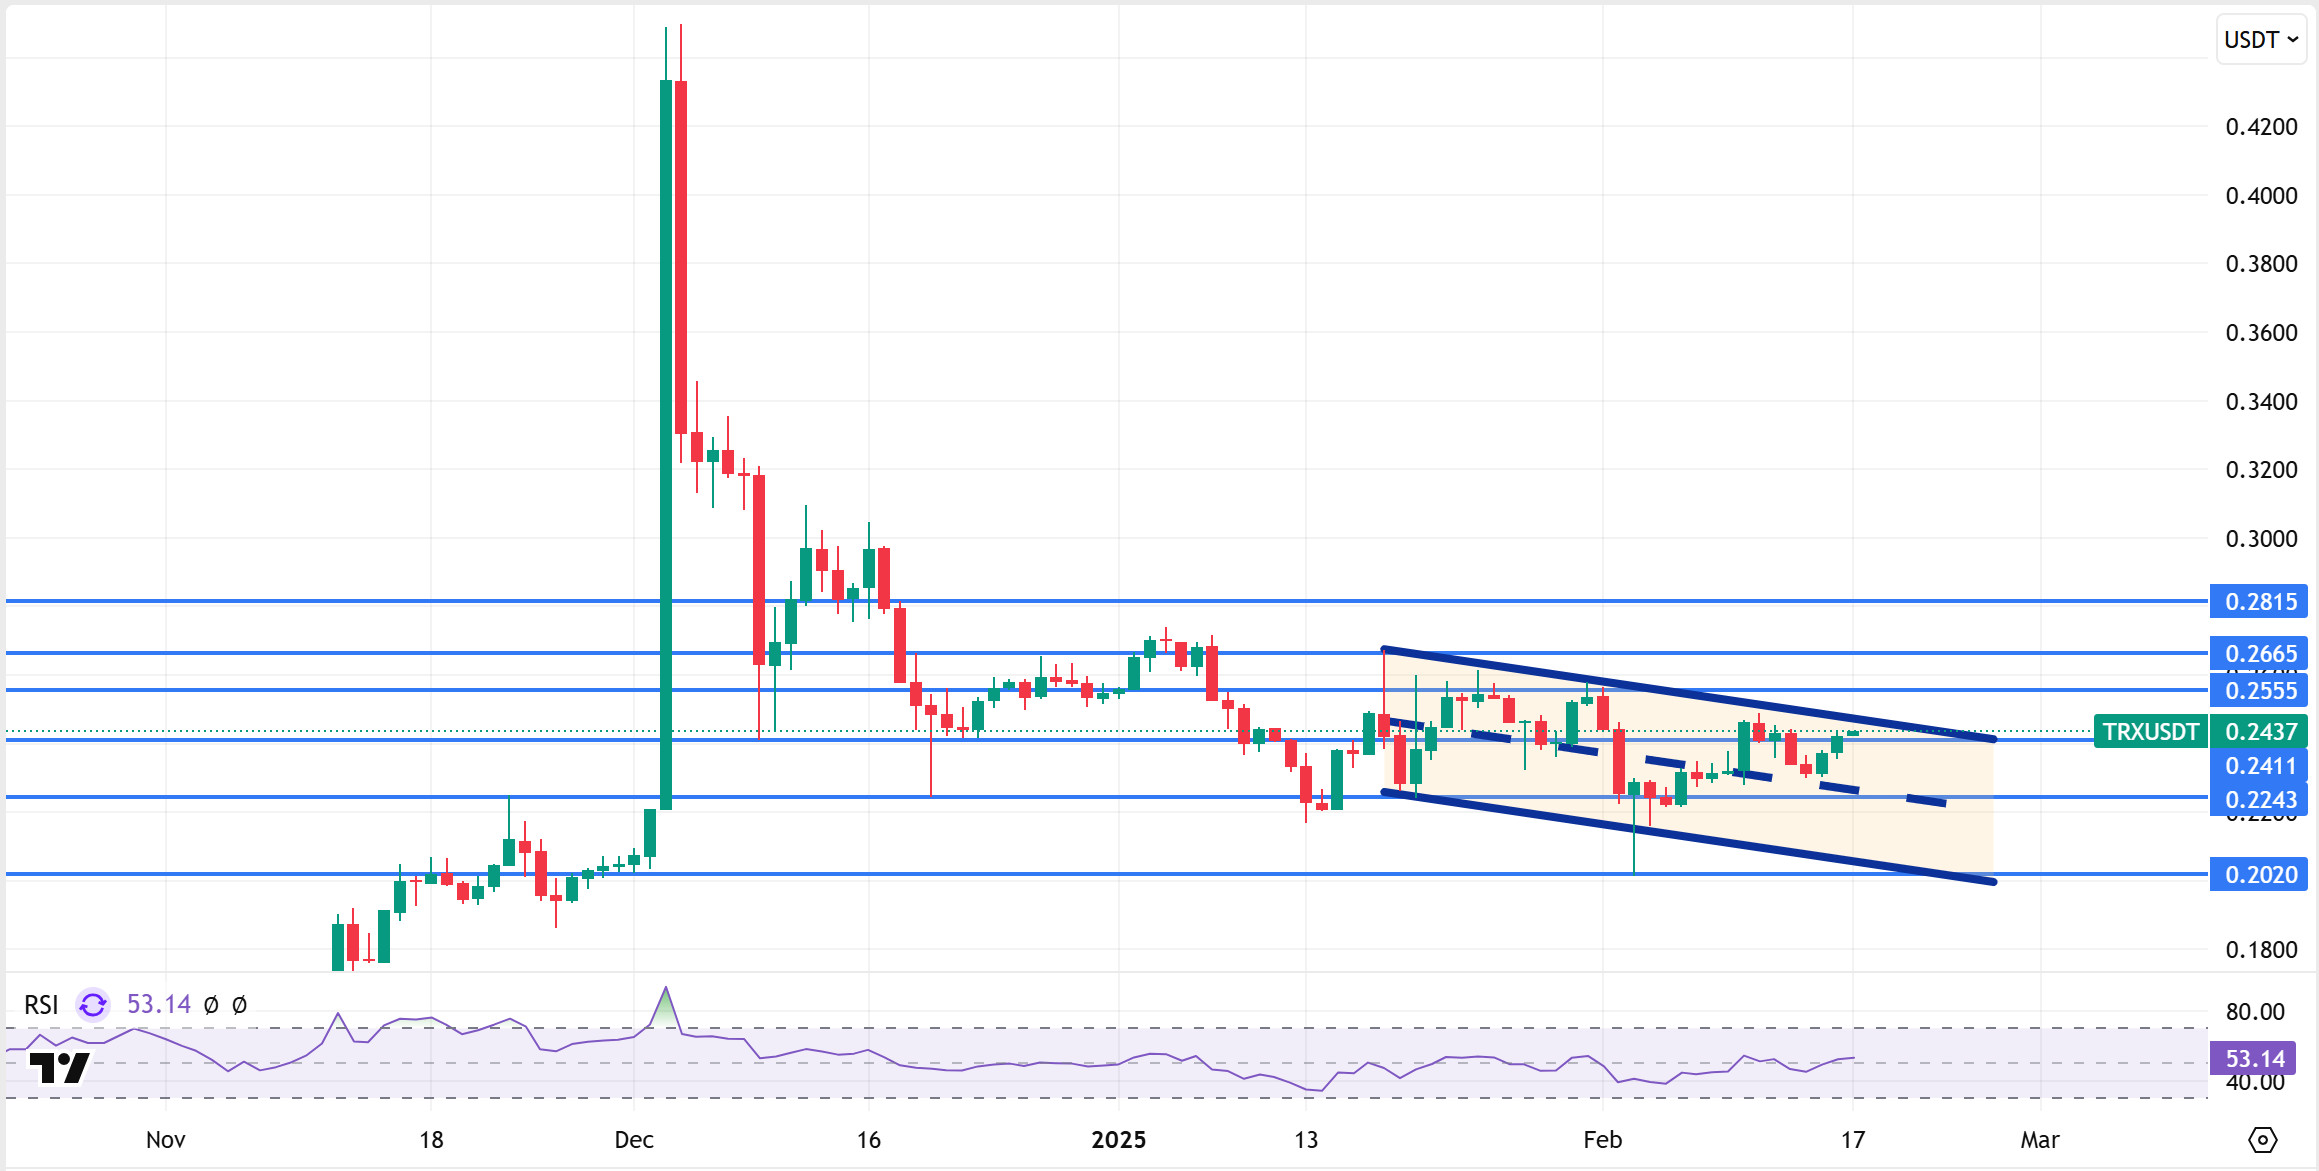
TRX, which started last week at 0.2322, rose about 4.5% during the week and closed the week at 0.2423. This week, US unemployment claims, Philadelphia Fed manufacturing index, manufacturing purchasing managers index, services purchasing managers index and FOMC meeting minutes will be released. In particular, the market will closely follow the unemployment benefit claims data. If this data is announced above expectations, it may be priced positively by the market.
TRX, currently trading at 0.2437, is in the upper band of the bearish channel on the daily chart. With a Relative Strength Index value of 53, it can be expected to move towards the bearish channel middle band by falling slightly from its current level. In such a case, it may test the 0.2243 support. If it cannot close daily under the support of 0.2243, it may increase with the possible buying reaction and move back to the upper band of the channel. In such a case, it may test 0.2555 resistance. As long as it stays above 0.2020 support on the daily chart, the bullish demand may continue. If this support is broken, selling pressure may increase.
Supports 0.2411 – 0.2243 – 0.2020
Resistances 0.2555- 0.2665 – 0.2815
AVAX/USDT
After trading at $24.86 on the opening day of last week, AVAX experienced slight fluctuations and closed the week almost unchanged at $24.84. The ongoing uncertainties in global markets and fluctuations in investors’ risk appetite led to a quiet week of low volatility in the crypto market.
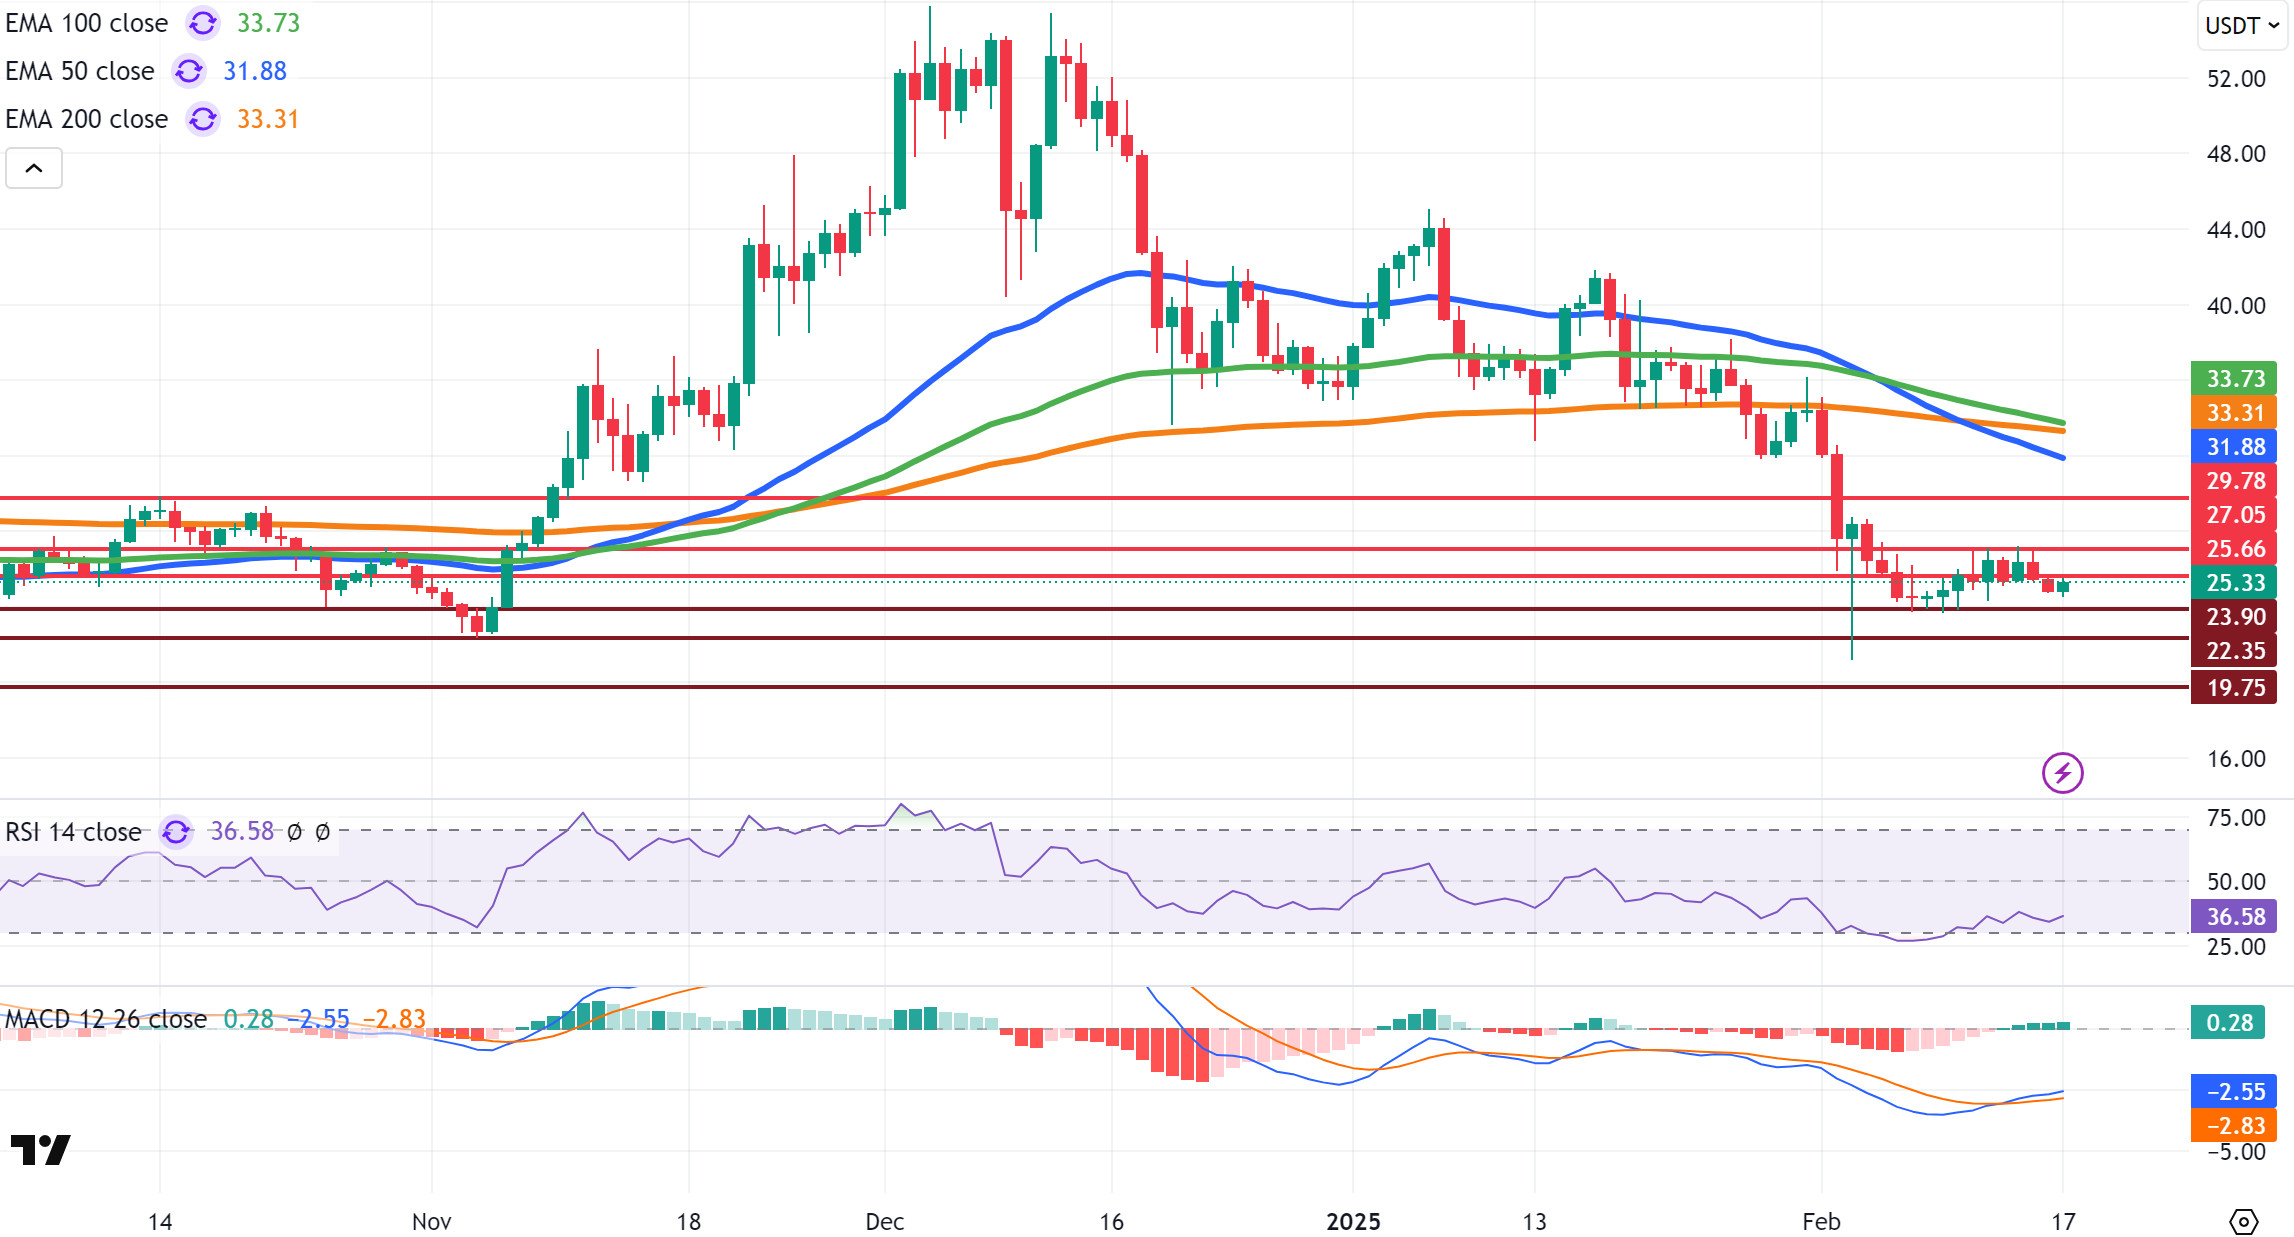
The Moving Average Convergence/Divergence (MACD) indicator is moving above the signal line, indicating that the negative momentum is starting to weaken but the selling pressure has not fully broken. The Relative Strength Index (RSI) is at 36.58. This value indicates a move slightly above the oversold zone and could signal a rebound. If the MACD indicator continues its rise above the signal line towards the positive zone, AVAX may retest the $25.66 resistance level. If this level is broken, it could continue its ascent towards the resistance levels of $27.05 and then $29.78. On the contrary, if the MACD indicator cuts the signal line downwards with its downward movement, it may test the $23.90 support level. If this support is broken, there may be a decline to $ 22.35 and then $ 19.75.
AVAX is trading well below the critical Exponential Moving Average (EMA) levels, namely the EMA50 (31.88), EMA100 (33.73) and EMA200 (33.31). This suggests that the price continues to remain in an overall downtrend and that an upside move could face strong resistances . Especially below the EMA50, the price’s recovery may be limited in the short term. However, as the RSI indicator is close to the oversold zone, there is a possibility of an upward movement with reaction buying in the short term.
(EMA50: Blue Line , EMA100: Green Line , EMA200: Orange Line)
Supports 23.90 – 22.35 – 19.75
Resistances 25.66 – 27.05 – 29.78
SHIB/USDT
Last week, the SHIB community burned 58.3 million tokens and removed them from circulation. In the same period, 144.29 billion tokens were withdrawn from a newly created wallet on Coinbase, suggesting strategic moves by major investors. In addition, the Shiba Inu team is working hard on the Shib Metaverse project, aiming to overcome the meme coin image. This project aims to build an innovative virtual world where users can manage their digital assets and integrate gaming and social interactions.
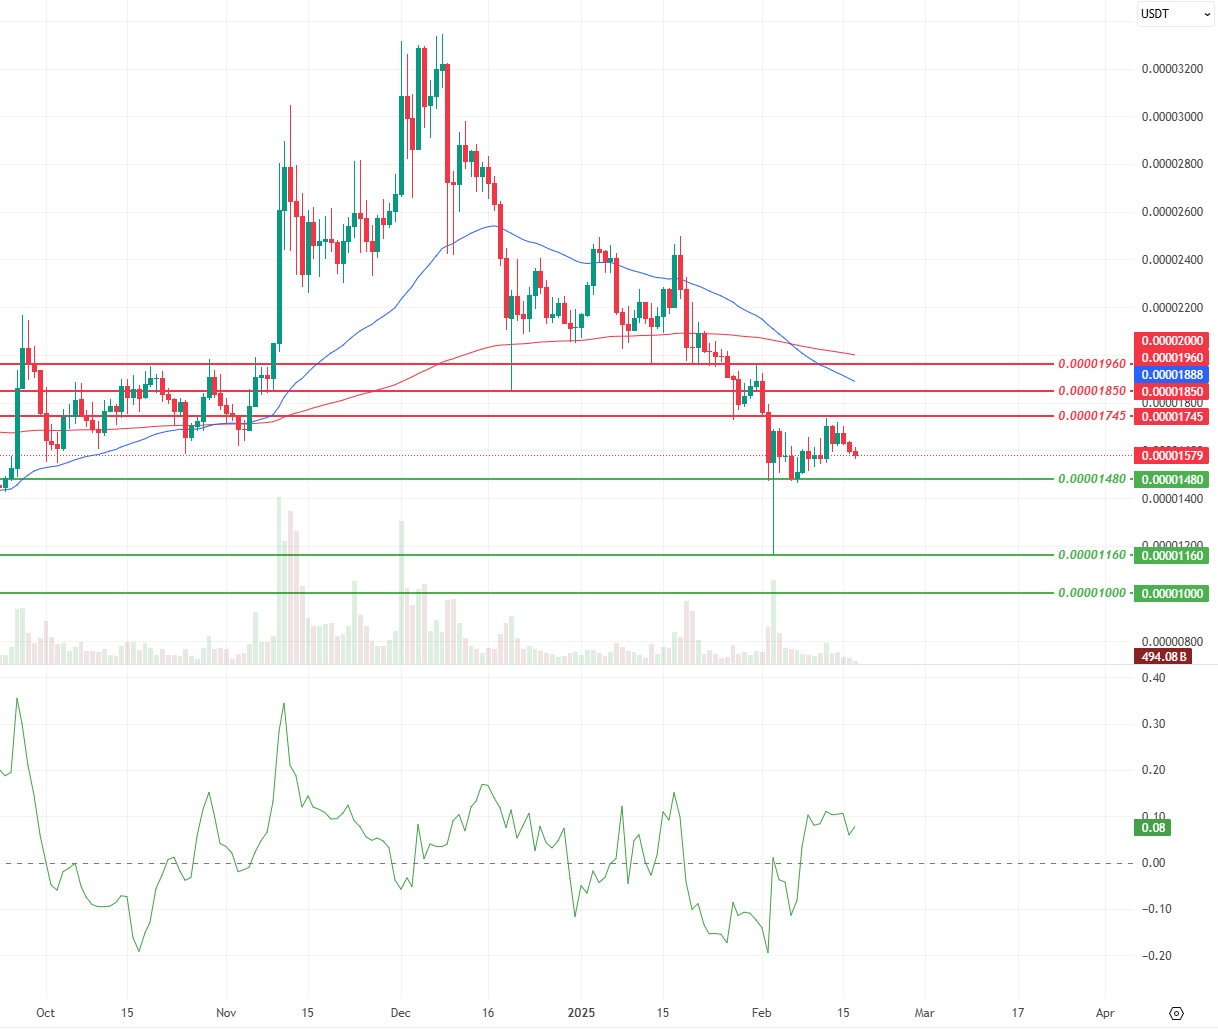
In the technical analysis of Shiba Inu (SHIB), the price started to fall from $0.00001745 levels last week after the EMA50 (Blue Line) broke below the EMA200 (Red Line). Despite the increasing momentum and trading volume, the price was rejected at the resistance level. Signals from the Chaikin Money Flow (CMF) oscillator suggest that the buyer pressure continues. Against this backdrop, as long as the price remains above $0.00001480, it will aim to overcome the selling pressure at $0.00001745. However, if the price breaks the $0.000010480 support level down and provides persistence, a retracement towards the next support level of $0.00001160 can be expected.
Supports 0.00001480 – 0.00001160 – 0.00001000
Resistances 0.00001745 – 0.00001850 – 0.00001960
LTC/USDT
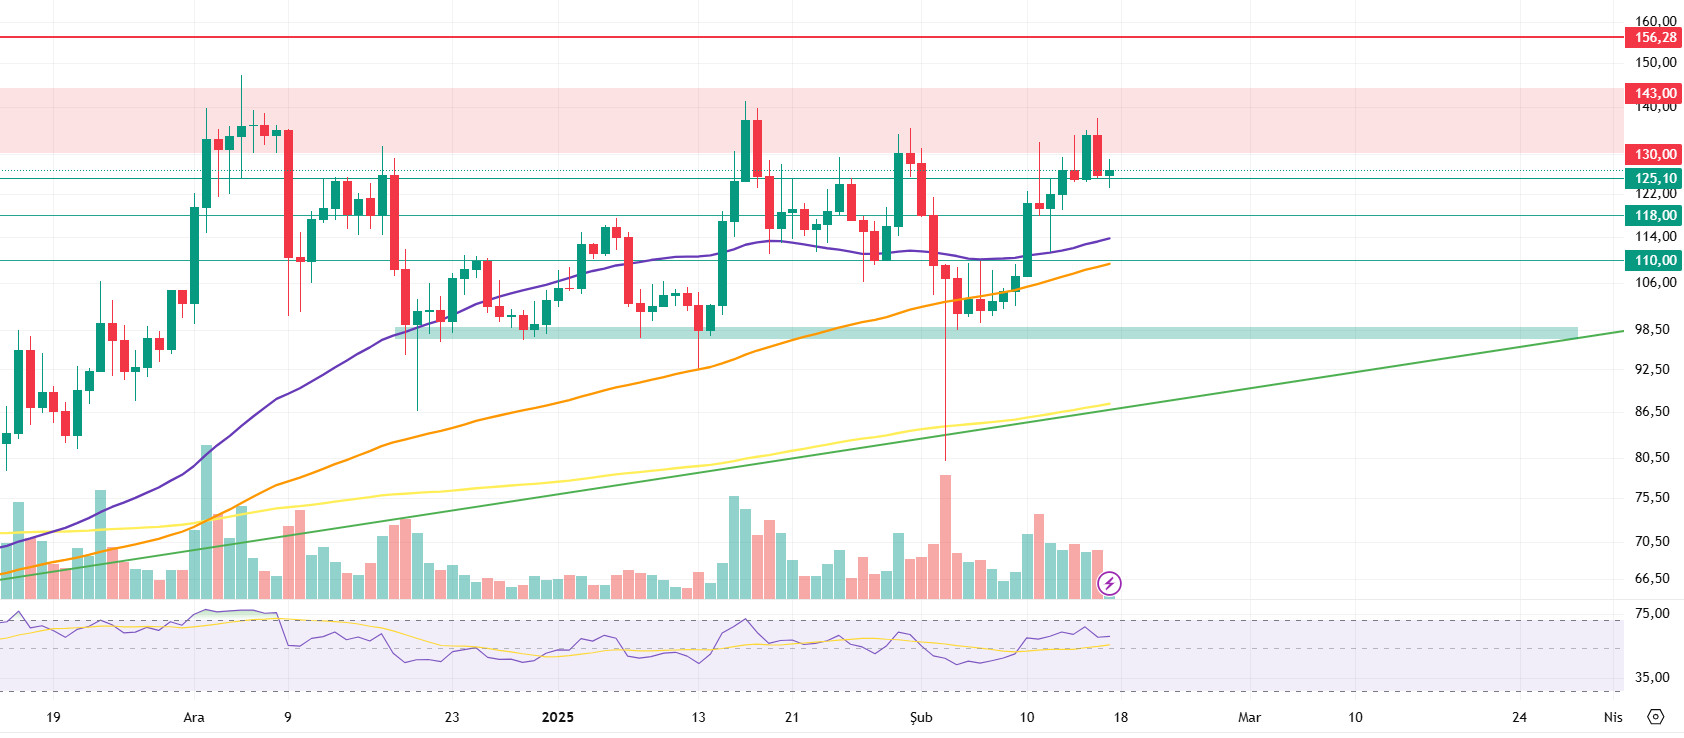
Litecoin, which has risen by 17.27% in the past week, rose from 19th to 15th place in the market capitalization rankings. In the same period (according to Arkham data), the amount of open positions in futures increased from $310 million to $415 million, while funding rates in futures markets are also following a positive trend.
Litecoin’s daily chart shows that the price is above all 50, 100 and 200-period moving averages. It is also noteworthy that a positive start to the week has been made, with the 118.00 and 125.10 levels, which were seen as resistance in the previous week, exceeded, making these levels potential supports. In the first downward movements, 125.10 and 118.00 levels can be monitored as intermediate support points. The main support point can be envisaged as 110.00 level. In case this level is also lost, the potential for a pullback towards the main trend support should not be ignored. If the positive course of the week continues, selling pressure is likely to continue at the important resistance level between the 130.00-143.00 band. If this resistance level is broken, we could see a move towards the trend-based Fibonacci resistance at 156.28. However, this level also stands out as an area where selling pressure may increase again and the price may remain under pressure towards the upper part of the red band.
Resistances 110.00 – 118.00 – 125.10
Supports: 130.00 – 143.00 – 156.28
LINK/USDT
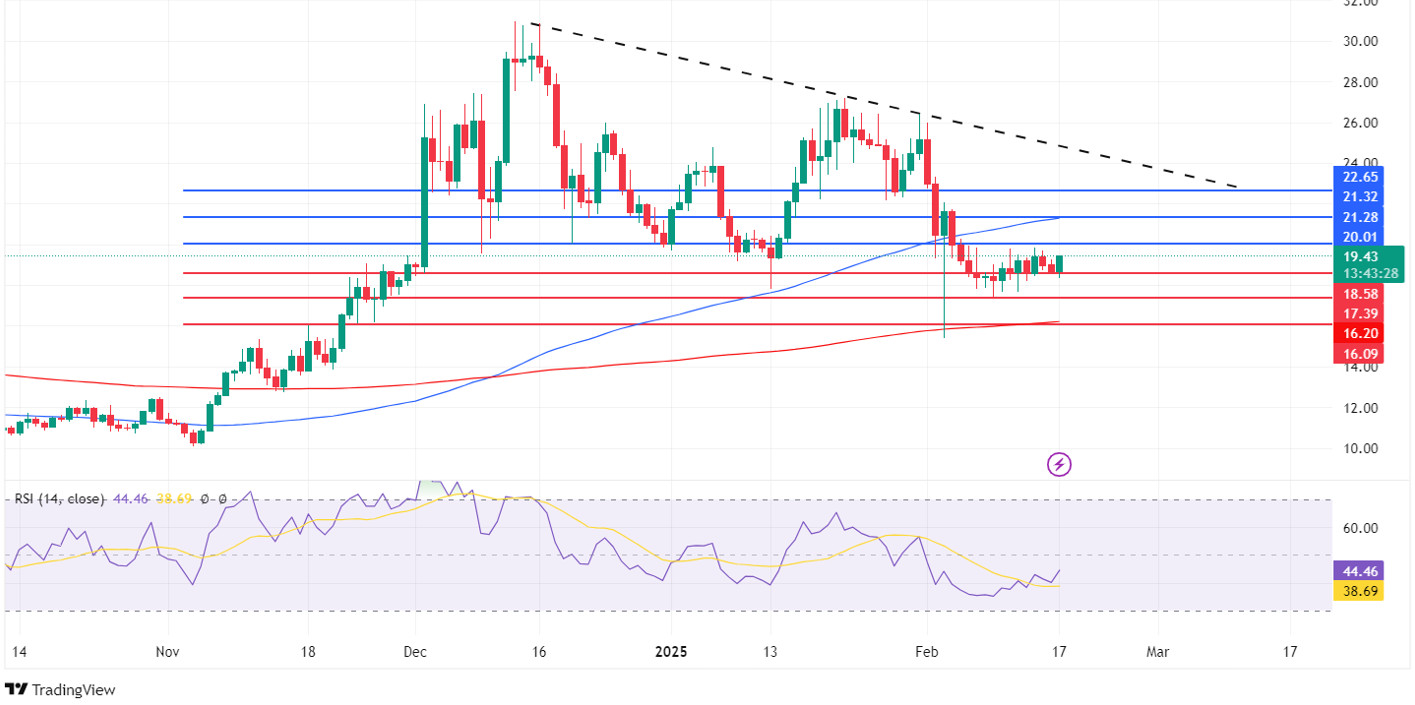
LINK price is stuck between the falling trendline and horizontal support-resistance levels. In recent price action, the price experienced strong volatility, falling as low as $17.39 and then staging a short-term rebound to reach $19.43. Currently, the price is trading just below the $20.01 resistance.
In downward movements, the $ 18.58 level stands out as a strong support. Below this level, the supports of $ 17.39 and $ 16.20 should be followed. In particular, the $ 16.09 level is critical as both long-term support and a psychological threshold. If this region is lost, selling pressure may increase and push the price into a deeper correction. In upward movements, the $ 20.01 level is the first resistance point and the price is currently trading close to this level. Above it, the $ 21.28 – $ 21.32 levels stand out as both horizontal resistance and points where the price has previously reacted. The $22.65 level should be followed as the most important resistance zone that coincides with the falling trend line. If this level is breached, a strong signal for a trend reversal may be received and the price is likely to start a move towards the $ 24.00 level
The RSI indicator is at 44.46 and is still in the neutral-lower zone. The inability of the RSI to break above 50 suggests that the buying appetite in the market is weak. The 100-day moving average (SMA100) is at $21.32, which is an extra resistance for the price. In the overall structure, a short-term rebound may be possible if the $18.58 level is sustained but exceeding the $20.01 and $21.32 levels will strengthen the bullish scenario. Otherwise, breaking the support levels may increase selling pressure and cause the price to deepen towards the $16.09 level.
(SMA200: Red Line, SMA100: Blue Line)
Supports 18.58 – 17.39 – 16.09
Resistances 20.01 – 21.32 – 22.65
BNB/USDT
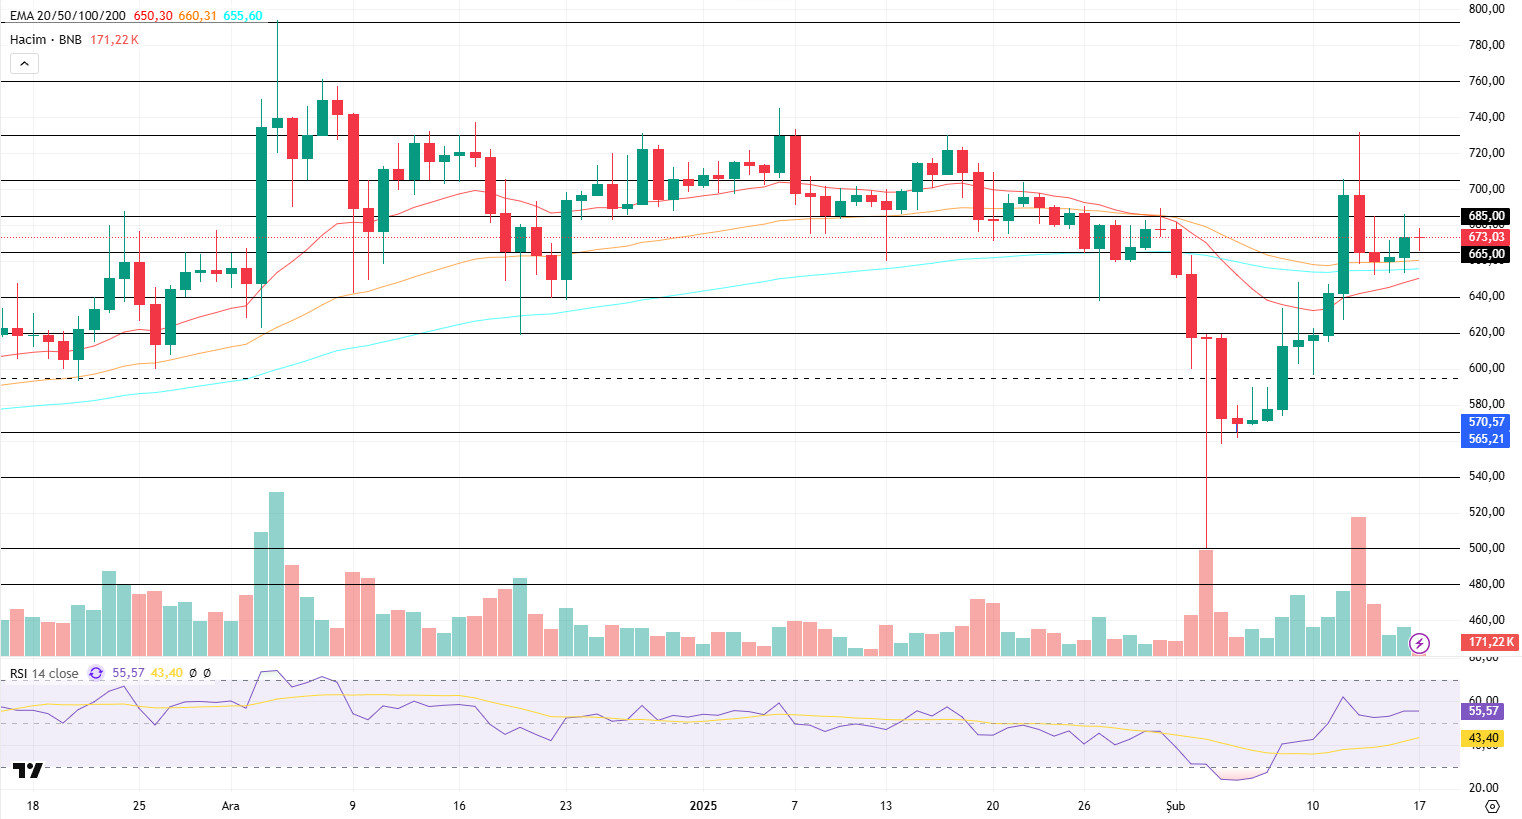
At the beginning of last week (Monday, February 10), BNB/USDT, which started to rise with the support it received from the $595 level, closed the week just below the $620 level. Continuing its positive momentum in the following days, the asset surpassed the $ 620 level and rose to $ 725. However, it faced selling pressure at this level and realized a price correction to the EMA 50 ($ 660) and EMA 100 ($ 665) levels. Despite this pullback, BNB/USDT maintained its positive outlook on a weekly basis with support from these levels.
The asset, which showed a limited decline with the start of the new week, is moving in the range of $665 – $685. In addition, BNB/USDT continues its positive outlook by trading above the EMA 20, EMA 50 and EMA 100 levels.
Volume indicators show that positive candle formations, along with increased buying support as of February 15, have boosted buying volume. In this case, a strong trading volume is needed for the price to gain bullish momentum as of the new week. The RSI indicator, on the other hand, has risen above the 50 level in line with price movements. The fact that the RSI remains above this level indicates that buying activity may continue.
If the limited negative momentum observed at the beginning of the new week continues, the price is expected to fall to the $665 level first. If the $665 level is broken down, there is a possibility that it may fall towards the $640 and $620 levels, respectively. On the other hand, if support is encountered at the $ 665 level, the price is likely to rise to $ 685 again. If the $ 685 level is broken upwards, the $ 705 and $ 725 levels will be monitored as new resistance zones.
Supports 665 – 640 – 620
Resistances 685 – 705 – 725
ADA/USDT
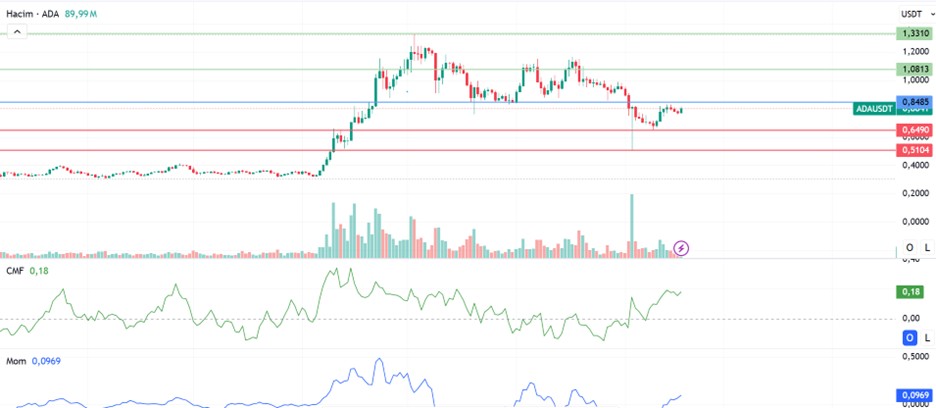
In the last 1 week, Cardano has risen 14% from 0.6662 to 0.8375 in one week. Dominance recorded a 0.89% increase in value and ranked 5th among cryptocurrencies with a Market Cap of 28.46 B. It continues to approach the bullish channel resistance level of $ 0.8485, testing the support zone, its lowest level since last week, and breaking upwards from the level of $ 0.6490. In particular, ADA’s ETF application news and refund program are among the most important factors that triggered the rise in price movements by encouraging daily consumers to interact with the Cardano ecosystem.
Technically, the Chaikin Money Flow (CMF) oscillator suggests that the selling pressure in the market has subsided and there is a bullish bias towards buying. Momentum, on the other hand, is approaching 0.10 levels, indicating a potential turnaround for a bullish move. When the overall picture is evaluated, it is seen that it gives positive signals for bullishness. Accordingly, if the 0.8485 (Green Line) level is crossed on the chart, the 1.0814 resistance level can be retested and the second resistance zones of 1.2268 and 1.3310 dollars can be targeted within the increase in purchases. If ADA prices the news that Trump will suddenly announce this week, the support levels we will follow may be the 0.6558- and 0.5208-dollar band.
Supports 0.5104 – 0.6490 – 0.7596
Resistances 0.8485 – 1.0813 – 1.1697
LEGAL NOTICE
The investment information, comments and recommendations contained in this document do not constitute investment advisory services. Investment advisory services are provided by authorized institutions on a personal basis, taking into account the risk and return preferences of individuals. The comments and recommendations contained in this document are of a general type. These recommendations may not be suitable for your financial situation and risk and return preferences. Therefore, making an investment decision based solely on the information contained in this document may not result in results that are in line with your expectations.