
BTC/USDT
When we look at the average purchase costs of Bitcoin holders, the general market cost is $95,000, $89,000 for ETF and security wallets, $59,000 for centralized exchange traders and $57,000 for miners. The cost base for long-term whales is calculated at $25,000. On the other hand, while the asset holding ratio in Bitcoin ETFs has reached 25-30%, this ratio is expected to increase to 40% like gold ETFs (GLD). This shows that there is still 10-15% growth potential in Bitcoin ETFs. When we look at the costing and ETF valuation, Bitcoin may show that its bullish path continues.
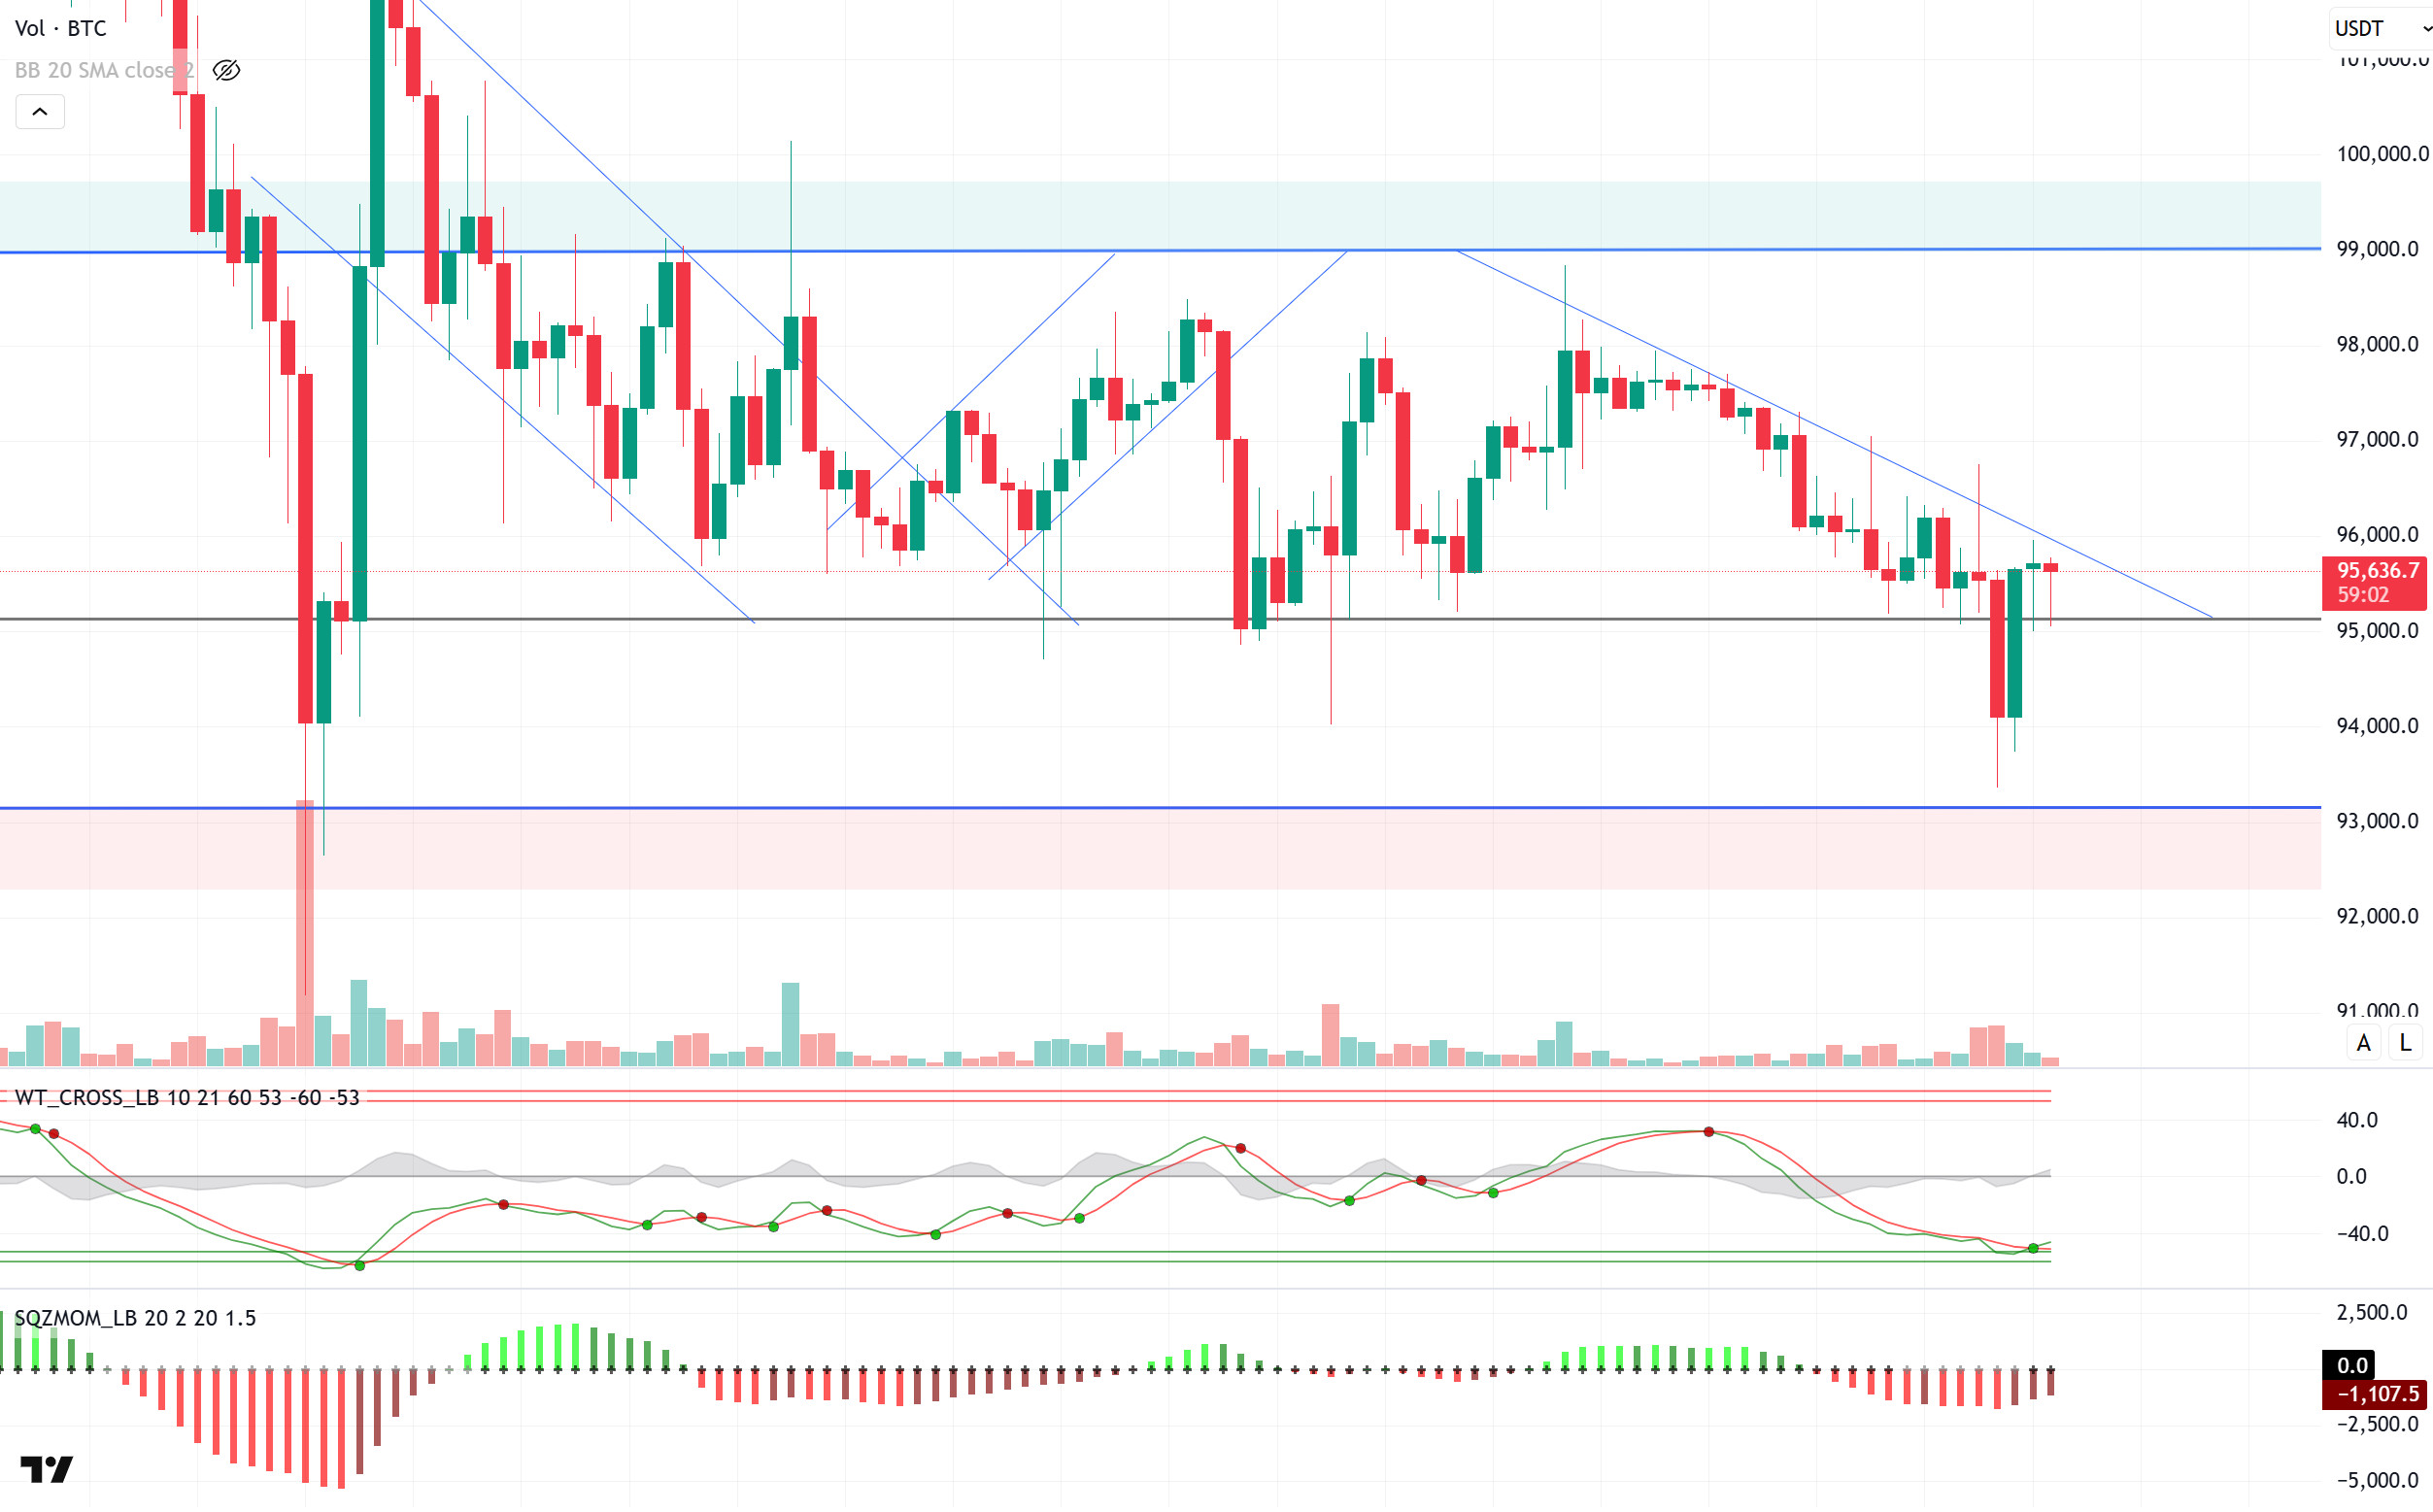
Looking at the technical outlook, yesterday’s selling pressure pushed BTC price down to 93,350 and long positions at 94,000 were liquidated. However, with buying from this area, BTC rebounded and settled above 95,000 support and is currently trading at 95,600. With the breakdown of the narrowing triangle pattern, a breakout of the downtrend structure within the rectangle pattern could set the stage for the price to start a new uptrend. While technical oscillators confirm a buy signal on the hourly charts, a strong signal has not yet formed on the 4-hour charts. Weak momentum indicators confirm the indecisive course of the market. While the level at which the falling trend line needs to be broken for the continuation of the rise stands out as 96,000, closes above 97,000 may support the strengthening of momentum. In case of a possible pullback, the 95,000 level will be followed as a major support point, and given yesterday’s decline, price movements in this region may be more flexible.
Supports 95,000 – 92,800 – 90,400
Resistances 97,000 – 99,100 -101,400
ETH/USDT
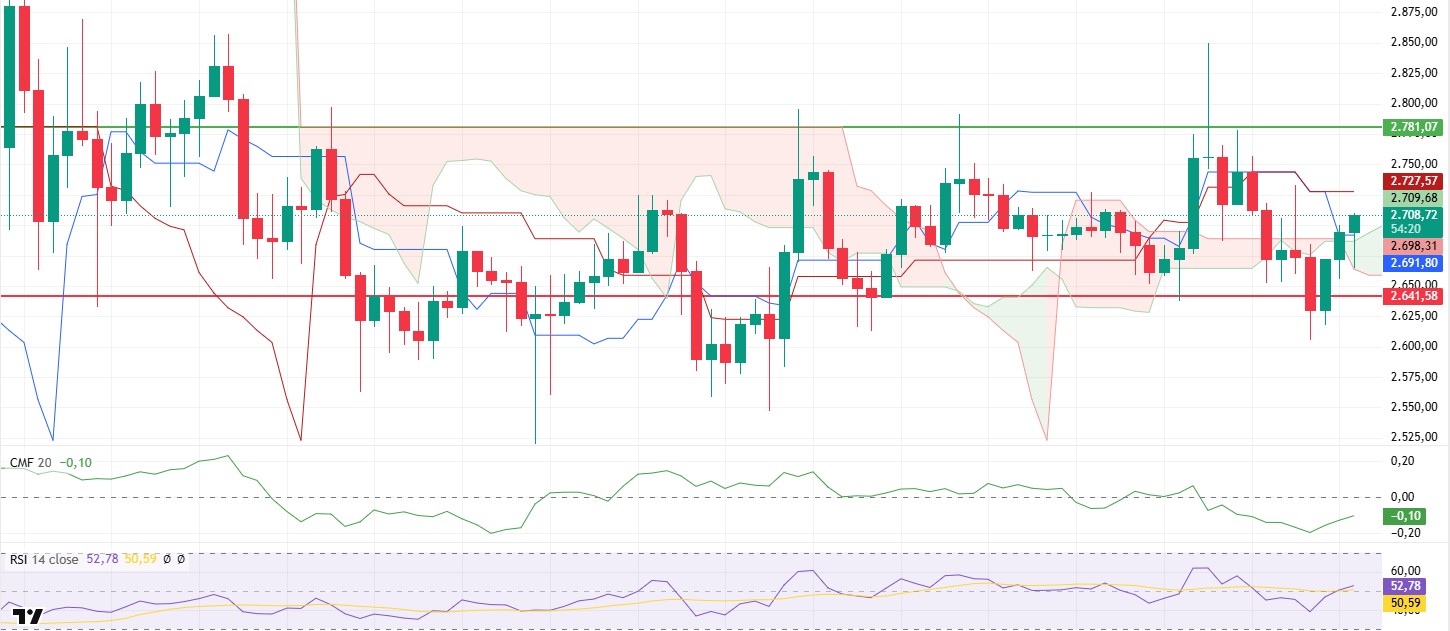
With yesterday’s bearish move, ETH first dipped below the kumo cloud, then lost its intermediate support at $2,641 and fell as low as $2,605. However, with the purchases coming from this level, the price recovered in the night hours and started to rise again and is currently trading at $ 2,708.
When Cumulative Volume Delta (CVD) and open interest data are analyzed, it is seen that the downward movement was mainly driven by high volume short position openings. The uptrend gained momentum with the support of spot buying and the closing of short positions. In terms of technical indicators, it is a positive outlook for the price to move back above the kumo cloud and tenkan level. In addition, with the start of upward movements in Chaikin Money Flow (CMF) and Relative Strength Index (RSI) indicators without any negative divergence, the increase in capital flow and momentum in parallel with the price supports the positive outlook.
In the current structure, as long as the kumo cloud and intermediate support at the level of $ 2,641 are maintained, the price has the potential to rise up to $ 2,781 during the day. However, a downward break of the $2,641 level could create a technically negative structure, leading to increased selling pressure and deepening retracements.
Supports 2,641 – 2,501 – 2,368
Resistances 2,781 – 2,881 – 2,992
XRP/USDT
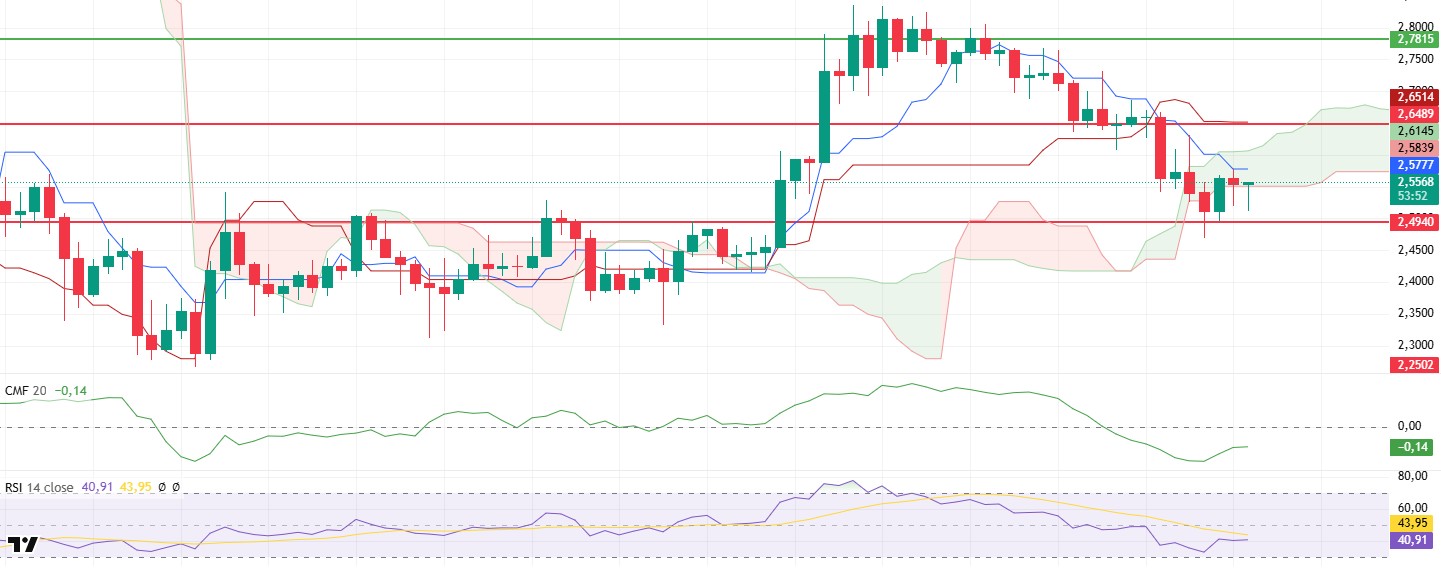
XRP lost the support of the sand cloud due to the general decline in the cryptocurrency market and exhibited a downward movement. As expected, the price, which sagged below the kumo cloud, quickly fell to the level of $ 2.49. However, there was a limited recovery in this region as buyers stepped in.
Analyzing the technical indicators, it is seen that the sell signal generated by the intersections between the tenkan and kijun lines according to the Ichimoku indicator continues. In addition, since the price has not yet broken above the kumo cloud and the tenkan level, it is understood that caution should be exercised about the sustainability of the current rise. Momentum indicators are also showing a weak outlook. Relative Strength Index (RSI) continues to remain at low levels, failing to adequately react to the rebound, indicating that there is not enough buying volume and upside momentum in the market. The Chaikin Money Flow (CMF) indicator, on the other hand, is still in negative territory despite a slight rebound. The fact that CMF remains in negative territory indicates that the selling pressure in the market is stronger than the buyers and the pressure on the price continues.
In the light of this data, it seems that the reaction purchases from the $ 2.49 level are not enough. In order for XRP to re-enter a positive trend, it must first rise above the kumo cloud and then overcome the resistance at the $ 2.65 level. Unless these levels are broken, bullish movements are likely to remain limited. On the other hand, closures below the $2.49 level may increase selling pressure and lead to steeper declines. Therefore, price movements should be carefully monitored.
Supports 2.4940 – 2.2502 – 2.0201
Resistances 2.6486 – 2.7815 – 2.9379
SOL/USDT
Asset manager Grayscale on Tuesday announced a fund based on the Solana network’s PYTH network-based governance token, adding to its offerings amid growing investor demand for digital asset-focused investment products. The Trump Company, on the other hand, plans to airdrop eligible NFT and trading product buyers in the Solana ecosystem. On Onchain, the total open position decreased by 2.23% in the last 24 hours. Solana DEX trading volume decreased to $26 million.
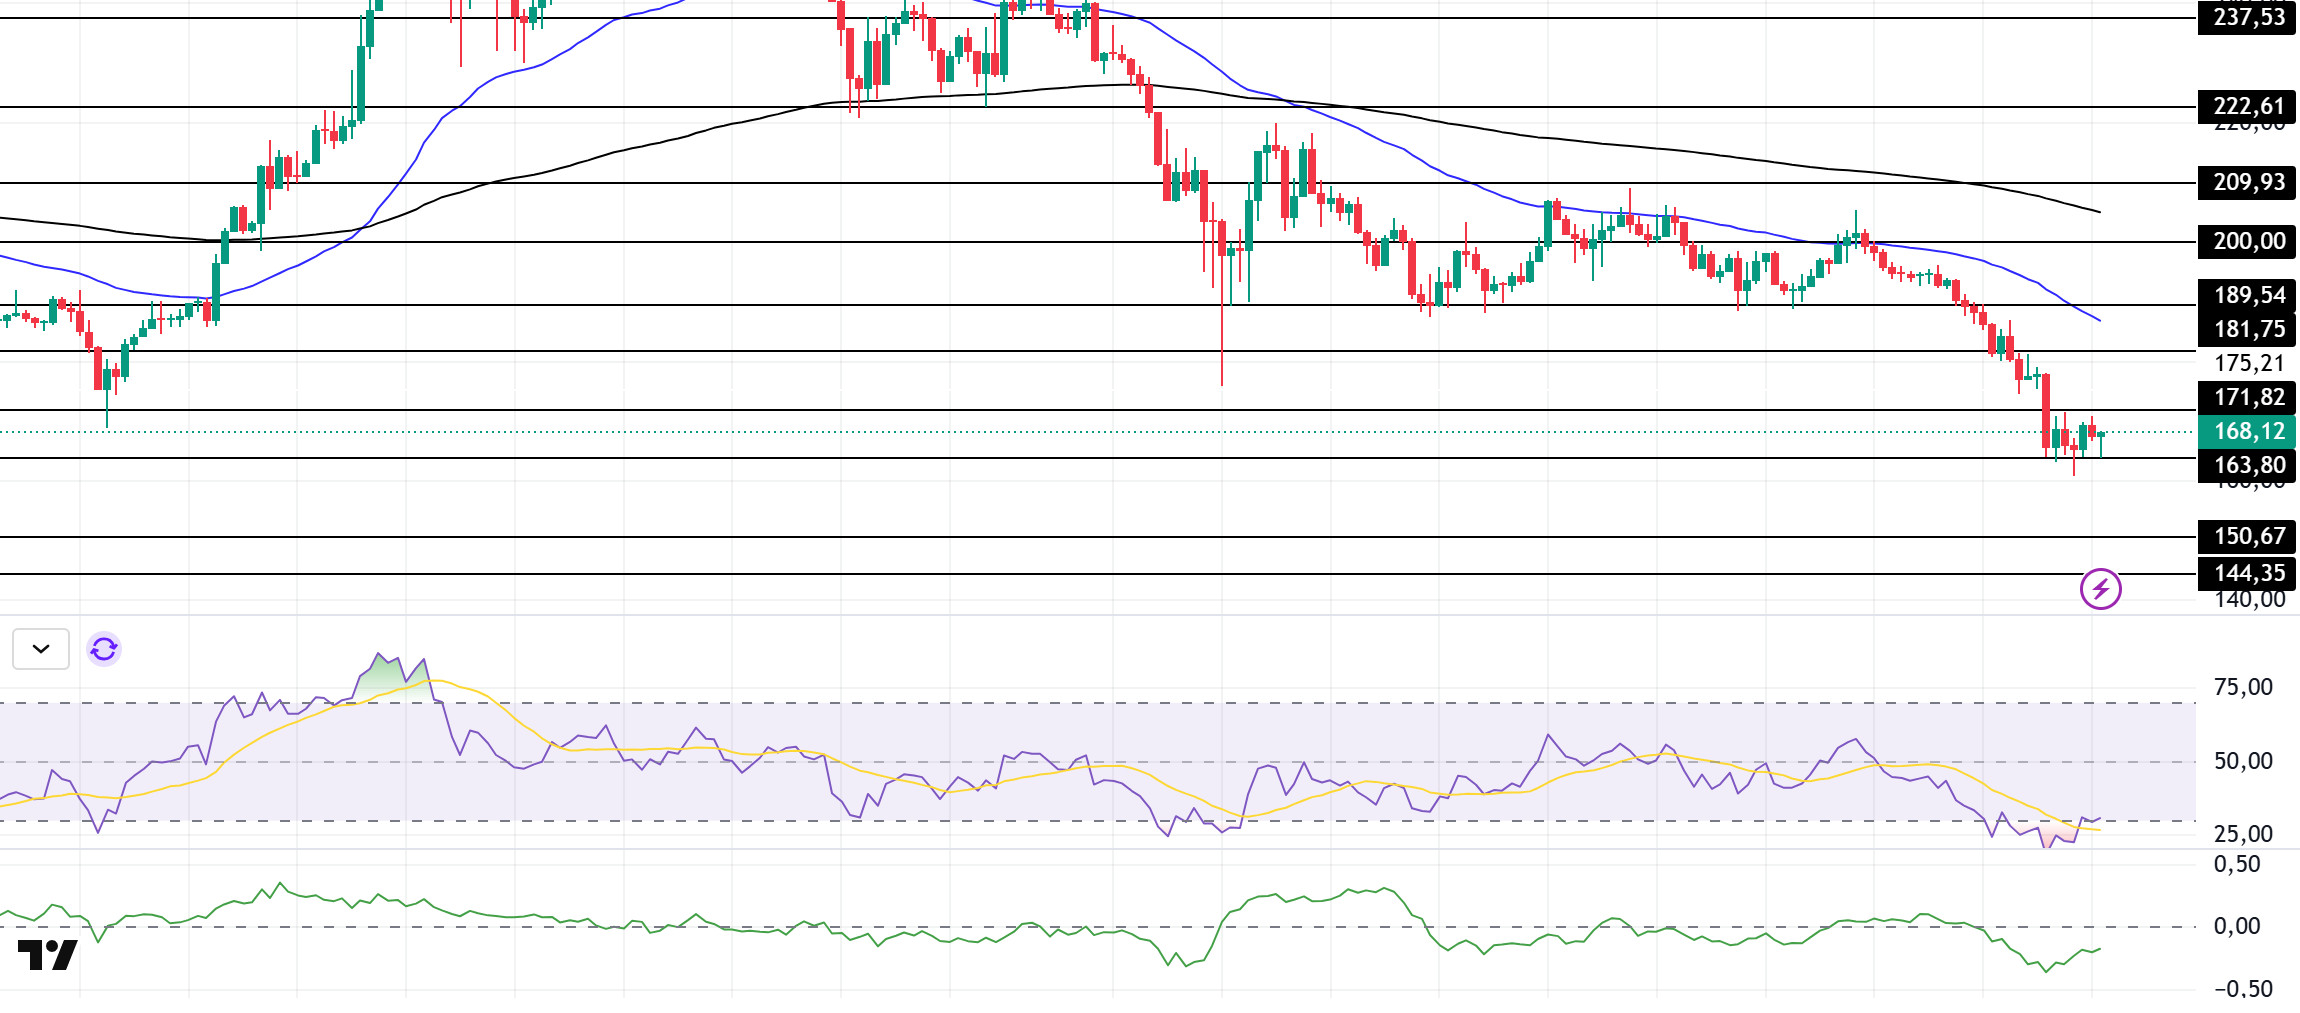
SOL has moved sideways since our analysis yesterday. On the 4-hour timeframe, the 50 EMA (Blue Line) continues to be below the 200 EMA (Black Line). This could continue to deepen the decline in the medium term. At the same time, the asset continued to hover below both moving averages. However, the higher level between the two moving averages may move the asset up. When we examine the Chaikin Money Flow (CMF)20 indicator, although it is at the middle level of the negative zone, the decrease in money outflows and the increase in volume can be seen as a bullish sign. This could mean that buyers have started to increase and are struggling with sellers. However, the Relative Strength Index (RSI)14 indicator is in oversold territory. The $ 200.00 level appears to be a very strong resistance point in the rises driven by both the upcoming macroeconomic data and the news in the Solana ecosystem. If it breaks here, the rise may continue. In case of retracements for the opposite reasons or due to profit sales, the support level of $ 163.80 can be triggered again. If the price comes to these support levels, a potential bullish opportunity may arise if momentum increases.
Supports 163.80 – 150.67 – 144.35
Resistances 171.82 – 181.75 – 189.54
DOGE/USDT
According to on-chain data analysis provided by Santiment, the Dogecoin network has experienced a sharp drop in whale activity by about 88% since mid-November 2024.
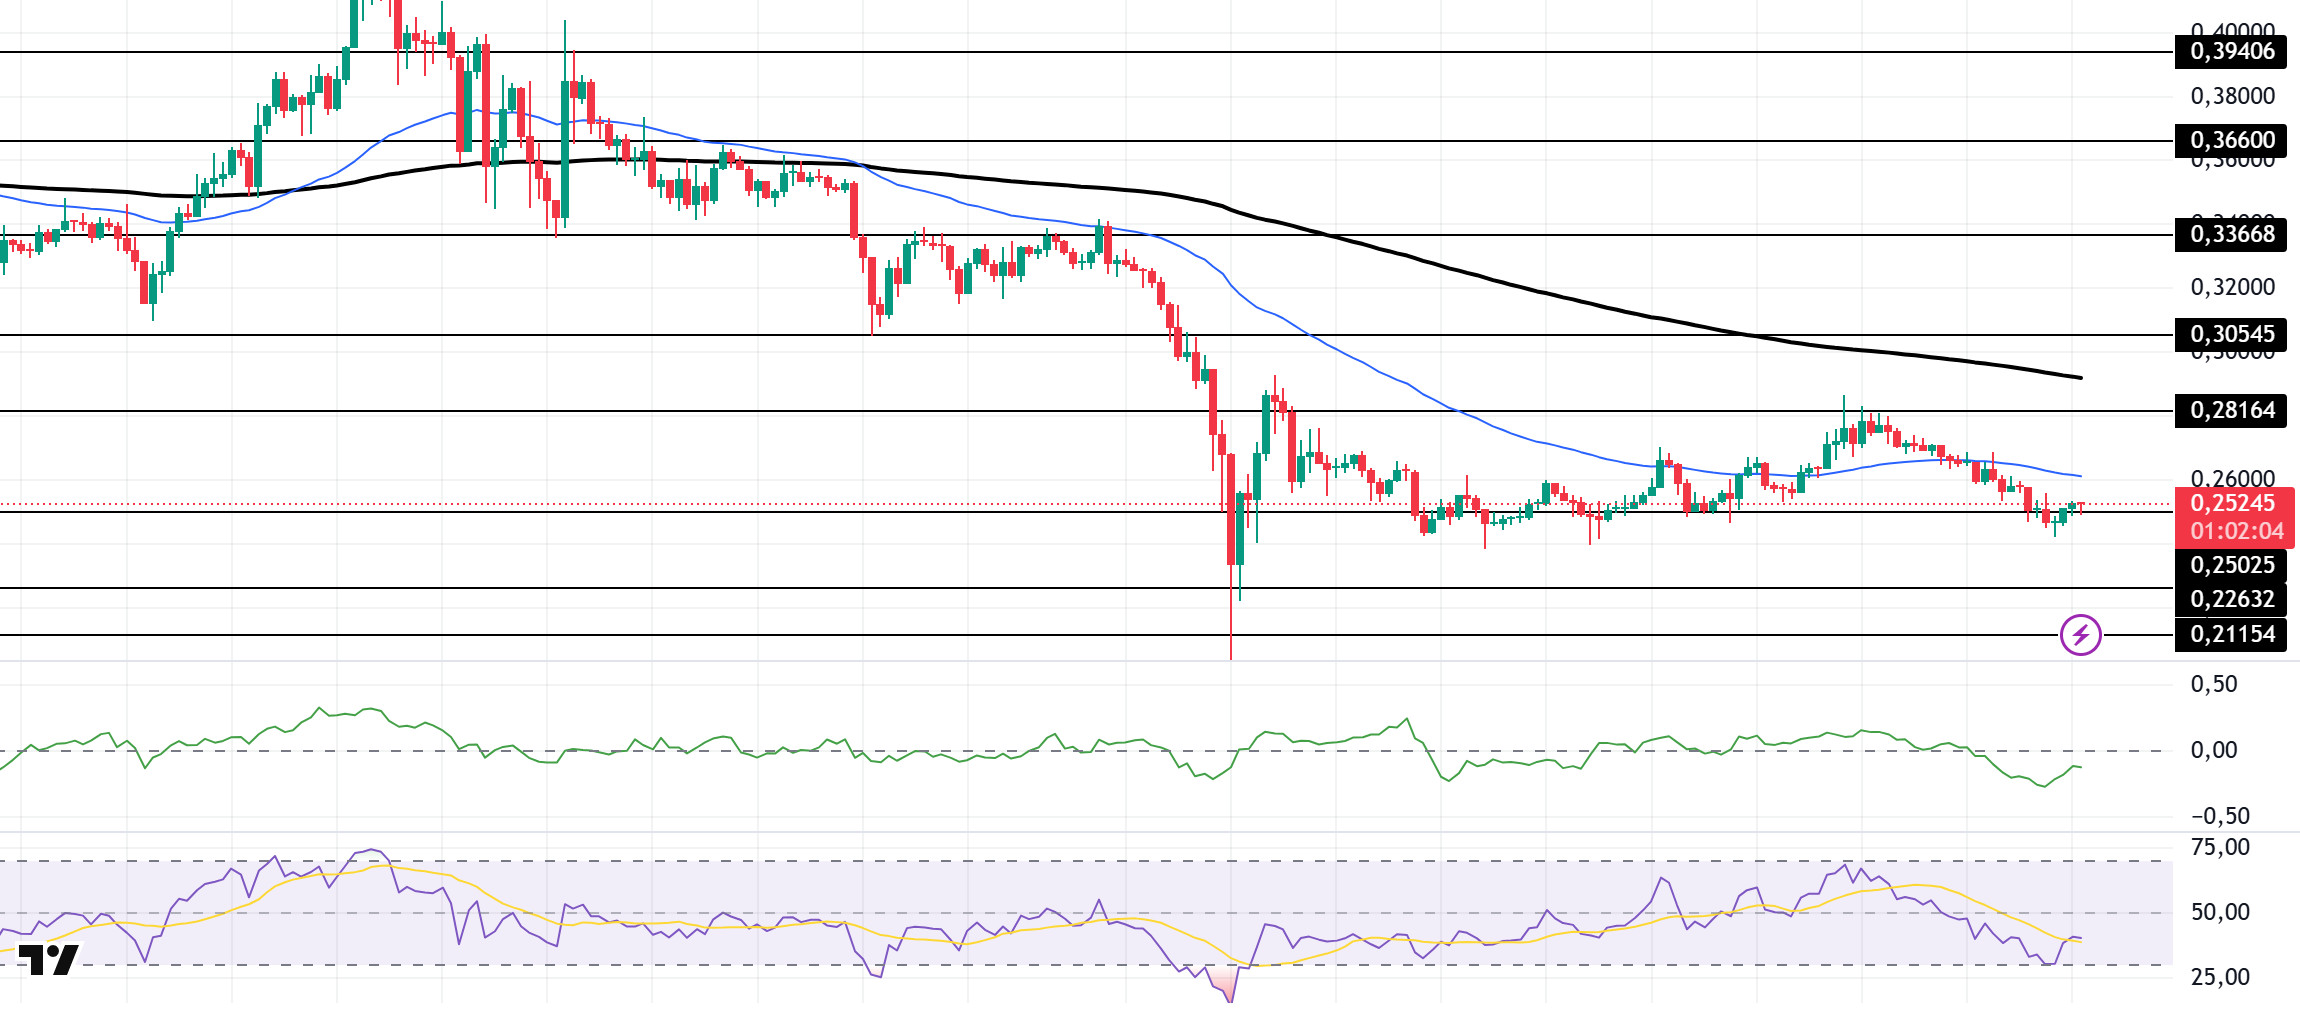
Since our analysis yesterday, DOGE has continued its sideways movement, showing a slight recovery trend at the strong support at 0.25025. At the same time, the asset remains below the 50 EMA (Blue Line) 200 EMA (Black Line) on the 4-hour timeframe. This could mean that the decline could deepen further in the medium term. The price, however, remains below the two moving averages. However, the larger gap between the two moving averages could further increase the probability of DOGE moving higher. The Chaikin Money Flow (CMF)20 indicator is in negative territory and has started to decline despite the large outflows. The fact that the volume has increased and CMF is at a negative level shows us that sellers are dominant. At the same time, Relative Strength Index (RSI)14 is in negative territory. The $0.33668 level stands out as a very strong resistance point in the rises due to political reasons, macroeconomic data and innovations in the DOGE coin. In case of possible pullbacks due to political, macroeconomic reasons or negativities in the ecosystem, the $0.22632 level, which is the base level of the trend, is an important support. If the price reaches these support levels, a potential bullish opportunity may arise if momentum increases.
Supports 0.25025 – 0.22632 – 0.21154
Resistances 0.28164 – 0.30545 – 0.33668
LEGAL NOTICE
The investment information, comments and recommendations contained herein do not constitute investment advice. Investment advisory services are provided individually by authorized institutions taking into account the risk and return preferences of individuals. The comments and recommendations contained herein are of a general nature. These recommendations may not be suitable for your financial situation and risk and return preferences. Therefore, making an investment decision based solely on the information contained herein may not produce results in line with your expectations.
