
Technical Analysis
BTC/USDT
According to the FOMC minutes, inflation concerns persisted despite strong growth, while the effects of trade and immigration policies were emphasized. Trump signed an executive order to end anti-crypto policies. On February 19, there was a net outflow of $ 71.07 million from Bitcoin spot ETFs. BTC eyes turned to the $15.4 billion options expiring tomorrow; Put/Call ratio 0.76, maximum pain point $98,000.
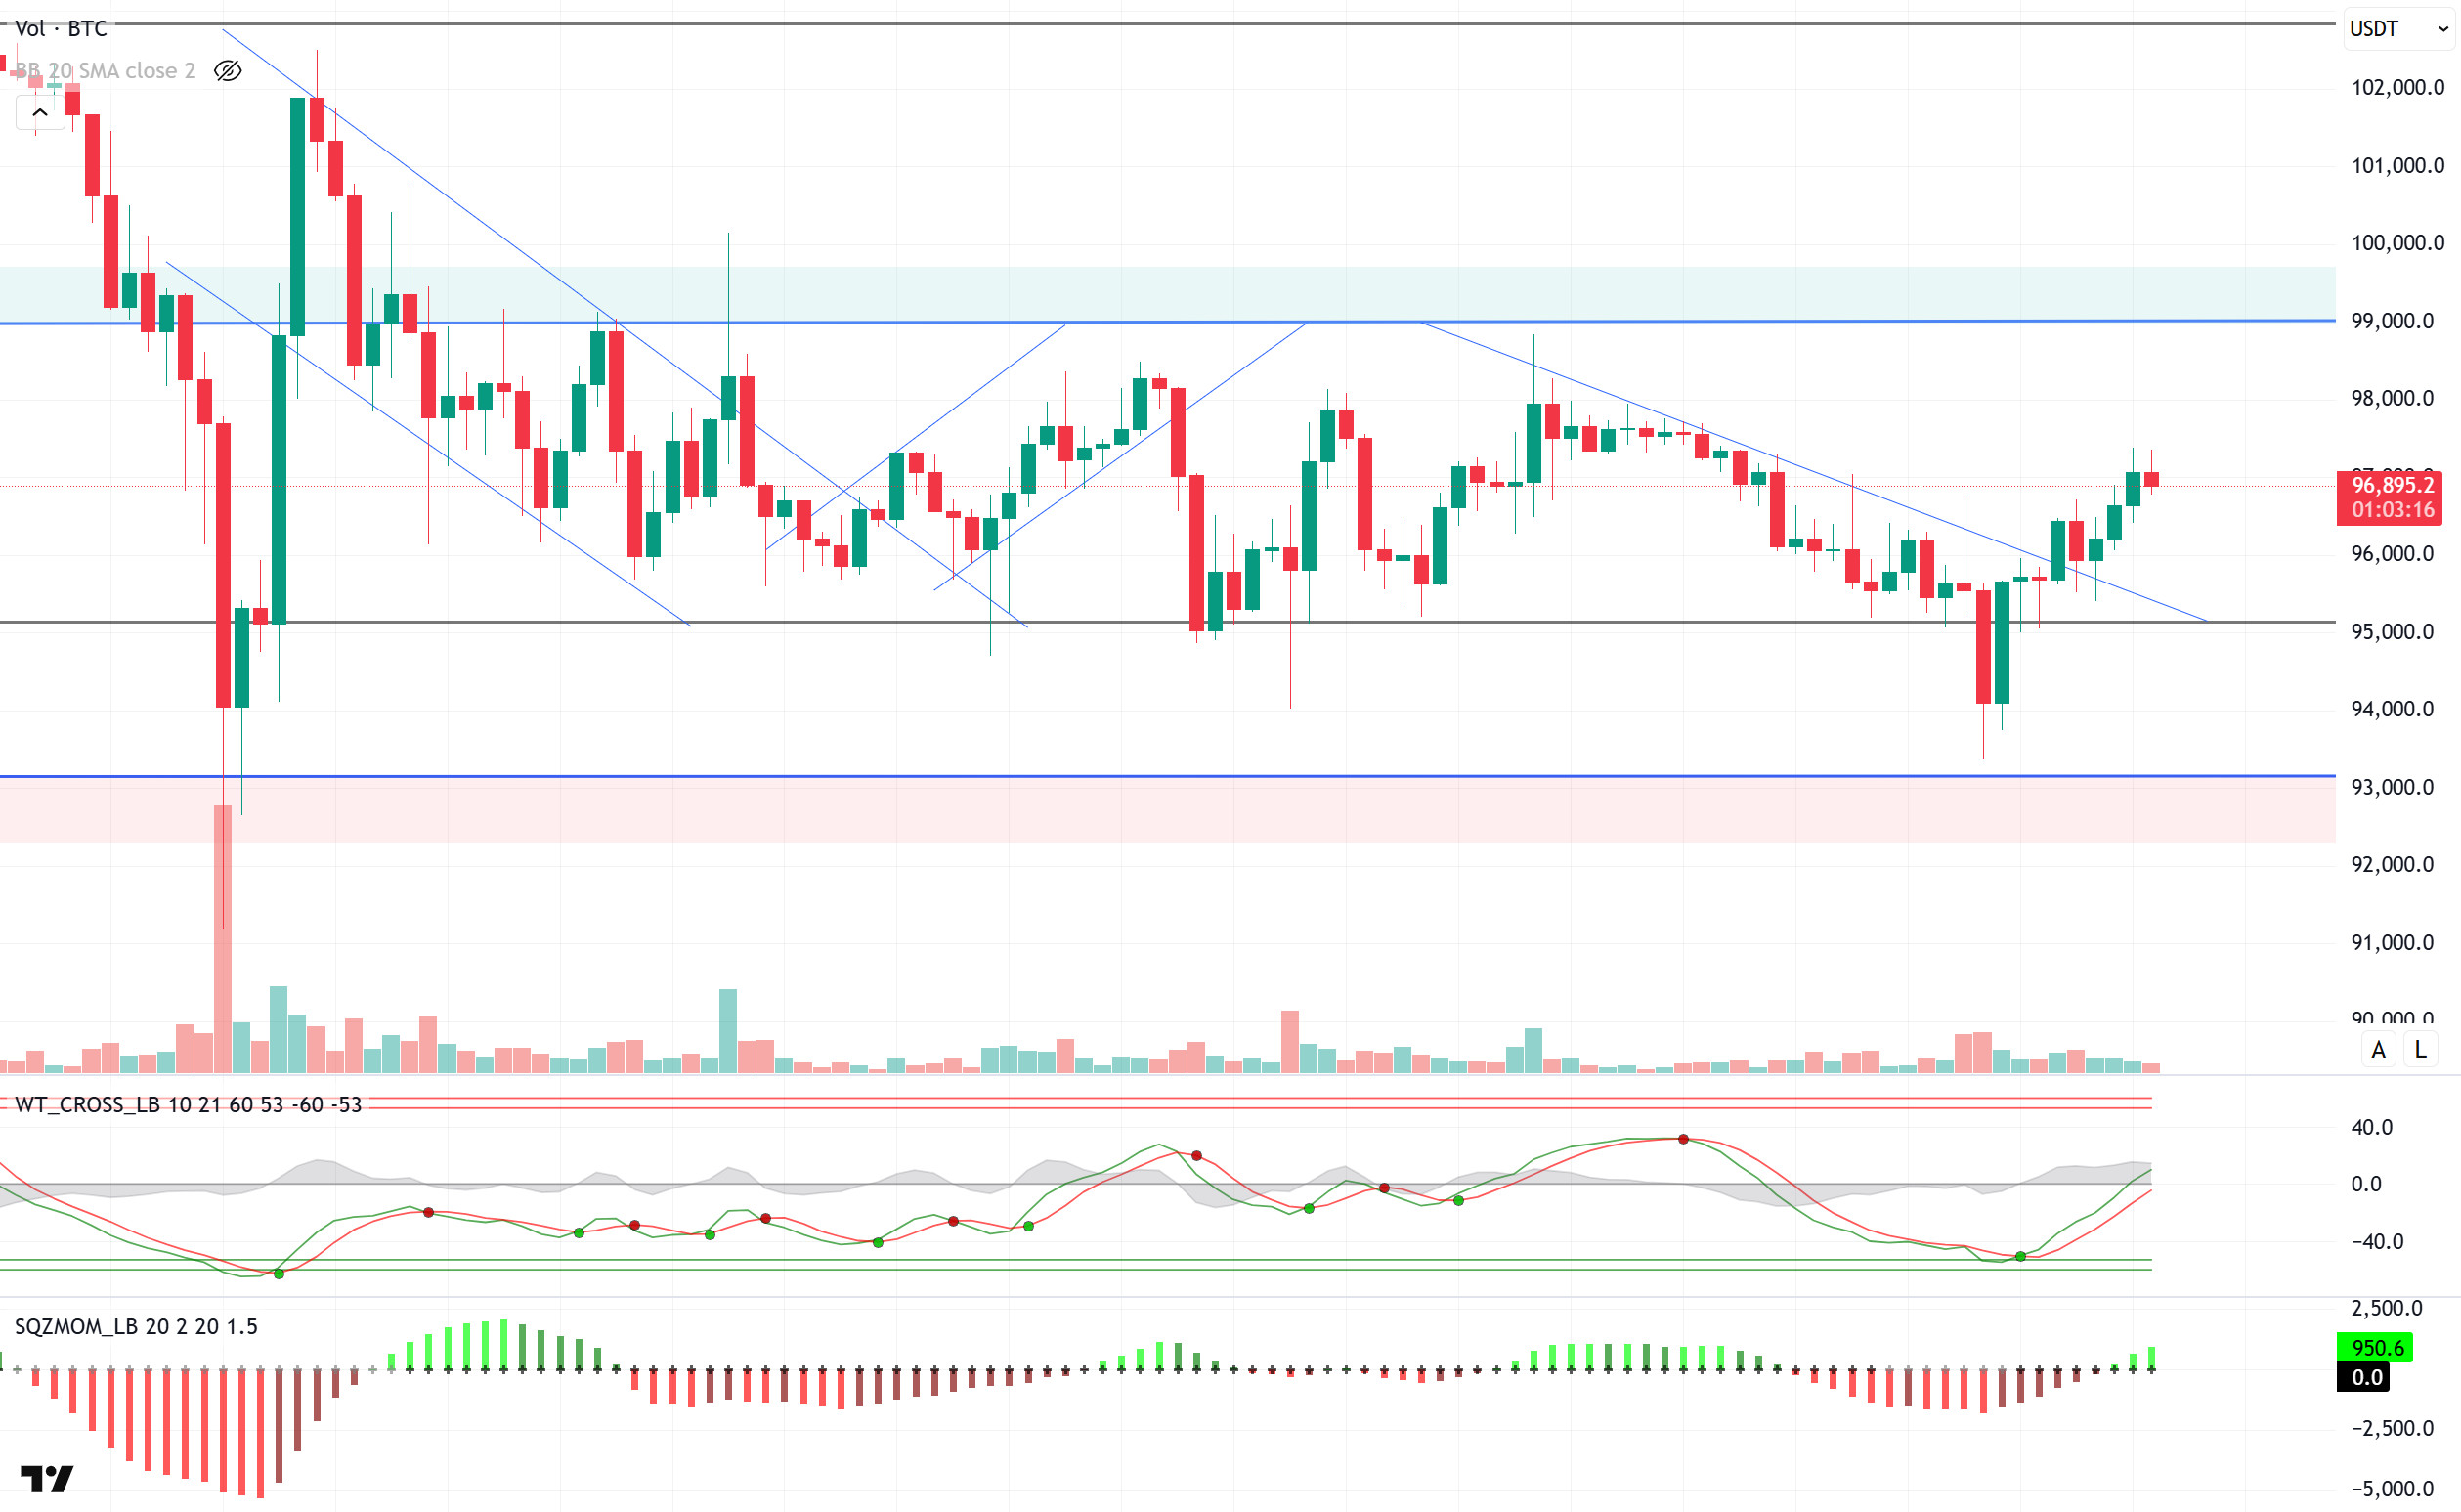
On the technical outlook, it is noteworthy that BTC price has broken the downtrend structure. Yesterday, with the negative opening of the US stock market indices, the price briefly dipped below the falling trend line and tested the 95,500 level. However, with the purchases from this level, there was a recovery and the price regained bullish momentum. Currently trading at 96,900, BTC continues to push the minor resistance point of 97,000. When technical oscillators are analyzed, it is seen that Wave Trend, Ultimate Oscillator and RSI (14) indicators give a buy signal on the 4-hour charts. In addition, the momentum indicators crossing into the positive zone confirms the uptrend. On the moving averages side, it is observed that MA10, MA20 and MA50 give positive signals that BTC price may regain momentum. If the uptrend continues, short positions above the 98,000 level on the daily liquidation heatmap can be targeted. In a possible pullback scenario, the minor falling trend line will be followed as an important support.
Supports 95,000 – 92,800 – 90,400
Resistances 97,000 – 99,100 -101,400
ETH/USDT
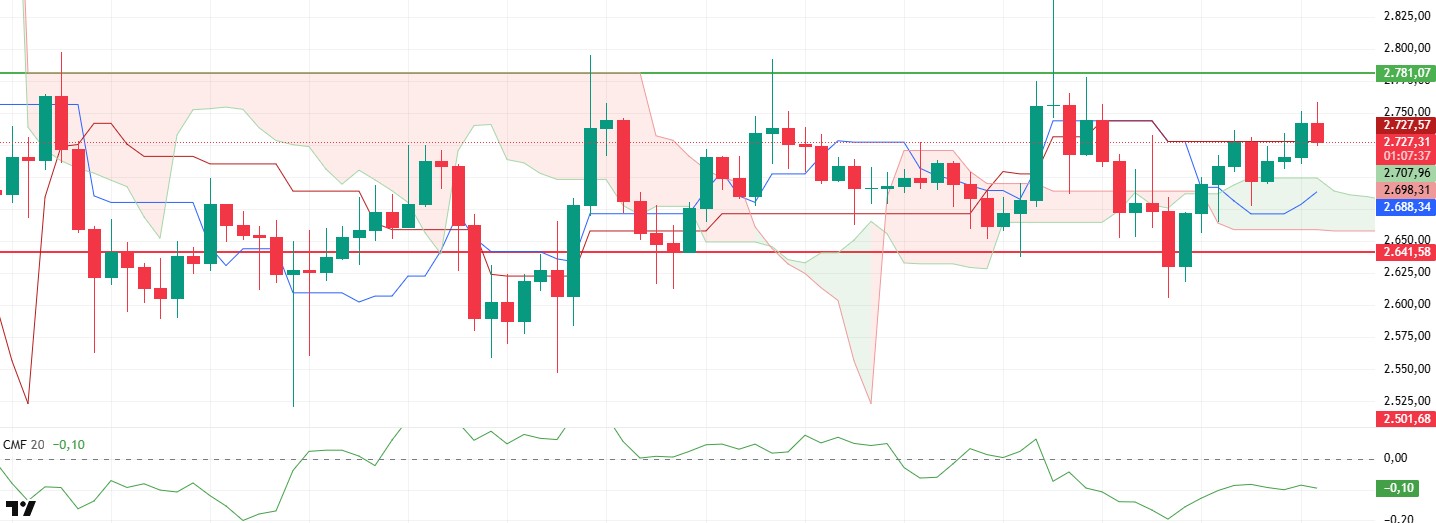
With the SEC reviewing the staking application for the 21Shares spot Ethereum ETF, the ETH price rose as high as $2,758 overnight. However, it retreated slightly with the selling pressure it faced at this level and is currently trying to stabilize at the kijun level.
In terms of technical indicators, the fact that the price remains above the tenkan and kijun levels as well as the kumo cloud offers a positive outlook. Especially the rise in the tenkan level shows that the support zone is also moving upwards. This can be taken as a signal that buyers are still active in the market. However, the weakening of the Chaikin Money Flow (CMF) indicator indicates increased selling pressure on the market and suggests that volatility may continue in the short term and the price may be looking for direction.
If ETH can hold at current levels, the bullish movement can be expected to continue during the day and advance up to the $2,781 resistance. However, if the price slips below the kijun level, there is a risk of a pullback to the $2,641 level with increased selling pressure.
Supports 2,641 – 2,501 – 2,368
Resistances 2,781 – 2,881 – 2,992
XRP/USDT
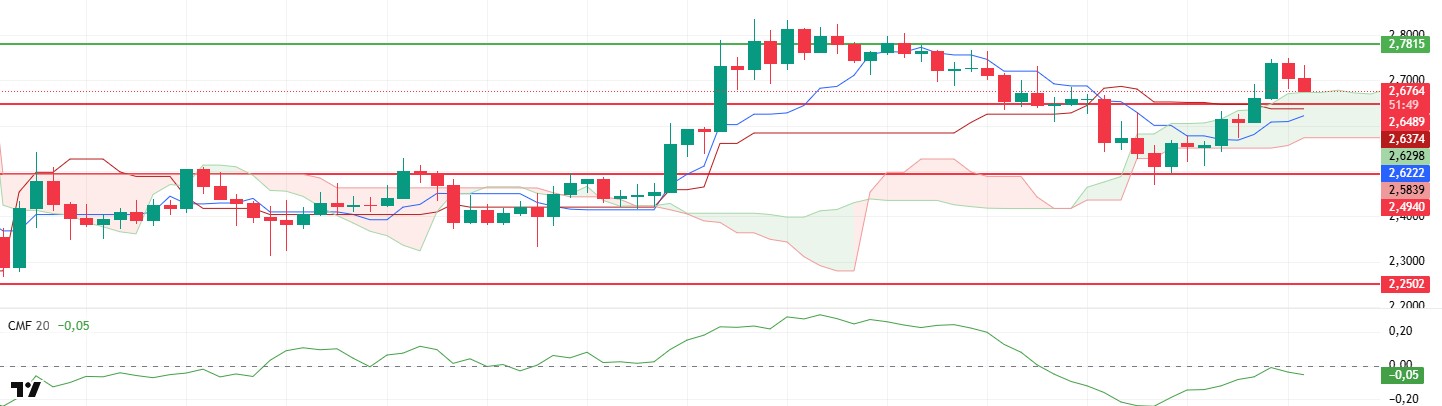
XRP managed to reach the $ 2.75 level with a sharp rise after exceeding the kumo cloud and $ 2.65 level yesterday evening. Selling pressure from this region caused it to retreat to the $ 2.68 level.
It is seen that a buy signal is starting to form with the convergence of kijun and tenkan levels for XRP, which momentarily fell to the limits of the kumo cloud. The Chaikin Money Flow (CMF) indicator, on the other hand, rejected from the zero zone and headed down, indicating that selling pressure is starting to build again.
As a result, provided that the price stays above the kumo cloud, it seems likely that it will recover during the day and continue to rise up to the $ 2.78 level. However, the loss of the kumo cloud to the $ 2.65 level and the loss of this region may cause sharp retracements.
Supports 2.4940 – 2.2502 – 2.0201
Resistances 2.6486 – 2.7815 – 2.9379
SOL/USDT
Coinbase launched CFTC-regulated SOL futures in the US. On the other hand, 87,328 SOLs worth about $14.8 million were withdrawn from a centralized exchange. However, decentralized exchange (DEX) trading on Solana reached a five-week low of $2.61 billion, a 28% drop in on-chain trading figures.
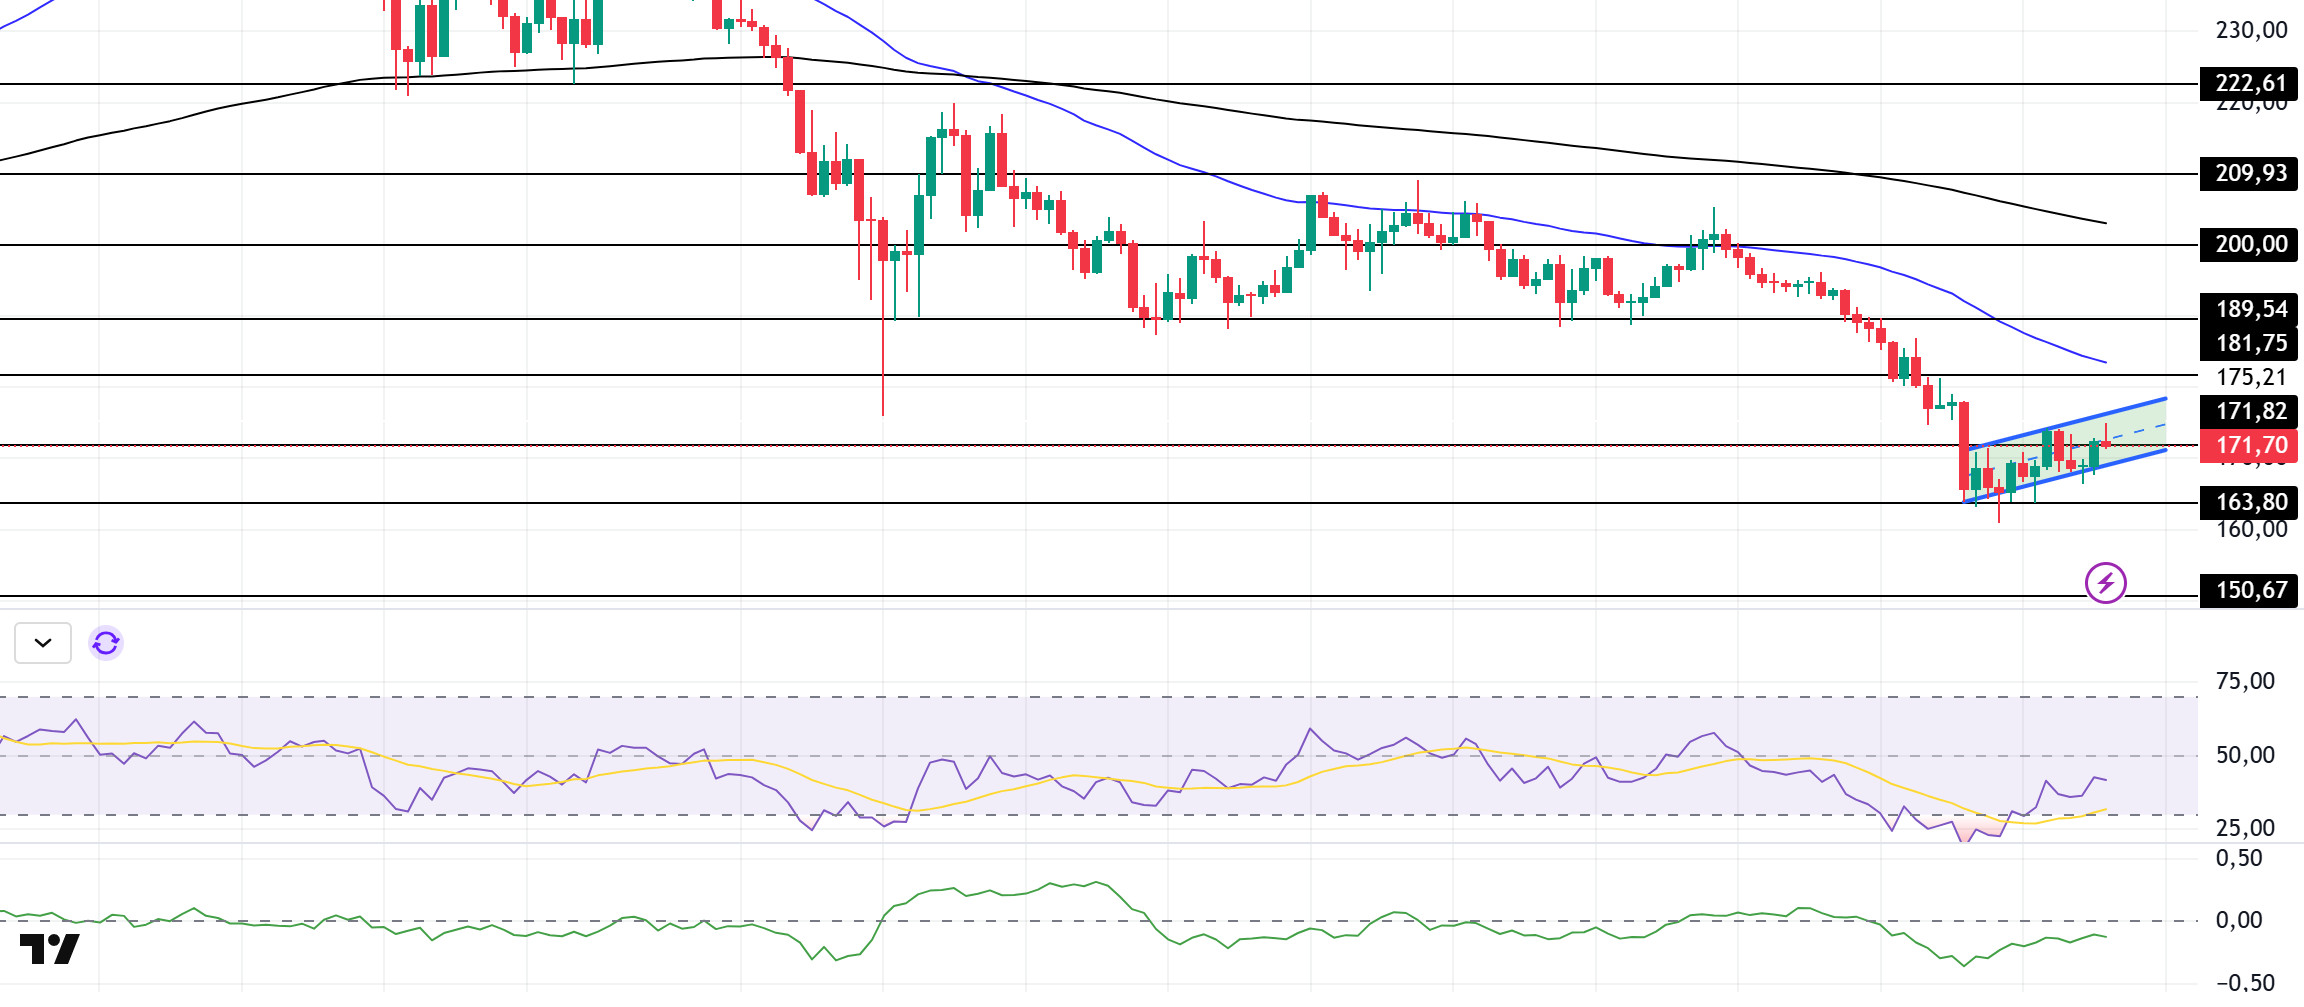
SOL has continued its sideways trend since our analysis yesterday. On the 4-hour timeframe, the 50 EMA (Blue Line) continues to be below the 200 EMA (Black Line). This could continue to deepen the decline in the medium term. At the same time, the asset remains below both moving averages. However, the higher level between the two moving averages may move the asset up. When we examine the Chaikin Money Flow (CMF)20 indicator, the fact that it is in the middle of the negative zone and the volume is declining may deepen the decline even though the outflows are in balance. This may mean that sellers are more dominant. However, the Relative Strength Index (RSI)14 indicator came from the oversold zone to the mid-levels of the negative zone. This may give the opportunity for a downward movement and cause the asset to fall further. At the same time, the falling flag pattern should be taken into account. The $ 200.00 level appears to be a very strong resistance point in the rises driven by both the upcoming macroeconomic data and the news in the Solana ecosystem. If it breaks here, the rise may continue. In case of retracements due to the opposite reasons or profit sales, the support level of $ 163.80 can be triggered again. If the price comes to these support levels, a potential bullish opportunity may arise if momentum increases.
Supports 171.82 – 163.80 – 150.67
Resistances 181.75 – 189.54 – 200.00
DOGE/USDT
The price of Dogecoin could rise if Elon Musk and Trump offer $5,000 stimulus checks. The checks would be in the form of the DOGE dividend from savings made by Musk’s team.
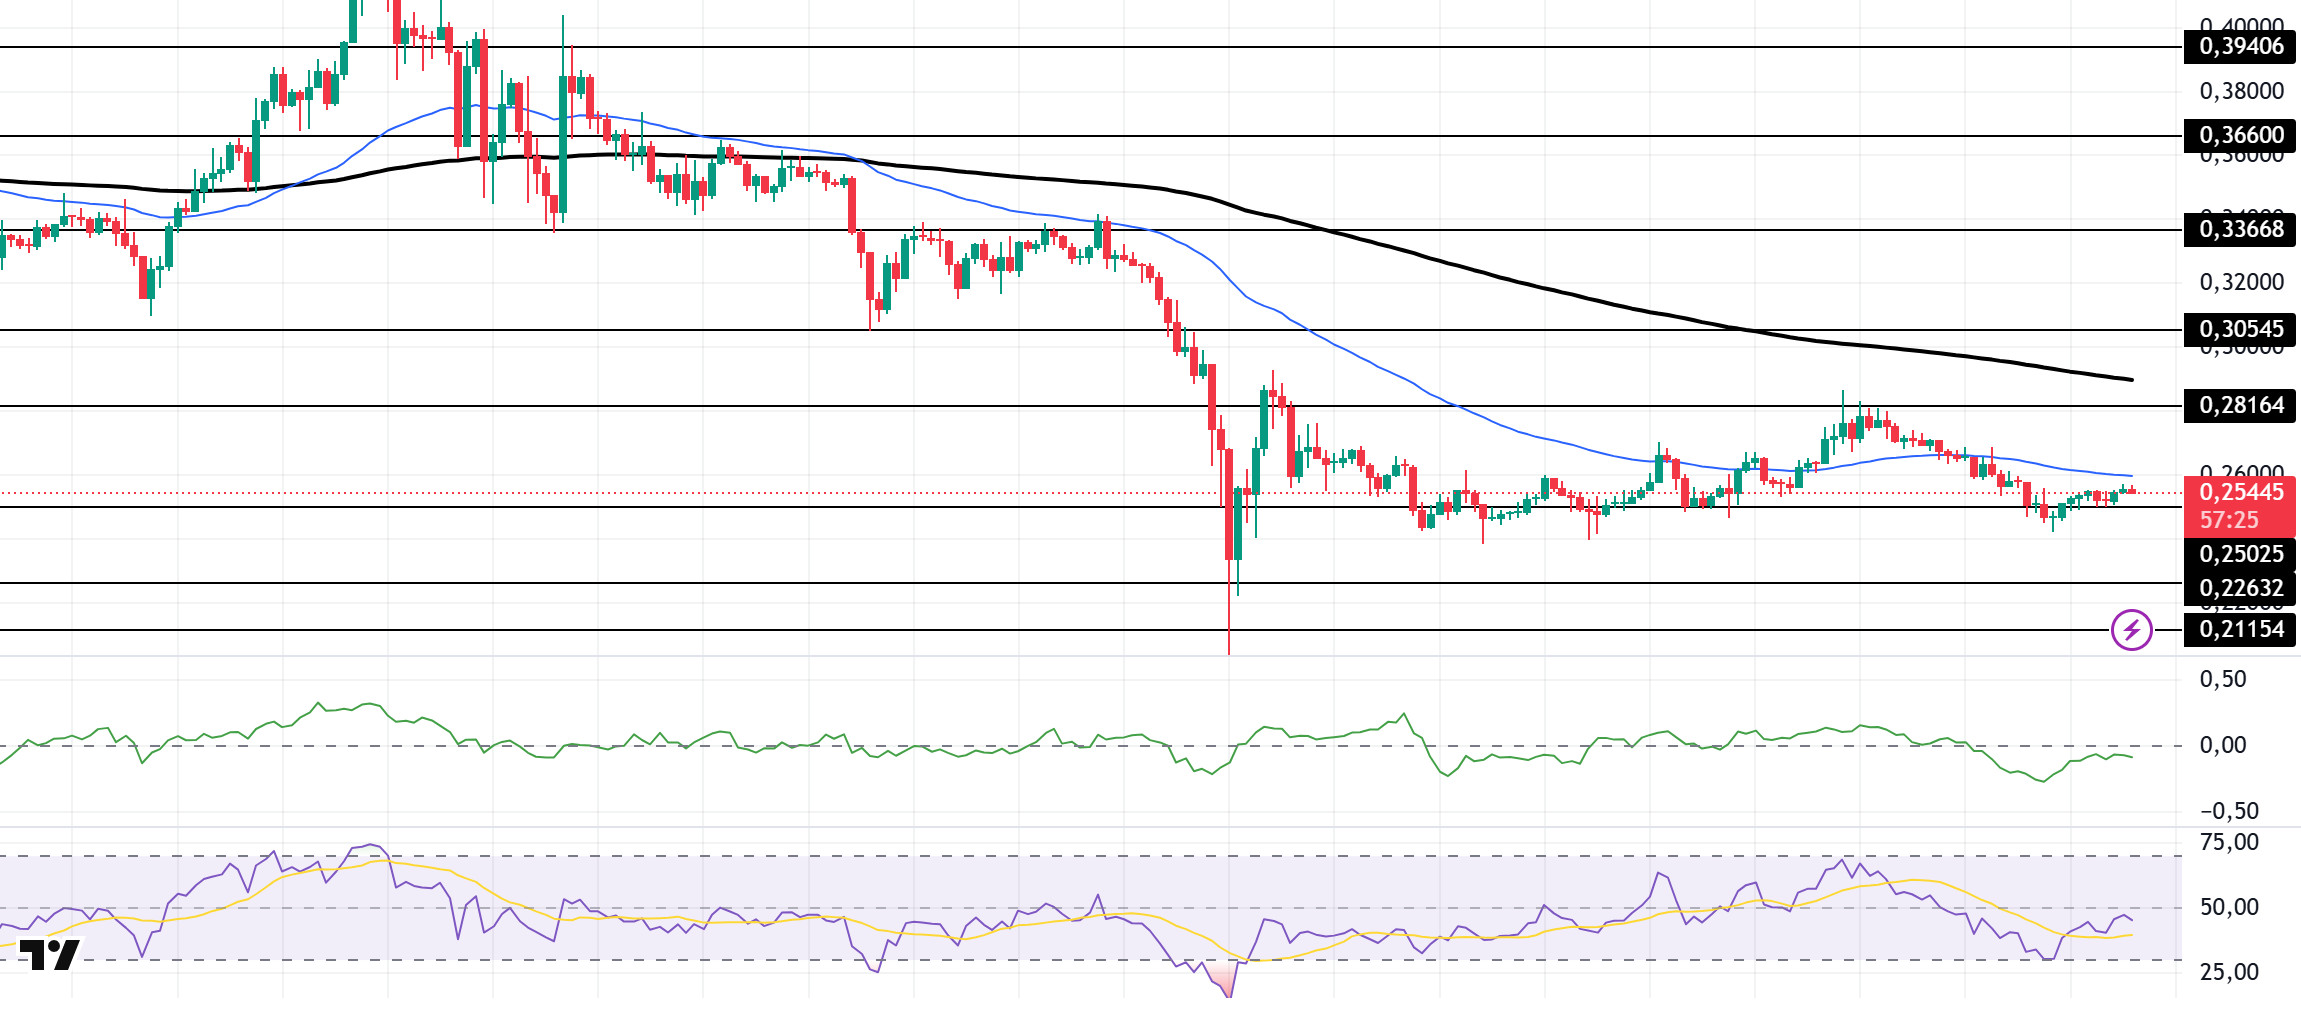
DOGE has been slightly bullish since our analysis yesterday, keeping pace with the broader market and is poised to test the 50 EMA (Blue Line) as a place of resistance. At the same time, the asset continued to remain below the 50 EMA (Blue Line) 200 EMA (Black Line) on the 4-hour timeframe. This could mean that the decline could deepen further in the medium term. The price, however, remains below the two moving averages. However, the larger gap between the two moving averages may further increase the probability of DOGE rising . The Chaikin Money Flow (CMF)20 indicator is in the negative zone near the neutral level. Although this means that money outflows are decreasing, the decline in volume shows us that the rise is not very strong. At the same time, Relative Strength Index (RSI)14 is in the negative zone near the neutral level. The $0.33668 level stands out as a very strong resistance point in the rises due to political reasons, macroeconomic data and innovations in the DOGE coin. In case of possible pullbacks due to political, macroeconomic reasons or negativities in the ecosystem, the $0.22632 level, which is the base level of the trend, is an important support. If the price reaches these support levels, a potential bullish opportunity may arise if momentum increases.
Supports 0.25025 – 0.22632 – 0.21154
Resistances 0.28164 – 0.30545 – 0.33668
LEGAL NOTICE
The investment information, comments and recommendations contained herein do not constitute investment advice. Investment advisory services are provided individually by authorized institutions taking into account the risk and return preferences of individuals. The comments and recommendations contained herein are of a general nature. These recommendations may not be suitable for your financial situation and risk and return preferences. Therefore, making an investment decision based solely on the information contained herein may not produce results in line with your expectations.

