
Technical Analysis
BTC/USDT
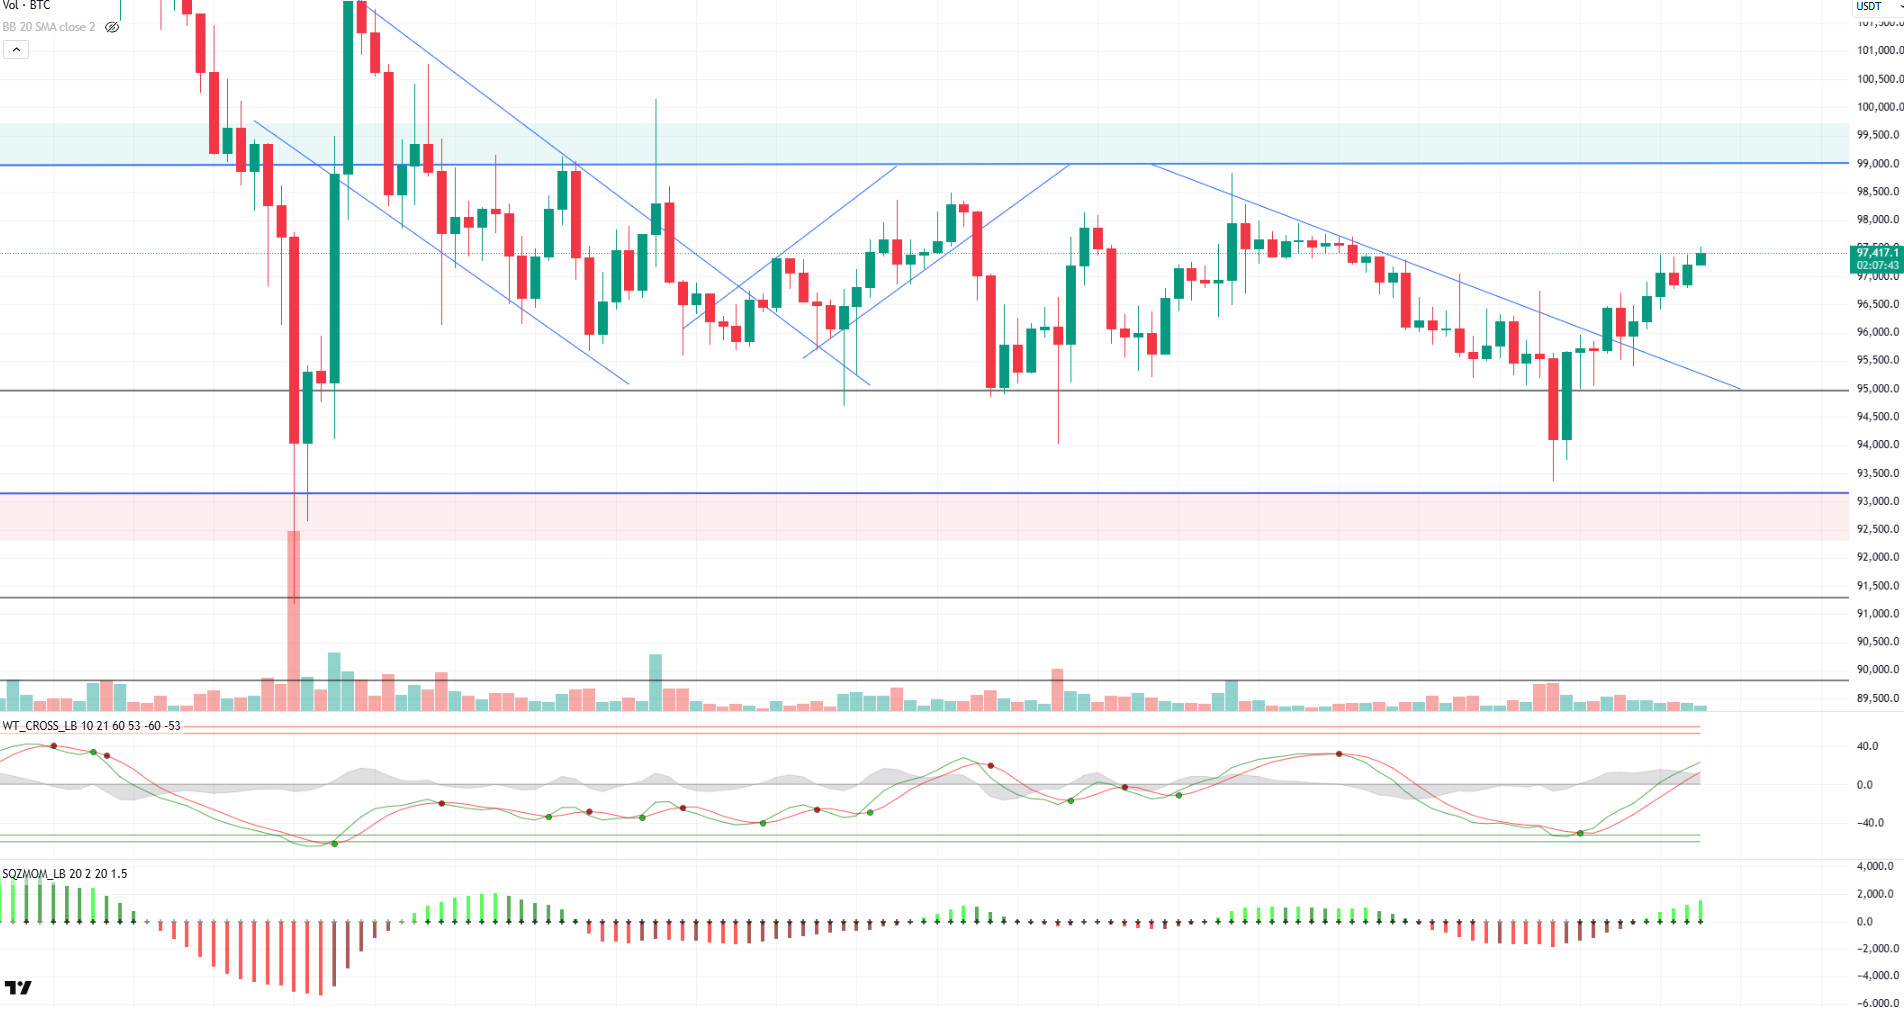
Trading activity in Bitcoin ETFs has slowed, with a net outflow of 1,000 BTC recently, raising questions about the sustainability of the uptrend. The decline in the number of active addresses on the Bitcoin network to 1.10 million confirms the decline in investor interest. The recent period of Bitcoin bull reveals that new catalysts need to be included in the market in order to regain upward momentum after the February consolidation phase.
With the impact of fundamental and on-chain developments, BTC’s technical outlook shows limited upside movement after breaking the minor downtrend structure. At the time of writing, BTC is trading at 97,400, breaking above the intermediate resistance level of 97,000. This level stands out as a critical zone for the continuation of short-term bullish momentum. Analyzing the technical oscillators, as in previous analysis, buy signals continue to be maintained on both the hourly and 4-hour charts. In addition, momentum indicators also confirm these buy signals. This may indicate that the current uptrend may continue in the short term. When the last 24-hour liquidation heat map is evaluated, short trades concentrated at the 98,000 level attract attention. This level stands out as a potential target point in the continuation of the upward movement. On the other hand, the increase in long positions from the 96,000 level indicates that the price has found strong support in this region. If the uptrend continues, the 98,000 level will be followed as a critical target. However, in case of a possible pullback, the minor falling trend line will be monitored as an important support level. If the price dips below this level, it could end the short-term uptrend.
Supports 95,000 – 92,800 – 90,400
Resistances 97,000 – 99,100 -101,400
ETH/USDT
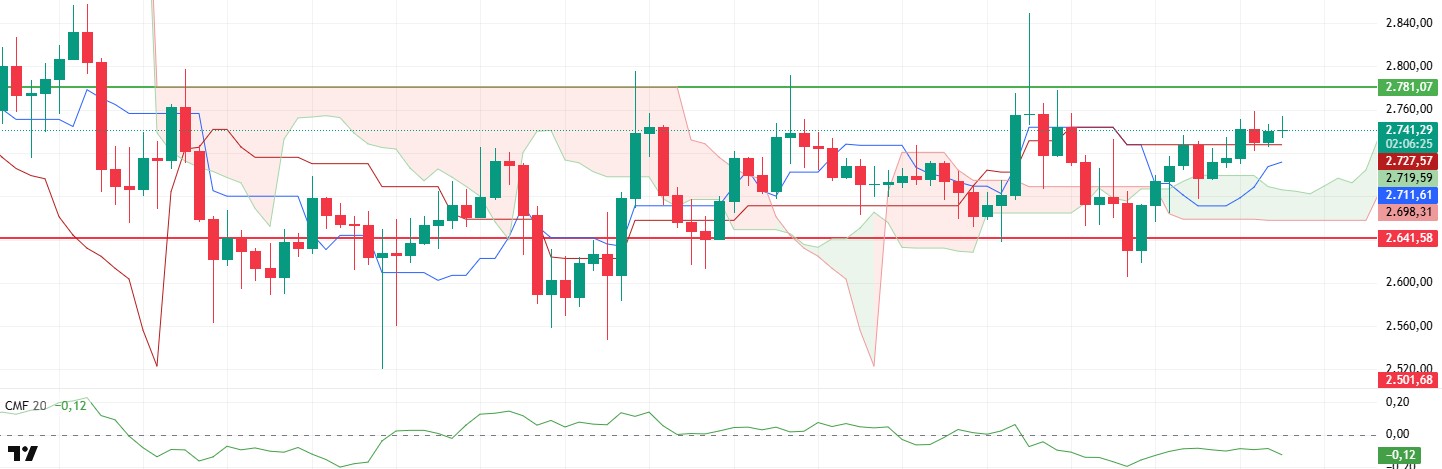
ETH has risen slightly during the day, supported by the kijun level, and is trying to maintain the $2,740 level. In this region, where the price is stuck in a narrow range, the possibility of more drastic price movements increases after possible breakouts.
An analysis of the Cumulative Volume Delta (CVD) reveals that the slight upward movement during the day was mainly driven by futures, but the buying support from the spot market weakened. This suggests that a strong fundamental buying support is missing in the upward movement of the market, while the weakness in the Chaikin Money Flow (CMF) indicator also supports this view. Insufficient liquidity flow is a factor that may make it difficult for the price to maintain its current levels. However, other data on the market structure also offer some positive signs. The retracement of the funding rate and the increase in open interest suggest an increase in the number of short positions, suggesting that the market has the potential for a short squeeze at some point and that liquidations may be triggered in a possible bullish move. Moreover, the kumo cloud’s bullish trend and tenkan’s convergence to the kijun level suggest that the market remains technically positive.
When the general indicators are evaluated, the fact that the price remains above the kijun level can be interpreted as positive in the short term. However, the lack of spot buying support may bring slight pullbacks in the evening hours if this level is lost. On the other hand, if ETH manages to hold at this level, it seems possible to target the $2,781 level and above in the continuation of the upward movement.
Supports 2,641 – 2,501 – 2,368
Resistances 2,781 – 2,881 – 2,992
XRP/USDT
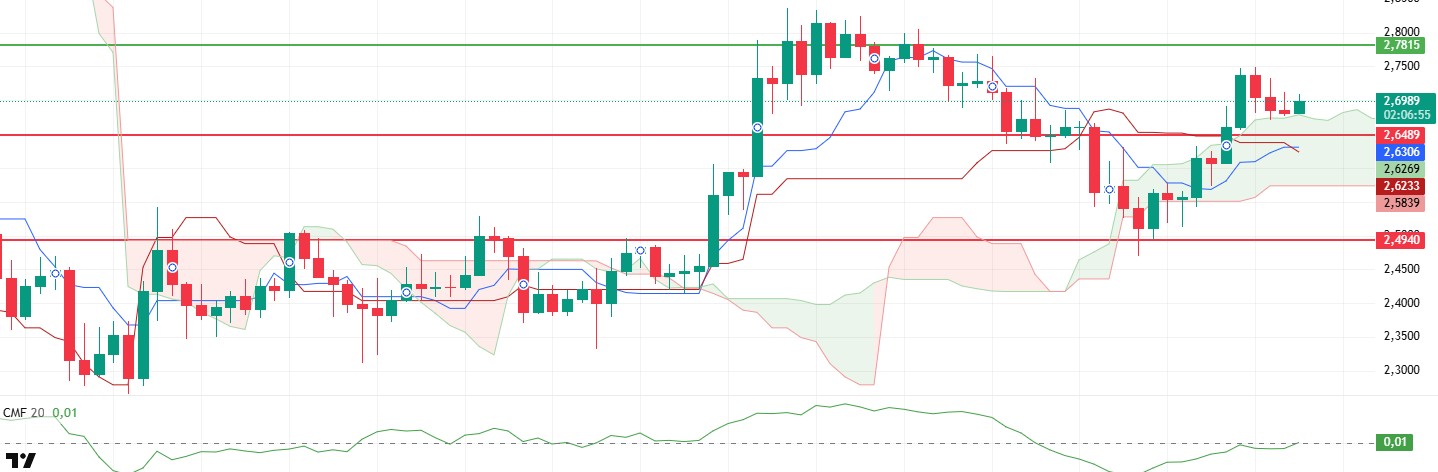
XRP had reached the level of $ 2.75 with a sharp rise after exceeding the sand cloud and $ 2.65 level yesterday evening. XRP, which retreated back to the borders of the sand cloud with the sales pressure in this region, maintains its upward trend again with the reaction it received from this region.
Looking at the technical indicators, it is seen that important positive signals have been formed. First of all, the Chaikin Money Flow (CMF) indicator crossed the zero line and moved into positive territory, indicating that buyers are dominant again. The buy signal formed by the Tenkan level cutting the kijun level upwards is also an important catalyst that can support price rises.
In summary, provided that the price does not lose the support of the kumo cloud, rises up to the main resistance level of 2.78 can be seen in the evening hours. However, the violation of the kumo cloud may cause pullbacks to $ 2.57 levels.
Supports 2.4940 – 2.2502 – 2.0201
Resistances 2.6486 – 2.7815 – 2.9379
SOL/USDT
Solana’s annual inflation rose by 96.5% a week after the SIMD 30.5% implementation introduced a new priority fee distribution model.
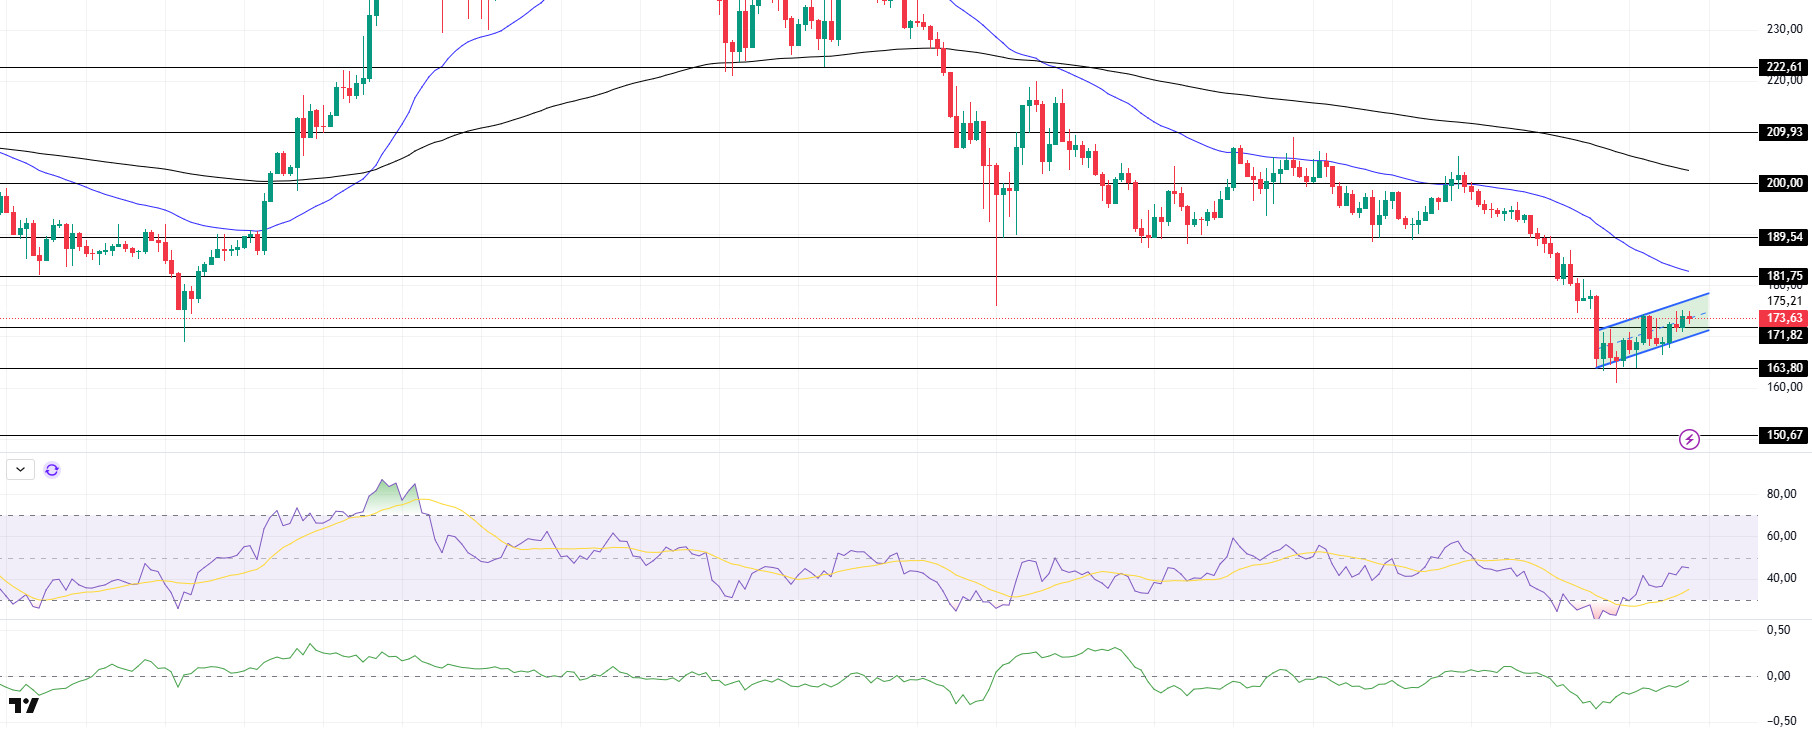
SOL has continued to move inside the pennant pattern since our analysis in the morning. On the 4-hour timeframe, the 50 EMA (Blue Line) continues to be below the 200 EMA (Black Line). This may continue to deepen the decline in the medium term. At the same time, the asset remains below both moving averages. However, the higher level between the two moving averages may move the asset up. When we examine the Chaikin Money Flow (CMF)20 indicator, the fact that the negative zone is close to the neutral level and the volume is declining may deepen the decline even though money outflows continue to decrease. This also means that sellers are more dominant. However, the Relative Strength Index (RSI)14 indicator moved from oversold territory to near the neutral level of the negative zone. This may give the opportunity for a downside move and cause the asset to fall further. At the same time, the falling flag pattern should be taken into account. The $ 200.00 level stands out as a very strong resistance place in the rises driven by both the upcoming macroeconomic data and the news in the Solana ecosystem. If it breaks here, the rise may continue. In case of retracements due to the opposite reasons or profit sales, the support level of $ 163.80 can be triggered again. If the price reaches these support levels, a potential bullish opportunity may arise if momentum increases.
Supports 171.82 – 163.80 – 150.67
Resistances 181.75 – 189.54 – 200.00
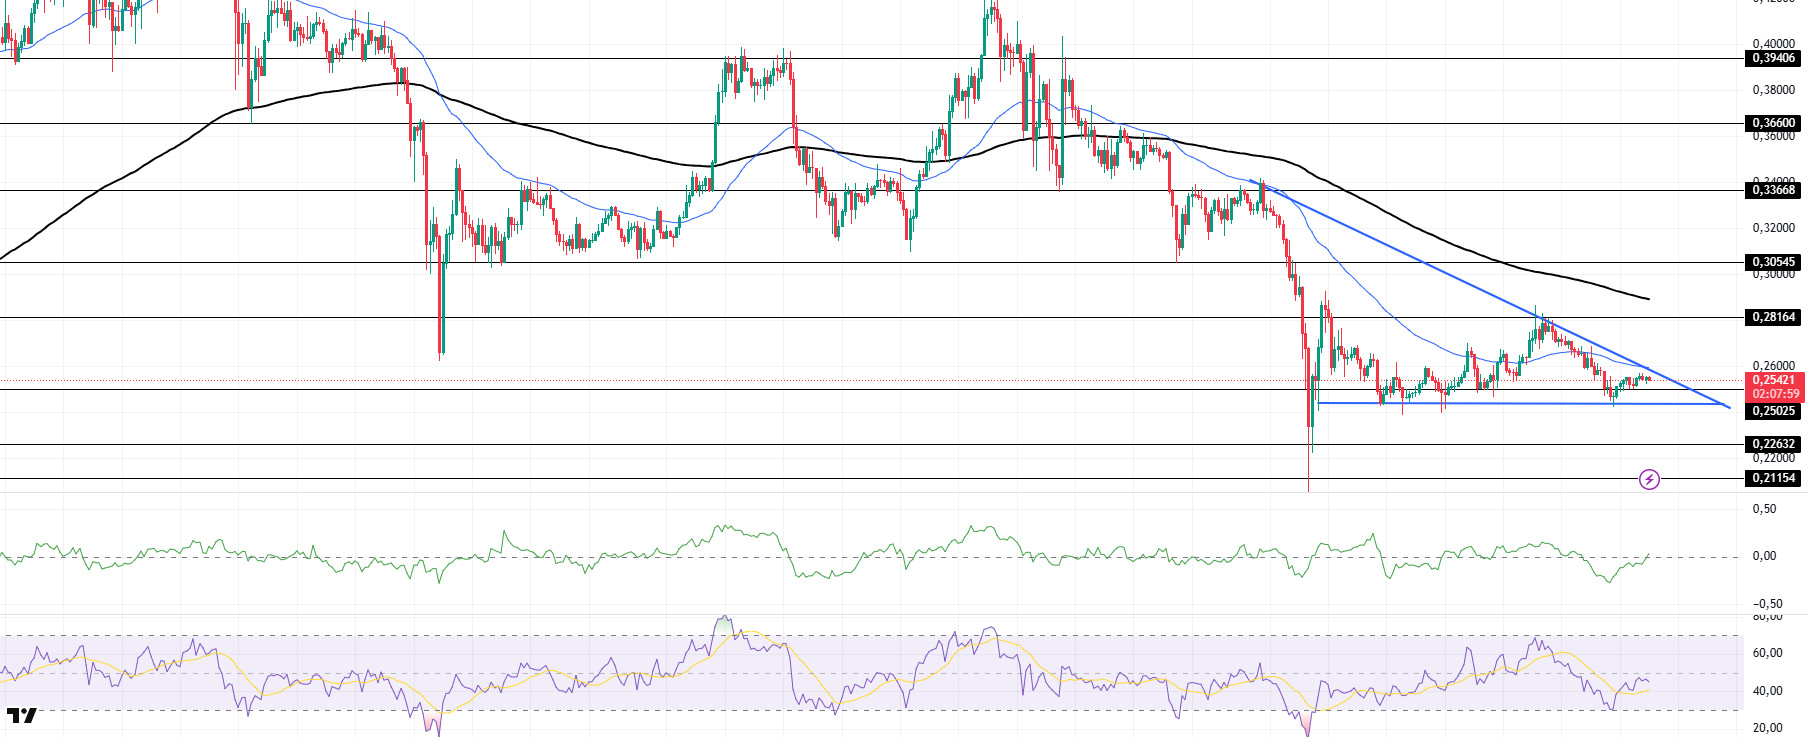
DOGE/USDT
House Democrats are pressuring GOP lawmakers to defect, pushing the Taxpayer Data Protection Act to block Musk’s DOGE from accessing federal records. In Onchainde, a Dogecoin whale transferred 100 million DOGE worth $25.42 million to a centralized crypto exchange, according to data from Whale Alert on February 20.
DOGE has moved sideways since our morning analysis and is poised to test the 50 EMA (Blue Line) as a resistance. At the same time, the asset continued to remain below the 50 EMA (Blue Line) 200 EMA (Black Line) on the 4-hour timeframe. This could mean that the decline could deepen further in the medium term. The price, however, remains below the two moving averages. However, the larger gap between the two moving averages could further increase the probability of DOGE moving higher. The Chaikin Money Flow (CMF)20 indicator is in the positive zone near the neutral level. Although this means that money inflows are increasing, the decline in volume shows us that the rise is not very strong. At the same time, Relative Strength Index (RSI)14 is in the negative zone near the neutral level. The falling triangle pattern should be followed. If it breaks down, the decline may deepen. The level of 0.33668 dollars appears as a very strong resistance place in the rises due to political reasons, macroeconomic data and innovations in the DOGE coin. In case of possible retracements due to political, macroeconomic reasons or negativities in the ecosystem, the base level of the trend, the $ 0.22632 level, is an important support. If the price reaches these support levels, a potential bullish opportunity may arise if momentum increases.
Supports 0.25025 – 0.22632 – 0.21154
Resistances 0.28164 – 0.30545 – 0.33668
LEGAL NOTICE
The investment information, comments and recommendations contained herein do not constitute investment advice. Investment advisory services are provided individually by authorized institutions taking into account the risk and return preferences of individuals. The comments and recommendations contained herein are of a general nature. These recommendations may not be suitable for your financial situation and risk and return preferences. Therefore, making an investment decision based solely on the information contained herein may not produce results in line with your expectations.

