
Fear & Greed Index
Source: Alternative
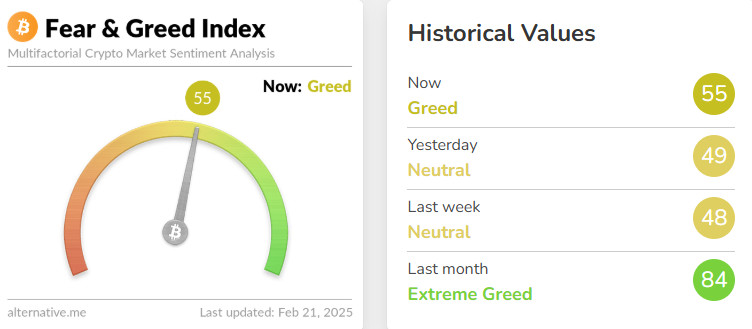
Change in Fear and Greed Value: +7
Last Week’s Level: 48
This Week’s Level: 55
This week, Fear & Greed Index rose to 55, up 7 points from last week. Investors remained cautiously optimistic despite the uncertainties in macro data, with Fed member Bowman stating that they expect inflation to fall but upside risks remain, and wage growth is above the inflation target. In particular, the FTX exchange’s repayment of approximately $800 million to 162,000 accounts and Metaplanet’s purchase of 68 Bitcoins, bringing its total assets to 2,100 BTC, increased the risk appetite in the crypto market; these developments reflected positively on investor sentiment and supported the rise of the index. In addition, the European Central Bank’s efforts to establish a blockchain-based payment system and the SEC’s creation of the “Cyber and New Technologies Unit” to combat cryptocurrency fraud reinforced investor confidence as regulatory steps gave clear signals. These balanced developments had a positive impact on the overall index level and played an important role in reaching 55.
Fund Flow
Source: CoinShares
Overview
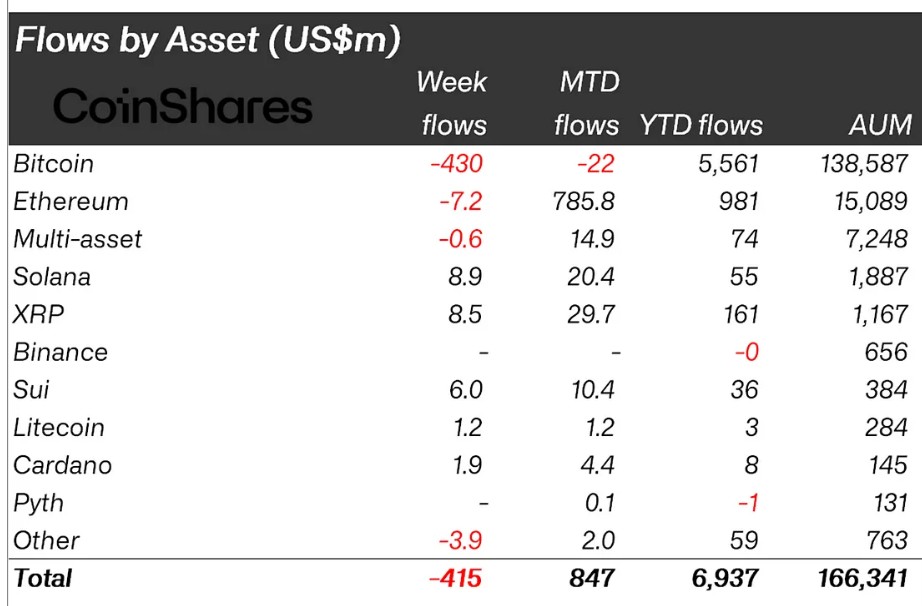
After the US elections, there has been an unprecedented outflow for 19 weeks. After a series of 29.4 billion dollars of inflows, it saw its first significant outflows totaling 415 million dollars.
Fund Inputs;
- Ripple (XRP): Ripple ETF Applications continue to be evaluated by the SEC. Ripple has seen 8.5 million $ entries.
- Solana (SOL): affected the Pump.fun platform, which manages about 60% of token launches in Solana. Solana saw a total inflow of $8.9 million with this news.
- SUI: SUI, a Tier-1 blockchain network, has launched new efforts to increase network growth. 6.0 million $ logins.
- Litecoin (LTC): Litecoin ETF applications were filed. With this news, there was an inflow of $ 1.2 million.
- Cardano (ADA): ADA is awaiting the SEC’s review of Cardano ETF filings. In the process, it has seen 1.9 million $ entries.
Fund Outflows:
Bitcoin (BTC): Bitcoin, which is highly sensitive to interest rate expectations, saw a total outflow of $430 million after the FOMC minutes released by the FED.
Ethereum (ETH): Ethereum saw a $7.2 million outflow as the Fed signaled a more hawkish monetary policy stance, triggered by a Congressional meeting and US inflation data that beat expectations.
Multi-asset: Grayscale ETHE ETF saw outflows totaling $15.8 million, while Multi Asset assets saw outflows of -$0.6 million.
- Other: Other altcoins saw -3.9 million $ outflows compared to last week, affected by market dynamics along with the sell-off brought by the FTX news.
Total MarketCap
Source: Tradingview
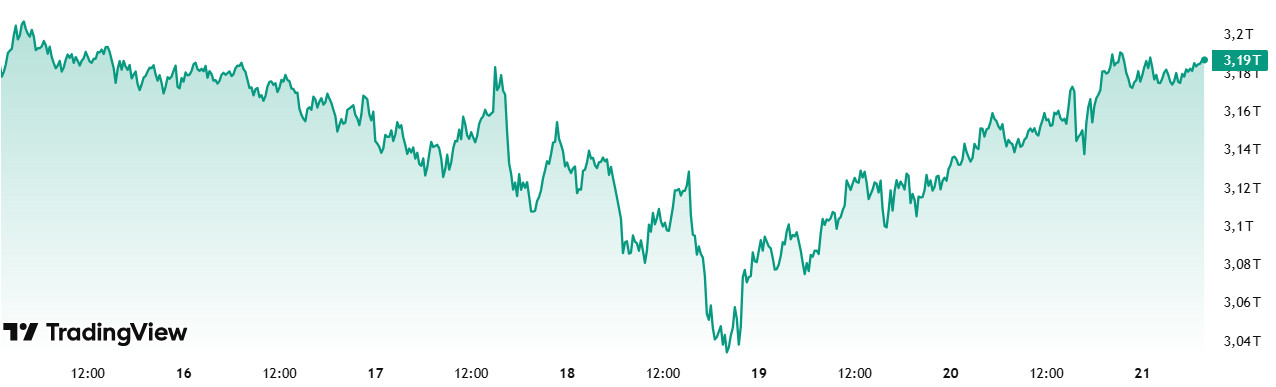
Last Week Market Capitalization: 3.19 trillion Dollars
Market Capitalization This Week: 3.14 trillion Dollars
The crypto market capitalization, which rose to $3.14 trillion at last week’s close, gained $48.02 billion this week, an increase of 1.53%, and continues to be traded at $3.19 trillion. The total market capitalization, which moved in the range of $ 3.21 – $ 3.02 trillion during the week, will start a two-week positive series if this week also closes positively.
Total 2
Total 2, which closed at $1.23 trillion last week, is showing a positive movement of 0.36% with an increase of $4.11 billion this week. If this week’s close on Total 2 is positive, it will be a two-week positive streak.
Altcoins, which make up about 40% of the crypto market, seem to have collected about 8.55% of the net amount entering the market this week. The altcoin market has been more sluggish this week compared to Bitcoin.
Total 3
When Total 3 is analyzed, it shows a negative course with an outflow of 8.20 billion dollars this week after an increase of approximately 39.38 billion dollars last week. Total 3, which accounts for about 10% of the total market, has exhibited a very negative performance compared to the overall crypto market.
The fact that Total 3 is following a negative course while Total and Total 2 are positive for the week may indicate that Bitcoin dominance continues to increase and Ethereum, which has been underperforming altcoins for a long time, may contain recovery signals. In the net flow on the market this week, $ 43.91 billion in net flow was concentrated on Bitcoin, while about $ 12.31 billion was concentrated on Ethereum, but other altcoins had a net outflow of $ 8.20 billion.
Bitcoin Dominance
Source: Tradingview
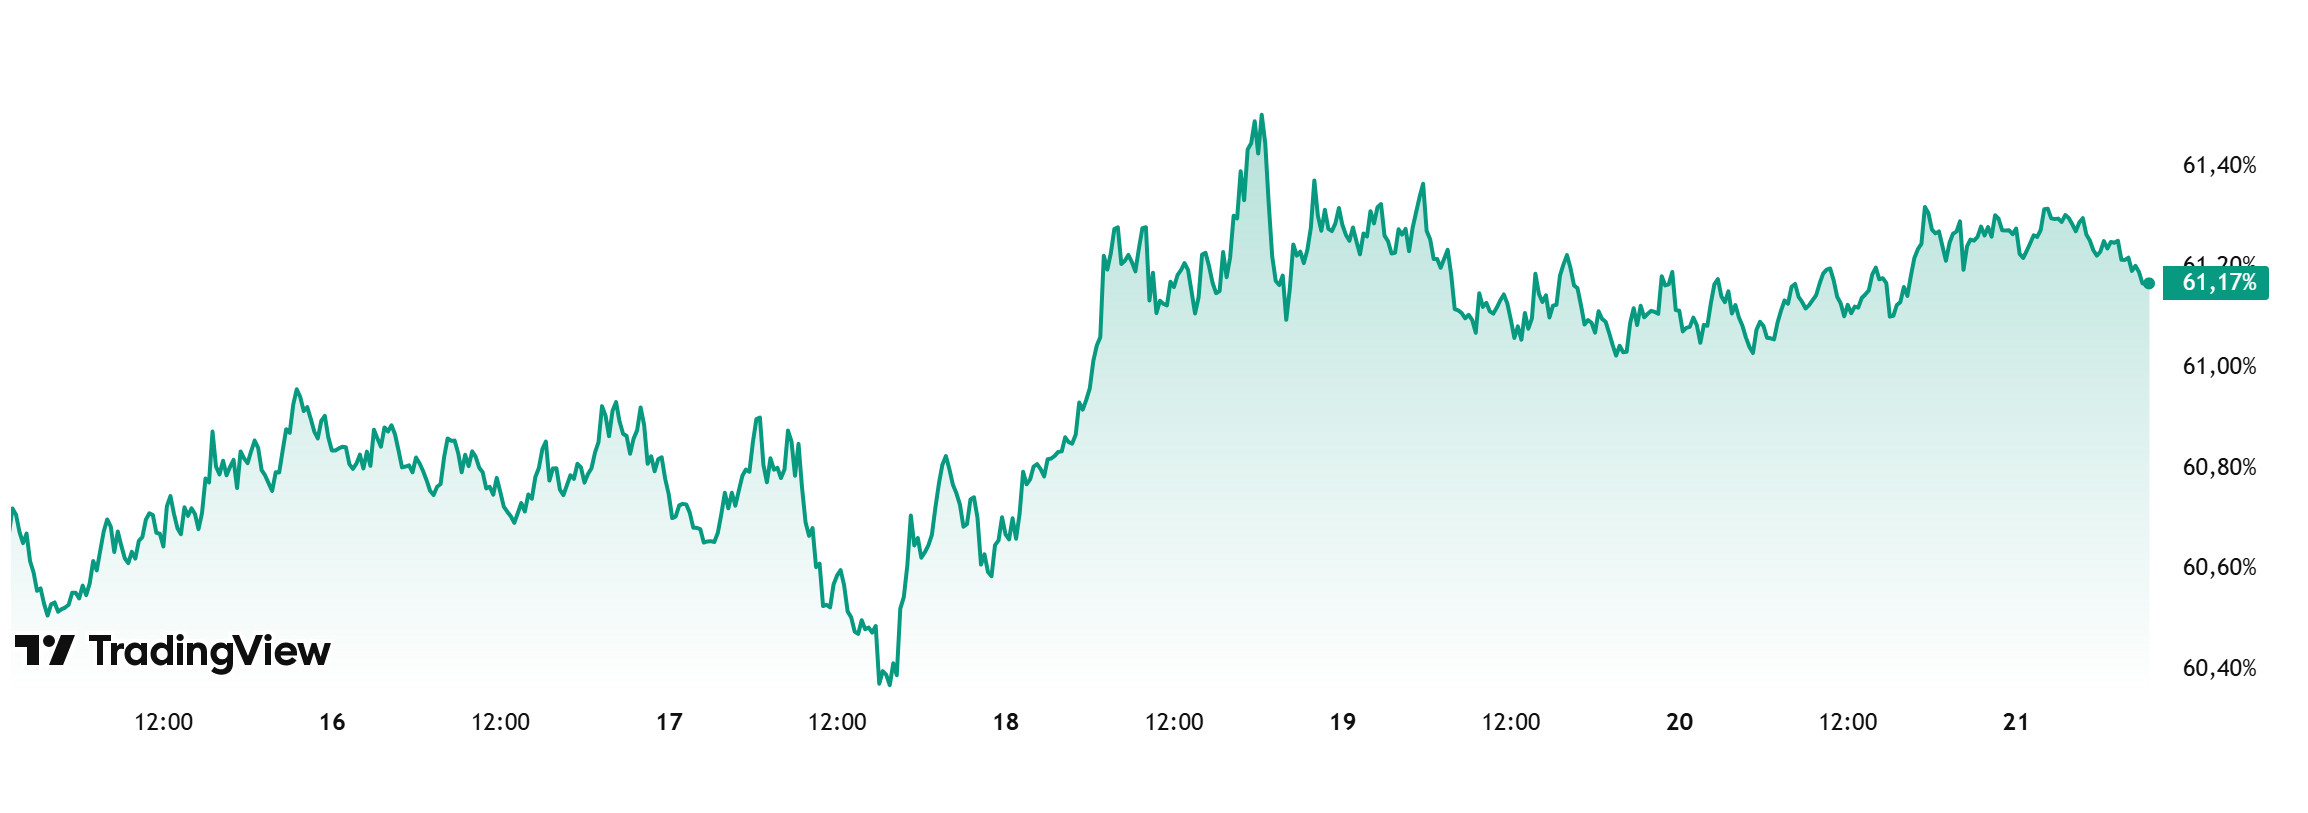
BTC dominance, which started the week at 60.72%, continued to rise throughout the week and is currently at 61.17%.
Gross domestic product and jobless claims data will be released in the US next week. Especially if the unemployment benefits data is announced in line with or slightly below expectations, it may be welcomed positively by the market. In this process, US President Trump’s positive statements about tariffs or Bitcoin may be positive for the markets and may greatly increase the interest of institutional and ETF investors.
If all these positive scenarios materialize, we can expect BTC dominance to rise to 62% – 63% in the new week.
Ethereum Dominance
Source: Tradingview
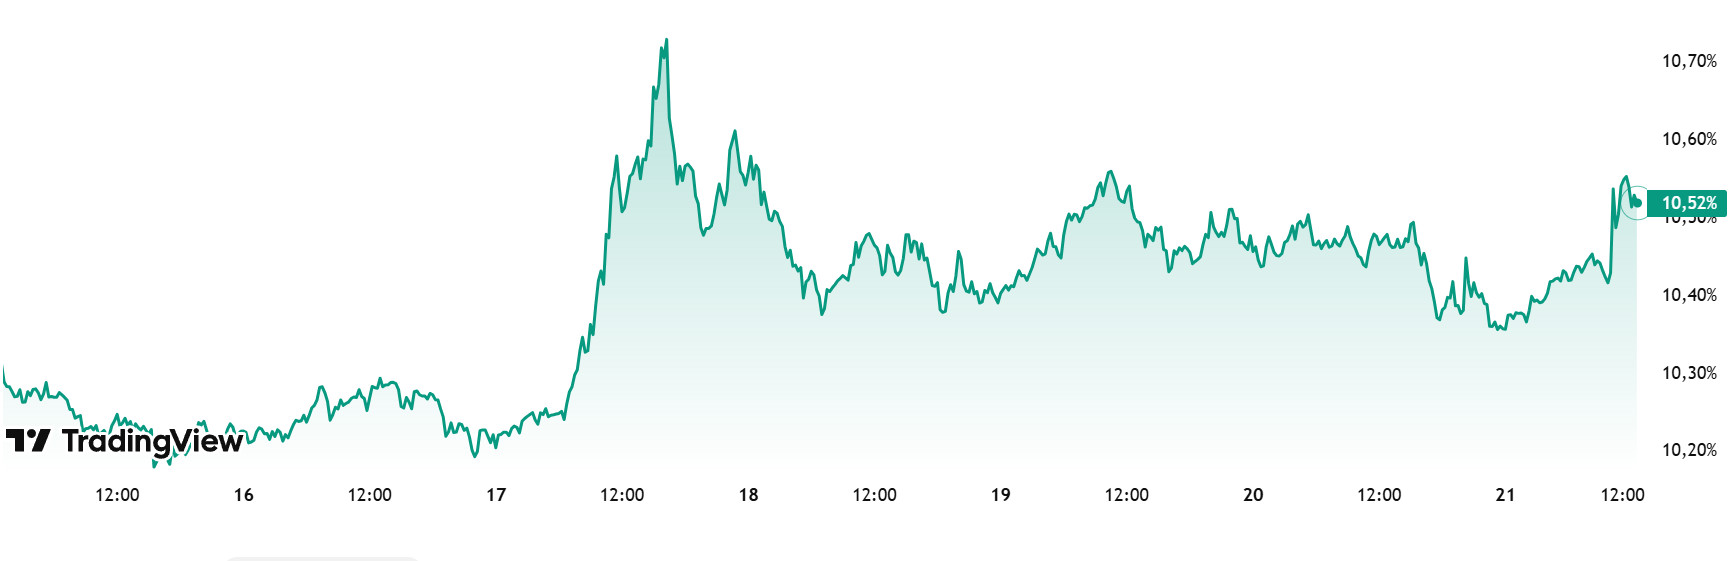
Weekly Change:
Last Week’s Level: 10.22%
This Week’s Level: 10.52%
Ethereum dominance continued its retreat from 12.90% in January 2025 until the first week of February, and the negative trend that maintained its effect in this process caused the dominance to decline to 9.23%. These levels are important as they were last seen in May 2020. The dominance, which has recovered from these levels, has gained a positive momentum in the last two weeks with the effect of Ethereum Spot ETF net inflows in the last two weeks and rose to 10.75% in the current week. In fact, between February 14-20, 2025, there was a total net inflow of $ 22.2 million in Spot Ethereum ETFs. However, despite a slight pullback from the 10.75% level, Ethereum dominance maintains its positive outlook on a weekly basis.
On the other hand, over the same period, Bitcoin dominance moved in the opposite direction, with a more limited positive trend in the last week compared to Ethereum dominance.
Accordingly, Ethereum dominance ended last week at 10.22%, while it is hovering at 10.52% as of the current week.
Bitcoin Spot ETF
Source: SosoValue
Featured Developments
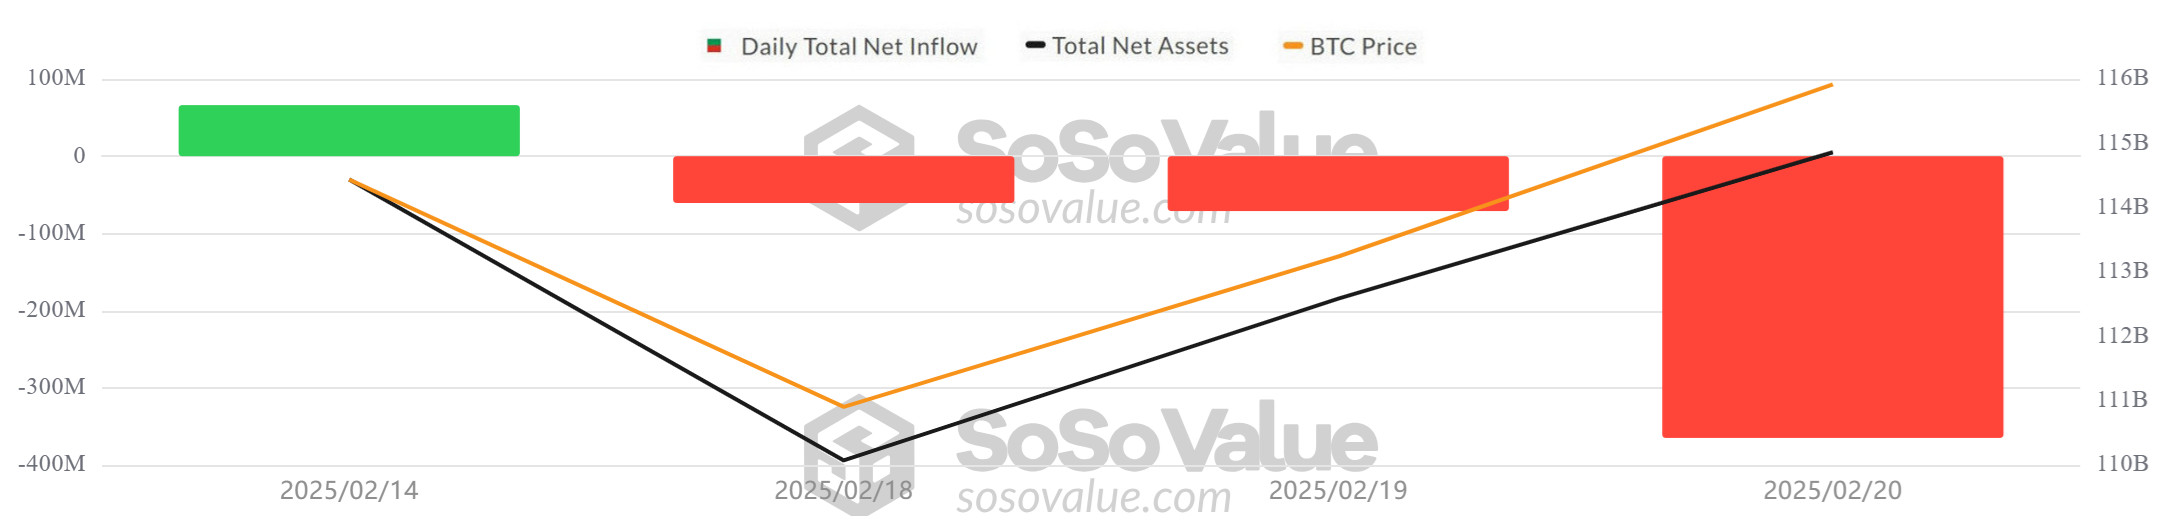
Negative Net Inflow Series: The negative net inflow streak extended to 3 days between February 14-20, 2025. Spot Bitcoin ETFs saw net outflows totaling -$419.0 million. The BlackRock IBIT ETF experienced this week’s largest daily outflow with outflows of $112 million. This was also recorded as the fund’s sixth largest outflow since its launch.
Bitcoin Price: Opening at $96,560 on February 14, 2025, Bitcoin rose 1.75% on the week to close at $98,252 on February 20. Despite negative ETF inflows, it rose 1.02% to $96,598 on February 19, and rose 1.71% to a weekly high of $98,252 on February 20.
Cumulative Net Inflows: Spot Bitcoin ETFs saw a total net outflow of -$419.0 million between February 14-20, 2025, while cumulative net inflows fell to $39.64 billion at the end of the 278th trading day.
| DATE | COIN | PRICE | ETF Flow (mil$) | ||
|---|---|---|---|---|---|
| Open | Close | Change % | ETF Flow (mil$) | ||
| 14-Feb-25 | BTC | 96,560 | 97,445 | 0.92% | 70.6 |
| 17-Feb-25 | BTC | 96,067 | 95,743 | -0.34% | 0 |
| 18-Feb-25 | BTC | 95,743 | 95,622 | -0.13% | -60.7 |
| 19-Feb-25 | BTC | 95,622 | 96,598 | 1.02% | -64.1 |
| 20-Feb-25 | BTC | 96,598 | 98,252 | 1.71% | -364.8 |
| Total for 14 – 20 Feb 25 | 1.75% | -419.0 | |||
Between February 14 and 20, 2025, while the Bitcoin price rallied, Bitcoin ETFs recorded negative net inflows. The BlackRock IBIT ETF experienced large outflows, while the Fidelity FBTC and Ark ARKB ETFs also recorded negative inflows. On the other hand, the price rose gradually throughout the week, indicating continued demand from investors in the spot market.
Following the tariffs imposed by the US, other countries also announced sanctions against the US. This led to the perception that a new trade war had begun. This uncertainty in global markets increased volatility in crypto markets and reduced investors’ risk appetite. Price movements are expected to continue to follow a volatile course due to the uncertainty created by the tariffs.
Ethereum spot ETF
Source: SosoValue
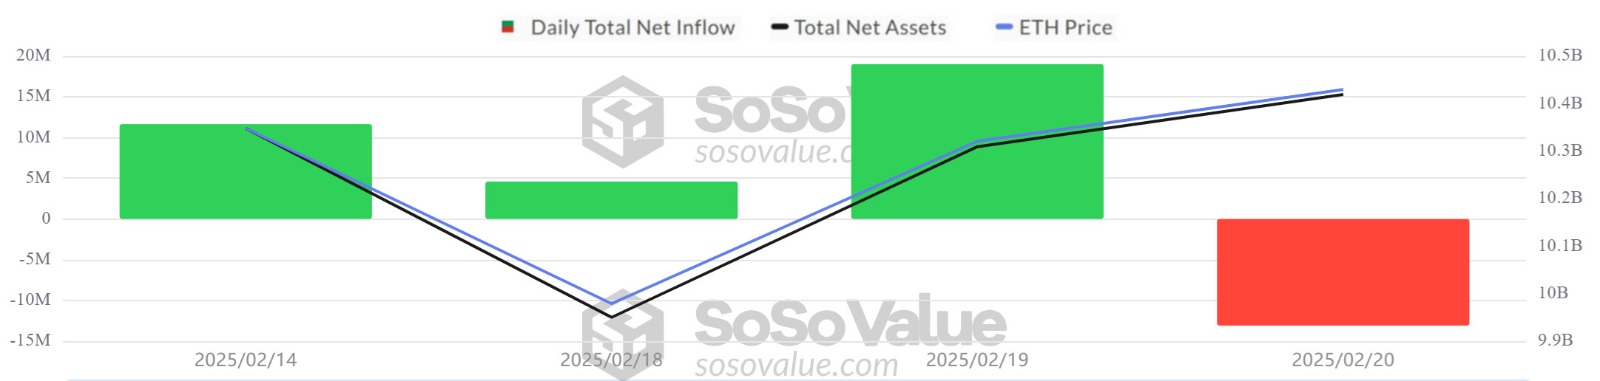
Between February 14-20, 2025, Spot Ethereum ETFs saw net inflows totaling $22.2 million. The Fidelity FETH ETF saw inflows totaling $38 million, while the Grayscale ETHE ETF saw outflows totaling $15.8 million. Starting from February 13, 2025, the positive net inflow streak ended on February 20, 2025. At the end of 146 trading days, total net inflows reached $3.16 billion. Ethereum opened the day at $ 2,674 on February 14, 2025, and closed at $ 2,736 on February 20, 2025. On a weekly basis, Ethereum price increased by 2.32%.
| DATE | COIN | PRICE | ETF Flow (mil$) | ||
|---|---|---|---|---|---|
| Open | Close | Change % | ETF Flow (mil$) | ||
| 14-Feb-25 | ETH | 2,674 | 2,724 | 1.87% | 11.7 |
| 17-Feb-25 | ETH | 2,660 | 2,743 | 3.12% | 0 |
| 18-Feb-25 | ETH | 2,743 | 2,670 | -2.66% | 4.6 |
| 19-Feb-25 | ETH | 2,670 | 2,714 | 1.65% | 19 |
| 20-Feb-25 | ETH | 2,714 | 2,736 | 0.81% | -13.1 |
| Total for 14 – 20 Feb 25 | 2.32% | 22.2 | |||
While the uncertainty in the markets continues due to the possibility of trade wars following the US tariffs, the ETF market continues to follow a volatile course by maintaining investor interest. Institutional investor interest may increase in the coming period, especially considering the potential impact of the Pectra update.
Bitcoin Options Breakdown
Source: Laevitas
Deribit Data: About 16,100 BTC options contracts with a notional value of about $1.58 billion expire today, Deribit data shows. According to the Deribit options feed, this month’s most favored options play was buying the $110,000 call option that expired on March 28, with buyers paying a cumulative net premium of over $6 million to avoid missing out on the upside. Another metric on Deribit, the BTC Volatility Index (DVOL), has fallen since January 20, from 72 to around 50.8. In its report, QCP Capital suggests that the crypto options market remains on the sidelines, waiting for concrete policy changes on pro-crypto rhetoric. This suggests that the crypto options market is waiting on the sidelines for concrete policy changes rather than just pro-crypto rhetoric. On the other hand, according to Deribit, a user paid $1.861 million to buy a $100,000 call option that expired at the end of April.
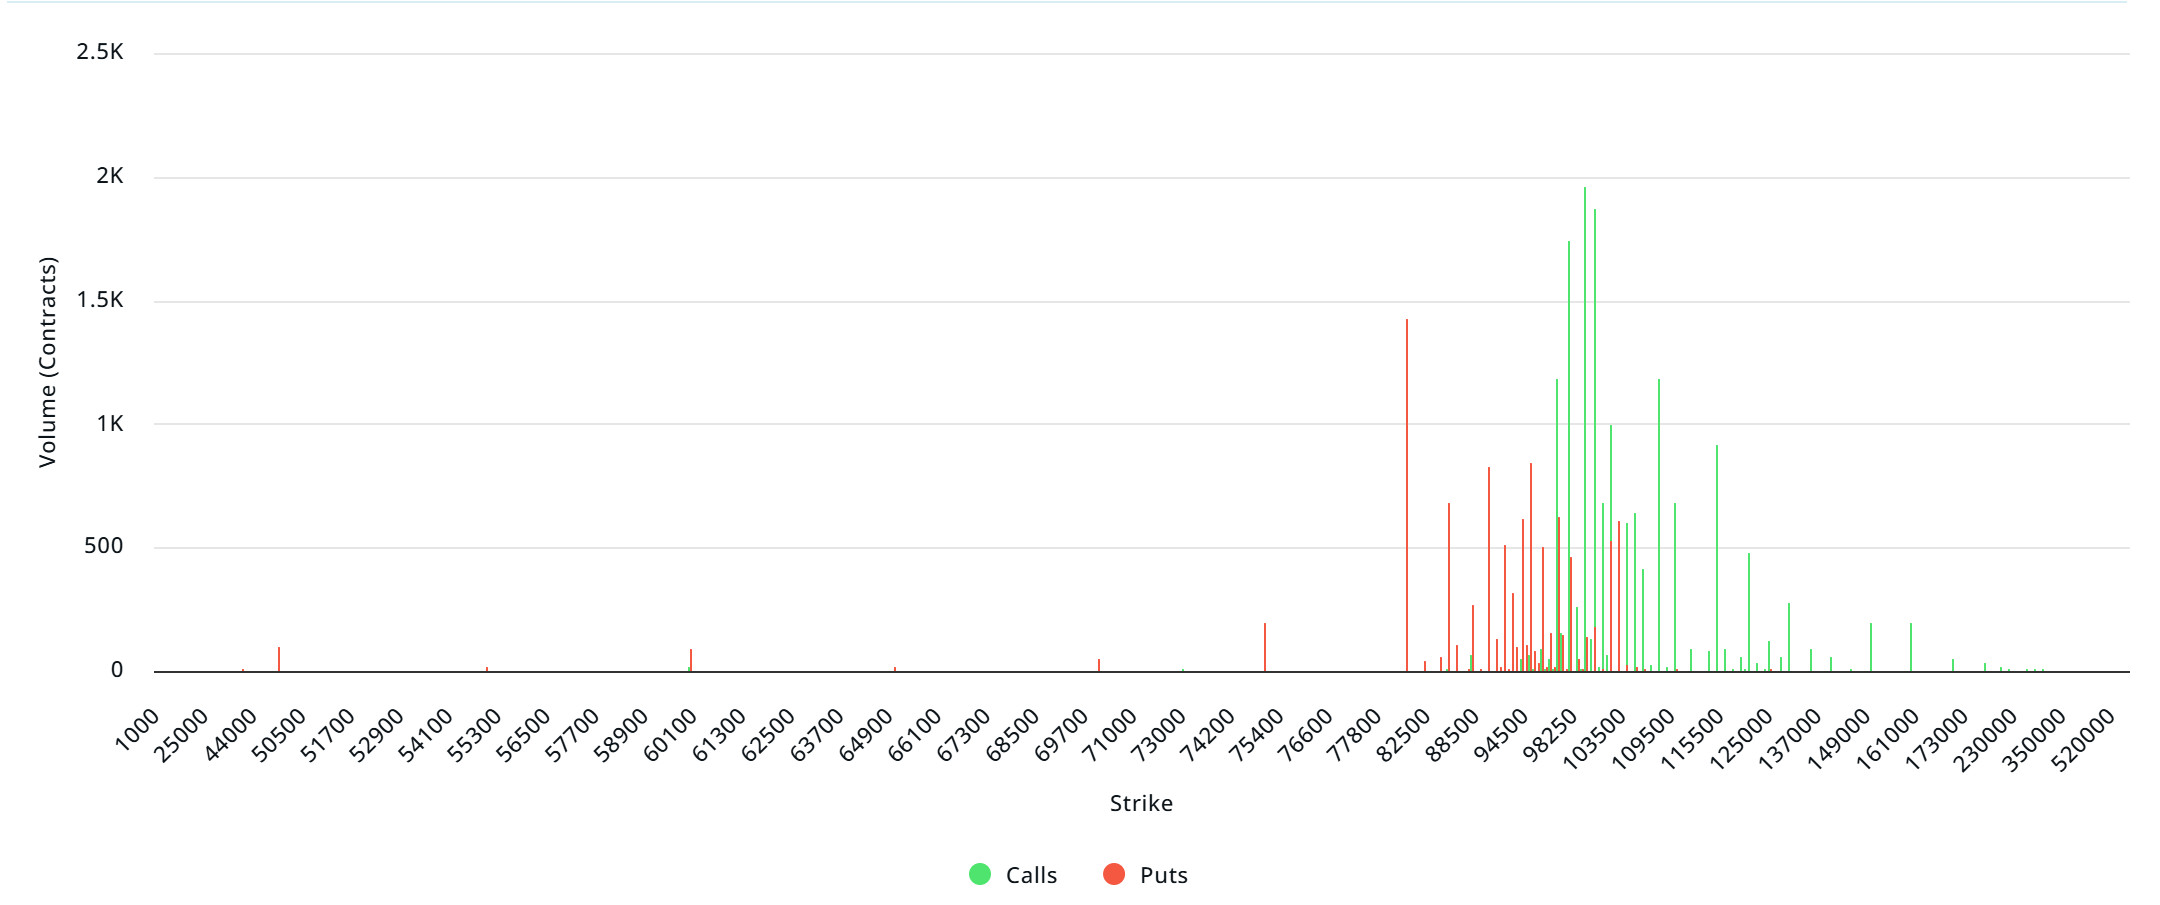
Laevitas Data: Bitcoin has mostly traded in a narrow range between $94,000 and $100,000 this month. The chart shows that put options are concentrated between $97,000 and $108,000. Call options, on the other hand, are concentrated between $ 87,000 and $ 103,500 and the concentration decreases towards the upper levels. At the same time, resistance has formed in the $ 97,000 – $ 100,000 band. In addition, the increase in the $108,000 call option due February 28, 2025 also supports the medium-term bullish expectation. On the other hand, there are 1.96K call options at the $ 99,000 level, where there is a peak and there is a decrease in volume after this level. On the other hand, there is a peak of 1.42K put options at the $80,000 level.
Option Expiration
Put/Call Ratio and Maximum Pain Point: If we look at the options in the last 7 days data from Laevitas, the number of call options was 59.47K, in line with last week. In contrast, the number of put options was 37.72K, also in line. The put/call ratio for options was set at 0.57. A put/call ratio of 0.57 indicates that there is a strong preference for call options over puts among investors and a possible uptrend in the markets. Bitcoin’s maximum pain point is set at $99,000. In the next 7 days, there are 4.28K call and 1.97K put options at the time of writing.
Ethereum Options Distribution
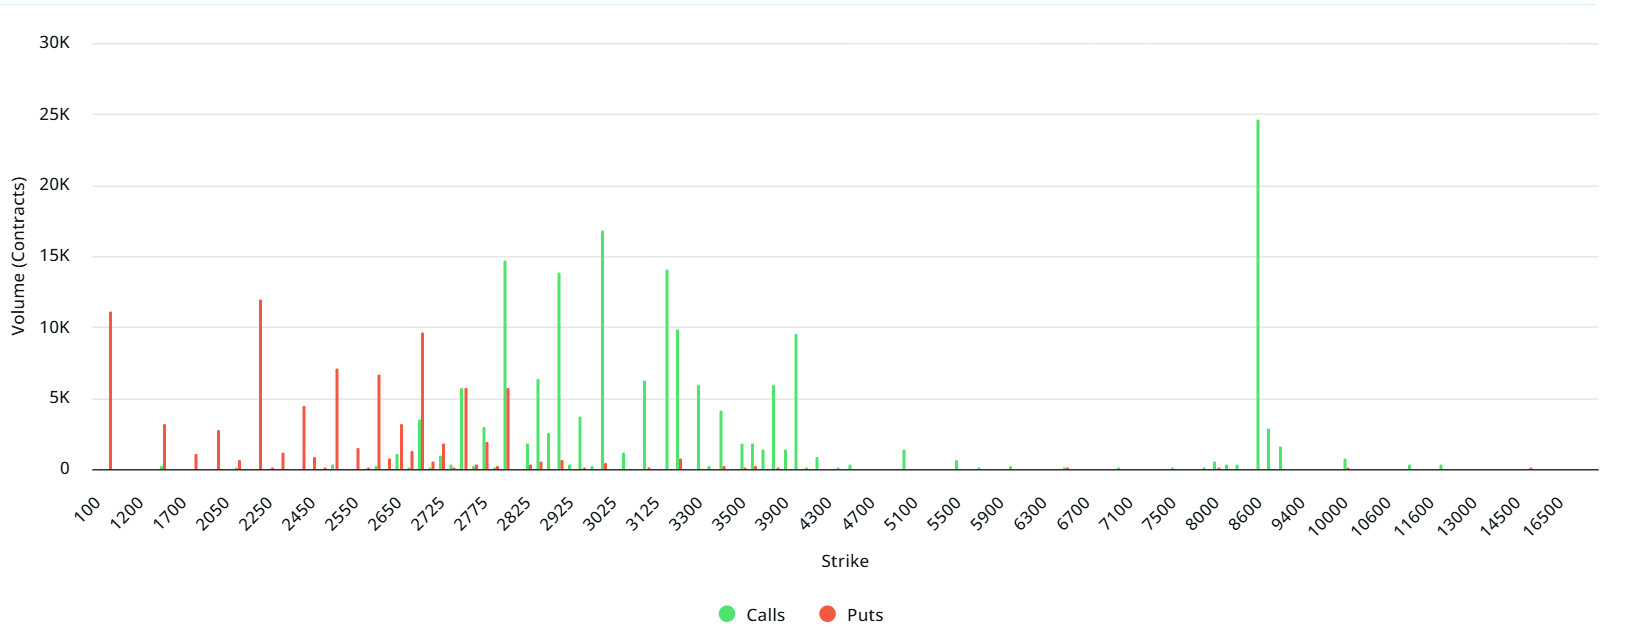
Source: Laevitas
Laevitas Data: The chart shows that Call options have higher volume than Put options. In the $3,000-3,250 range, there is a significant concentration of Call options, suggesting that market participants are bullish on these levels and that this level could be an important resistance point. On the other hand, we see a concentration of Put options around $2,400-2,600. We can consider these levels as a support point. Overall, the option volume distribution suggests that the market may fluctuate at current levels, but upside expectations are also strong due to the Call concentration above $3,000.
Deribit Data: Ethereum options with a notional value of $35.2 million expire on February 22.
Maximum Pain Point: $2,750.
Put/Call Ratio: 0.43. This shows that investors in the market are in a strong position to expect the price to rise.
LEGAL NOTICE
The investment information, comments and recommendations contained in this document do not constitute investment advisory services. Investment advisory services are provided by authorized institutions on a personal basis, taking into account the risk and return preferences of individuals. The comments and recommendations contained in this document are of a general type. These recommendations may not be suitable for your financial situation and risk and return preferences. Therefore, making an investment decision based solely on the information contained in this document may not result in results that are in line with your expectations.
