
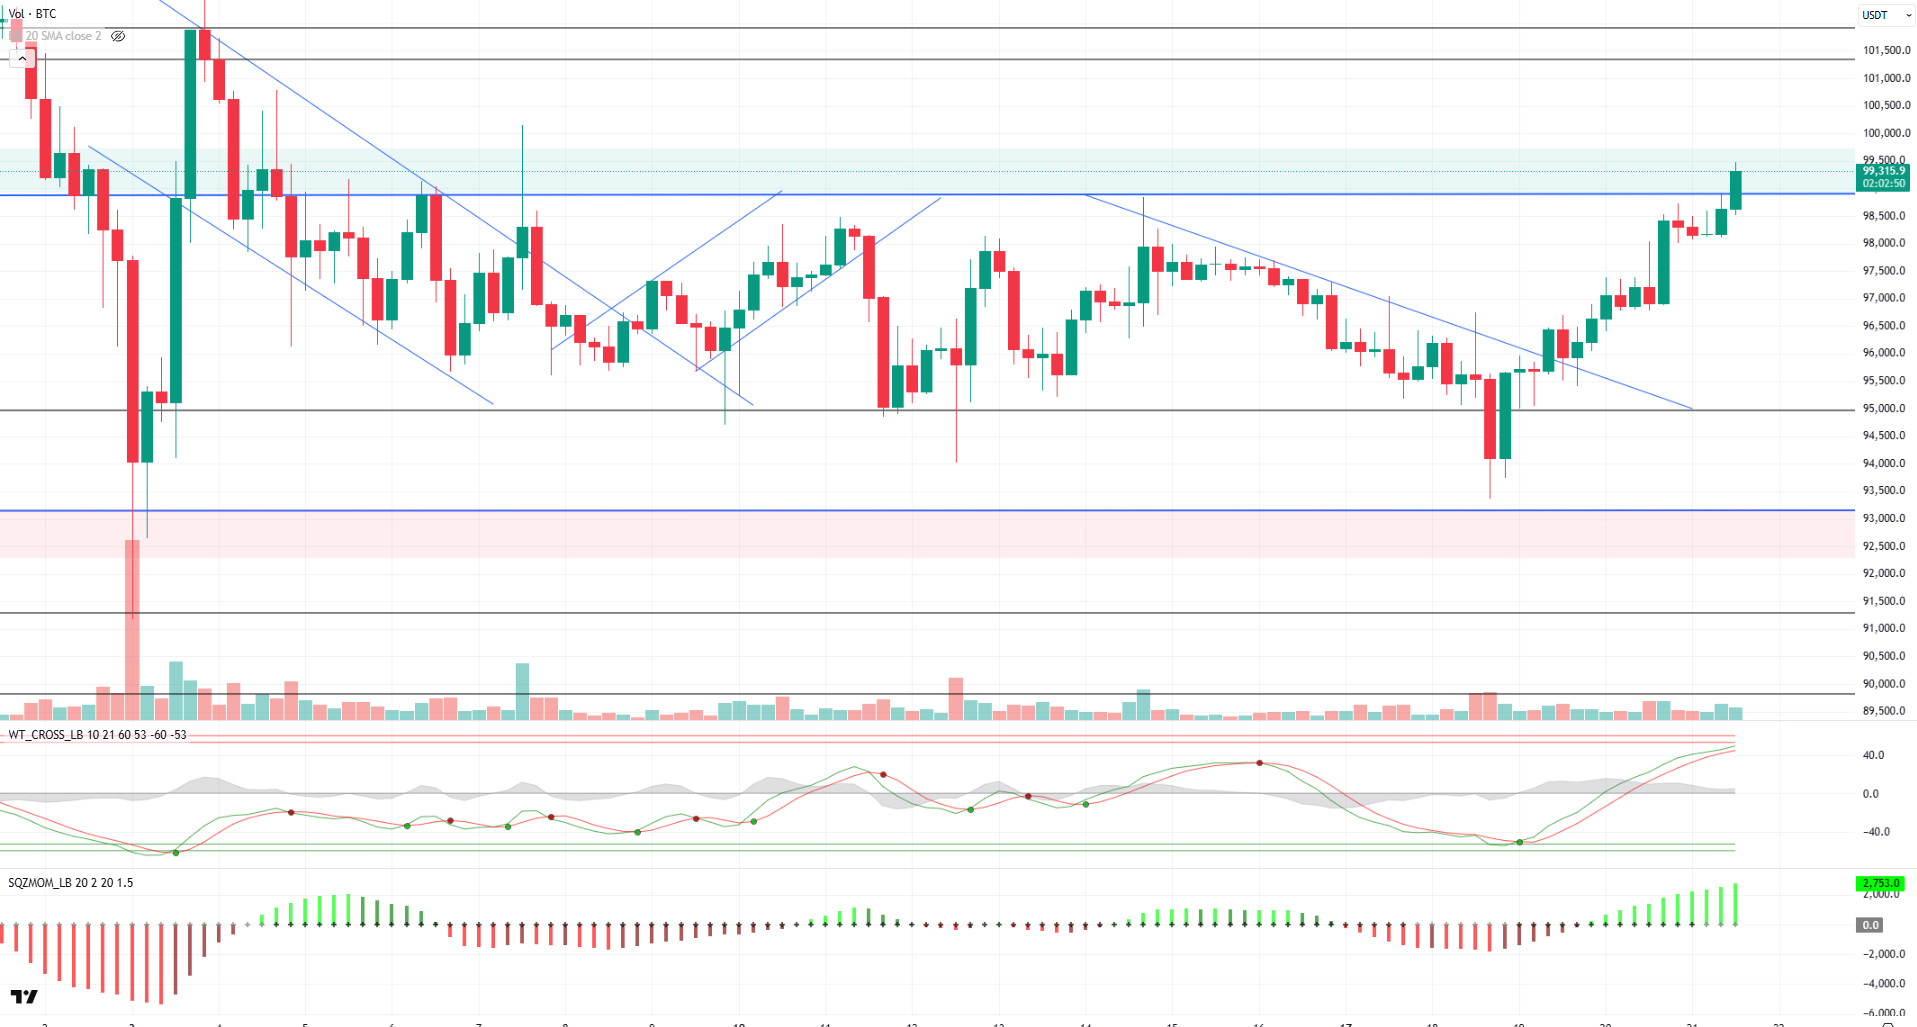
BTC/USDT
The crypto market has lacked positive catalysts in the short term, with Bitcoin futures hovering close to spot prices, suggesting that investor demand is waning. However, the fact that Bitcoin continues to move close to six-digit levels reinforces signs that the Bitcoin bull cycle continues.
Looking at the technical outlook, BTC price regained momentum after being rejected at 99,000 on the first 4-hour candle attempt. Currently, BTC is trading at 99,300, trying to hold within the green band range. The shorts opened after the 99,000 level was breached have been liquidated and this seems to have supported the price’s rise. When technical oscillators are analyzed, it is observed that the indicators are close to the overbought zone. This stands out as a factor that strengthens the possibility of a correction in the short term. BTC is likely to experience a short-term retracement, especially if a volume-supported sales wave comes. In a possible pullback scenario, the 96,000 and 97,000 bands will be followed as strong support levels due to the accumulation of long positions that intensified according to the liquidation heatmap. These areas may constitute critical areas for the price to recover. On the other hand, if the price continues to rise without entering a correction, BTC can be expected to surpass six-digit levels. In this scenario, the first target is 101,400 as a minor resistance zone. Breaching this level could increase the price’s potential to test higher highs.
Supports 97,000 – 95,000 – 92,800
Resistances 99,100 -101,400 – 102,800
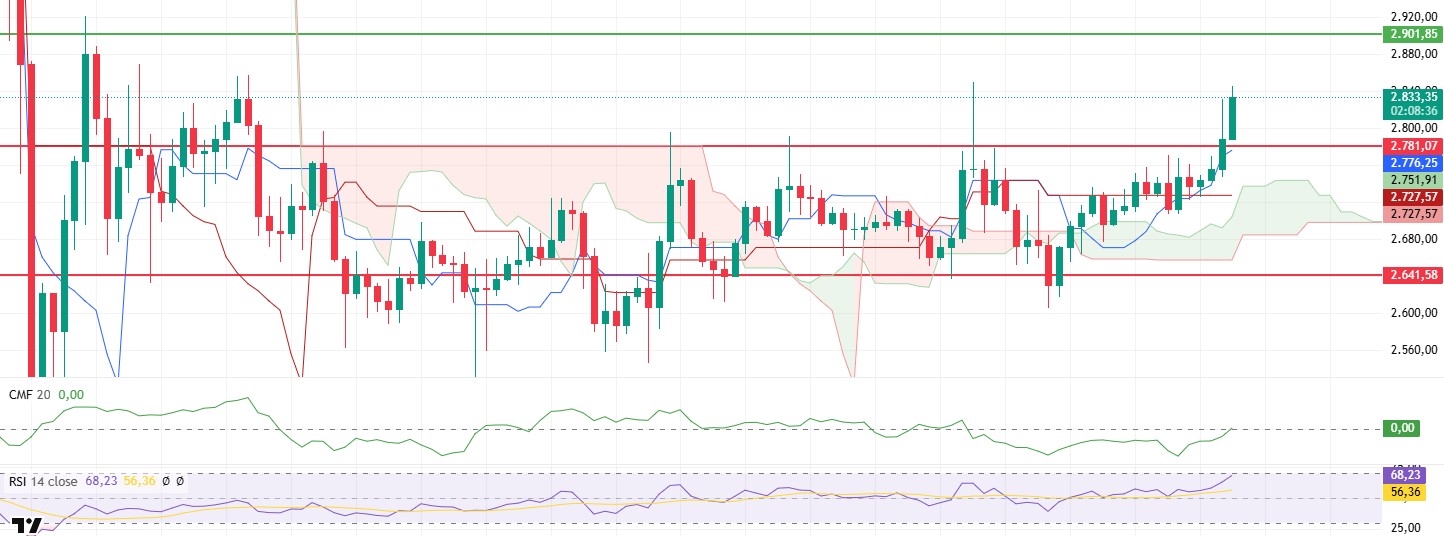
ETH/USDT
During the day, ETH strongly overcame the resistance at $2,781 and rose as high as $2,840. This movement has led to significant changes in technical indicators and signals that should be carefully analyzed in terms of the current dynamics of the market.
Cumulative Volume Delta (CVD) showed a slight increase in spot buying. While CVD indicates that spot buyers have started to show interest in the market again, the Chaikin Money Flow (CMF) indicator moved into positive territory after a long time, indicating that the liquidity flow has also strengthened in the direction of buyers. CMF’s move into positive territory suggests that the buying pressure has increased and the market has reached a healthier structure in terms of liquidity. The Relative Strength Index (RSI) indicator continues to rise without showing any negative divergence so far. However, the fact that the RSI has approached the overbought zone is an important signal that profit sales may come at this point. Considering that volatility tends to increase in overbought areas, the possibility of a correction in the short term should not be ignored. Looking at the Ichimoku indicator, the current buy signal continues and the cloud level has started to rise. Although this suggests that the overall trend is still positive, it suggests that volume-supported purchases should increase for a sustainable rise.
Although technical indicators generally give positive signals, the fact that the buying support in the spot market is not yet strong enough and the RSI indicator is approaching overbought levels indicates that there may be some correction from current levels. In this scenario, the $2,781 level stands out as a strong support point. If this level is broken downwards, the possibility of a sharper retracement may arise. For the continuation of the upward movement, the $ 2,901 level is a critical resistance point. If this region is exceeded, the beginning of a new uptrend for ETH could be on the agenda.
Supports 2,781 – 2,641 – 2,501
Resistances 2,901 – 2,992 – 3,131
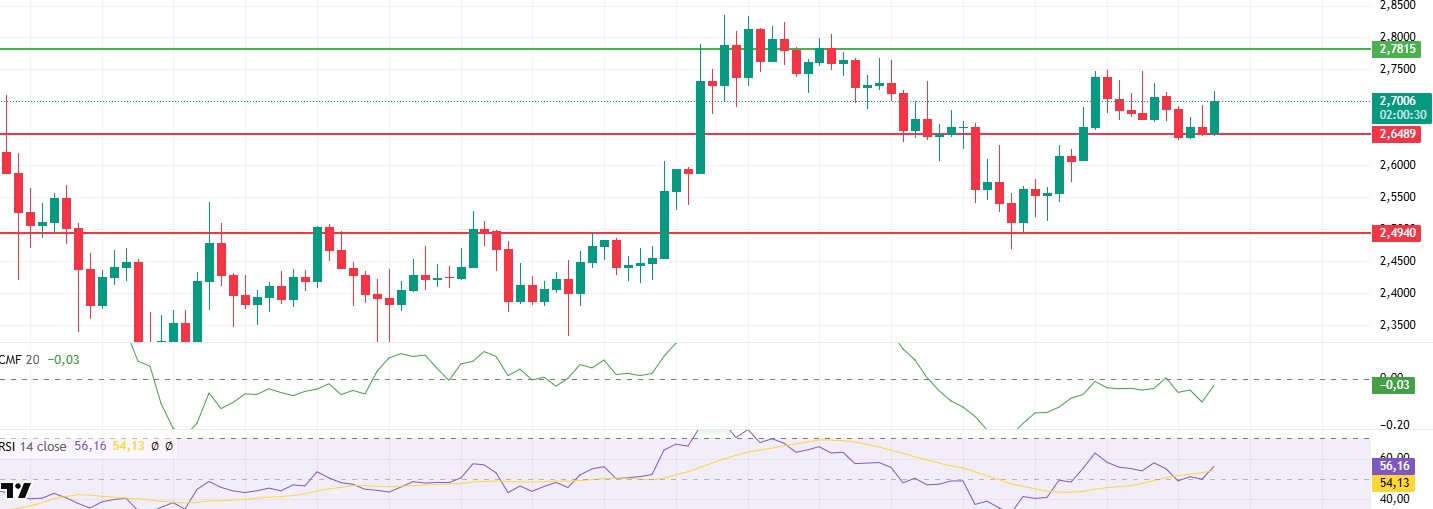
XRP/USDT
XRP tested a critical support point by falling to the level of $ 2.65 after the decline it experienced yesterday evening. XRP, which recovered again with the reaction purchases it received from this level, managed to exceed the limits of the kumo cloud and gave a technically positive signal. However, when the price action is analyzed, it is seen that trading volumes remain at low levels despite the current rise. If the rise is not supported by strong buying support, it may create a fragile structure.
The Chaikin Money Flow (CMF) indicator continues its bullish trend, but is still in negative territory. This suggests that sellers are more dominant in the market. The Relative Strength Index (RSI) indicator is moving upwards, indicating that momentum remains positive. If the momentum indicator maintains this trend, upward price movements may continue in the short term. However, the fact that the RSI is approaching overbought levels with low volumes indicates that selling pressure may increase if buyers lose strength.
In general, technical data suggests that XRP may exhibit gradual rises during the day. However, the lack of volume support for these rises may make sustainability difficult. In a possible pullback, the $2.65 level stands out as a critical support point. If this level is broken, selling pressure may increase and the price may enter a deeper correction. For the continuation of the upward movement, purchases supported by an increase in volume are required.
Supports 2.6489 – 2.4940 – 2.2502
Resistances 2.7815 – 2.9198 – 3.2075
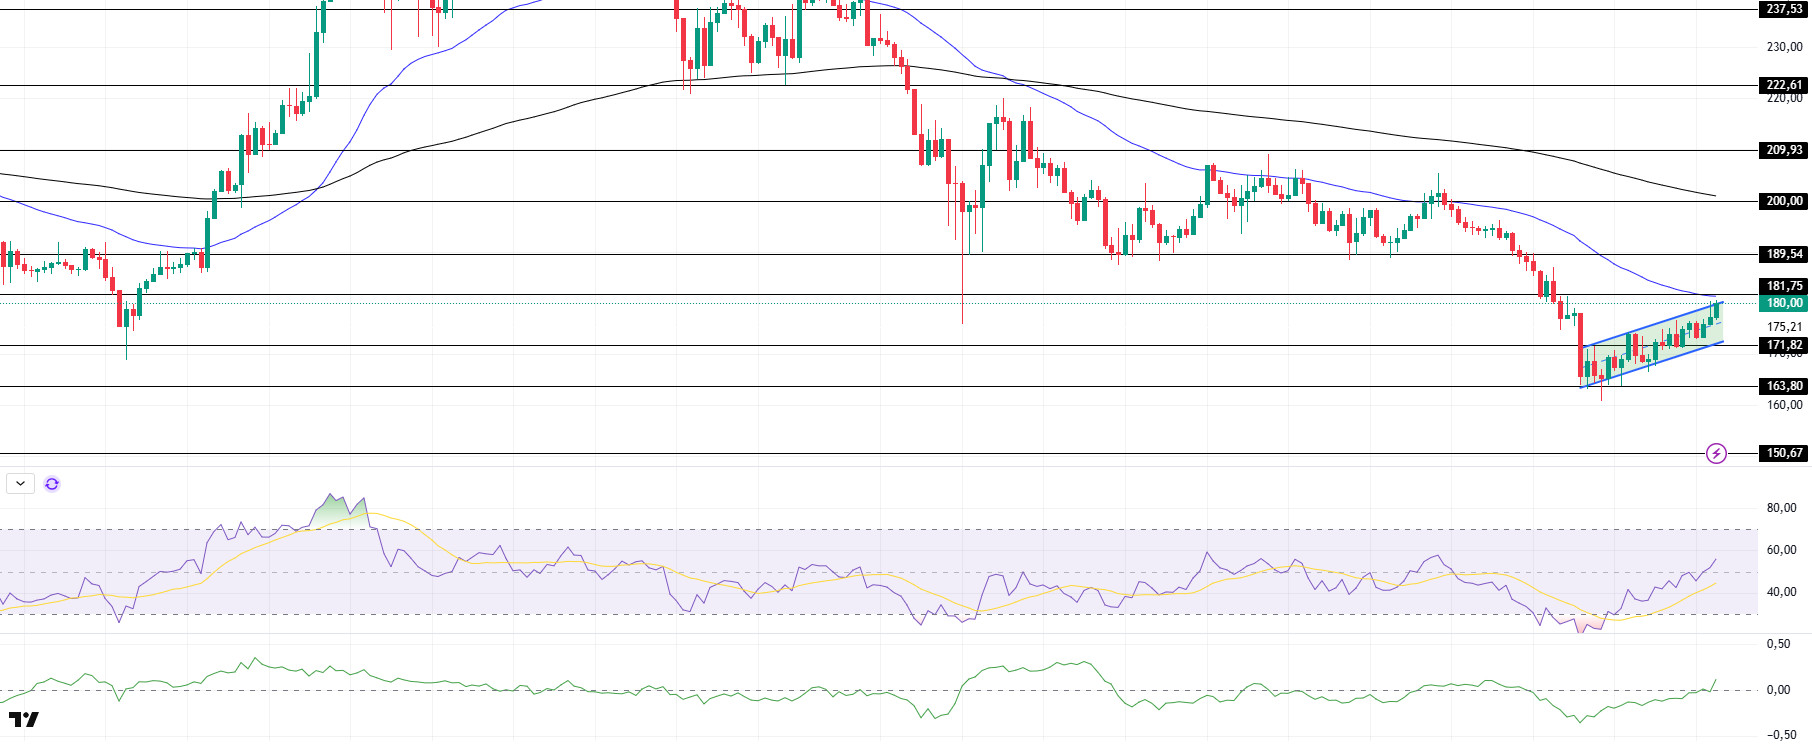
SOL/USDT
Solana’s memecoin launchpad Pump.fun is experiencing a decline in activity as daily launches and revenues have fallen below their usual benchmarks. Daily token launches on Solana fell from an all-time high of 95,578 on January 26 to a low of 49,779 on February 19.
Since our analysis in the morning, SOL has continued to rise within the uptrend and is currently testing both the top of the trend and the 50 EMA (Blue Line). On the 4-hour timeframe, the 50 EMA (Blue Line) is below the 200 EMA (Black Line). This could continue to deepen the decline in the medium term. At the same time, the asset continued to remain below both moving averages. However, the higher level between the two moving averages may move the asset up. When we examine the Chaikin Money Flow (CMF)20 indicator, it is at a positive level, but the increase in volume may mean that money inflows have increased strongly and there is buying pressure. However, the Relative Strength Index (RSI)14 indicator has risen into positive territory. The $ 200.00 level appears to be a very strong resistance point in the rises driven by both the upcoming macroeconomic data and the news in the Solana ecosystem. If it breaks here, the rise may continue. In case of retracements for the opposite reasons or due to profit sales, the support level of $ 163.80 can be triggered again. If the price reaches these support levels, a potential bullish opportunity may arise if momentum increases.
Supports 171.82 – 163.80 – 150.67
Resistances 181.75 – 189.54 – 200.00
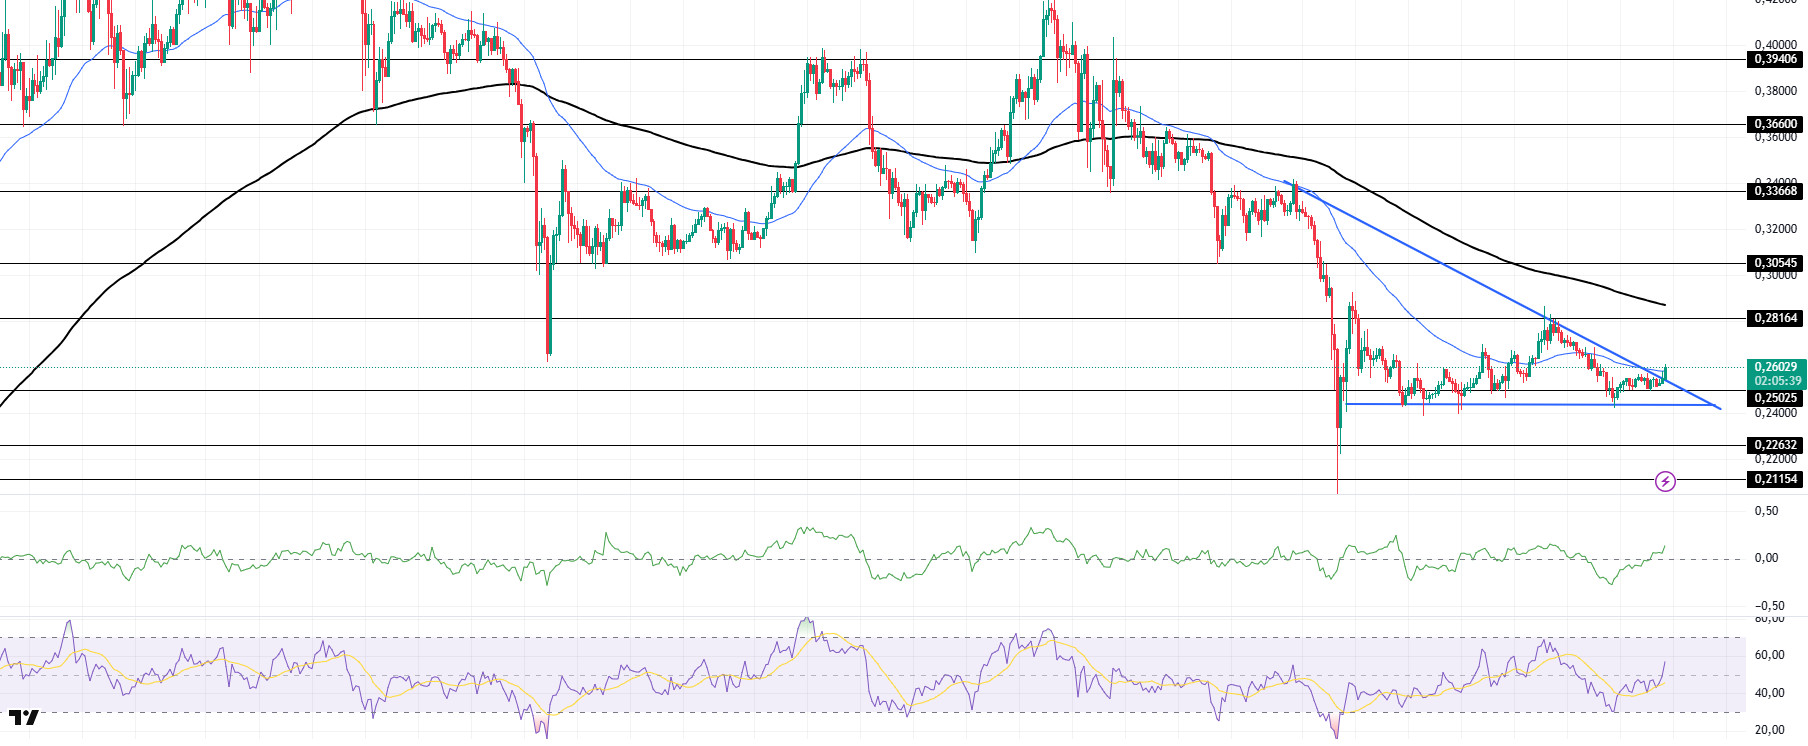
DOGE/USDT
Dogecoin whales continue to accumulate DOGE. In the last 48 hours, 110 million DOGE tokens were purchased.
DOGE has been trending higher since our morning analysis and is currently testing the 50 EMA (Blue Line) as resistance, breaking the falling triangle pattern. At the same time, the asset is below the 50 EMA (Blue Line) 200 EMA (Black Line) on the 4-hour timeframe. This could mean that the decline could deepen further in the medium term. However, the price is below two moving averages. However, the larger gap between the two moving averages could further increase the probability of DOGE moving higher. The Chaikin Money Flow (CMF)20 indicator is in positive territory. This means that money inflows are increasing, but the increase in volume shows us that the rise may be strong. At the same time, Relative Strength Index (RSI)14 is at a positive level. The $ 0.33668 level is a very strong resistance point in the rises due to political reasons, macroeconomic data and innovations in the DOGE coin. In case of possible pullbacks due to political, macroeconomic reasons or negativities in the ecosystem, the $0.22632 level, which is the base level of the trend, is an important support. If the price reaches these support levels, a potential bullish opportunity may arise if momentum increases.
Supports 0.25025 – 0.22632 – 0.21154
Resistances 0.28164 – 0.30545 – 0.33668
LEGAL NOTICE
The investment information, comments and recommendations contained herein do not constitute investment advice. Investment advisory services are provided individually by authorized institutions taking into account the risk and return preferences of individuals. The comments and recommendations contained herein are of a general nature. These recommendations may not be suitable for your financial situation and risk and return preferences. Therefore, making an investment decision based solely on the information contained herein may not produce results in line with your expectations.

