
Technical Analysis
BTC/USDT
Bybit, a cryptocurrency exchange, lost $1.4 billion in assets as a result of a massive cyberattack. According to Onchain data, attackers used cross-chain exchange platforms such as Chainflip, THORChain, LiFi, DLN and eXch to convert approximately 37,900 ETH ($106 million) into other assets such as BTC. Bitcoin, which was pushing six-digit levels before the attack, retreated sharply to below 95,000.
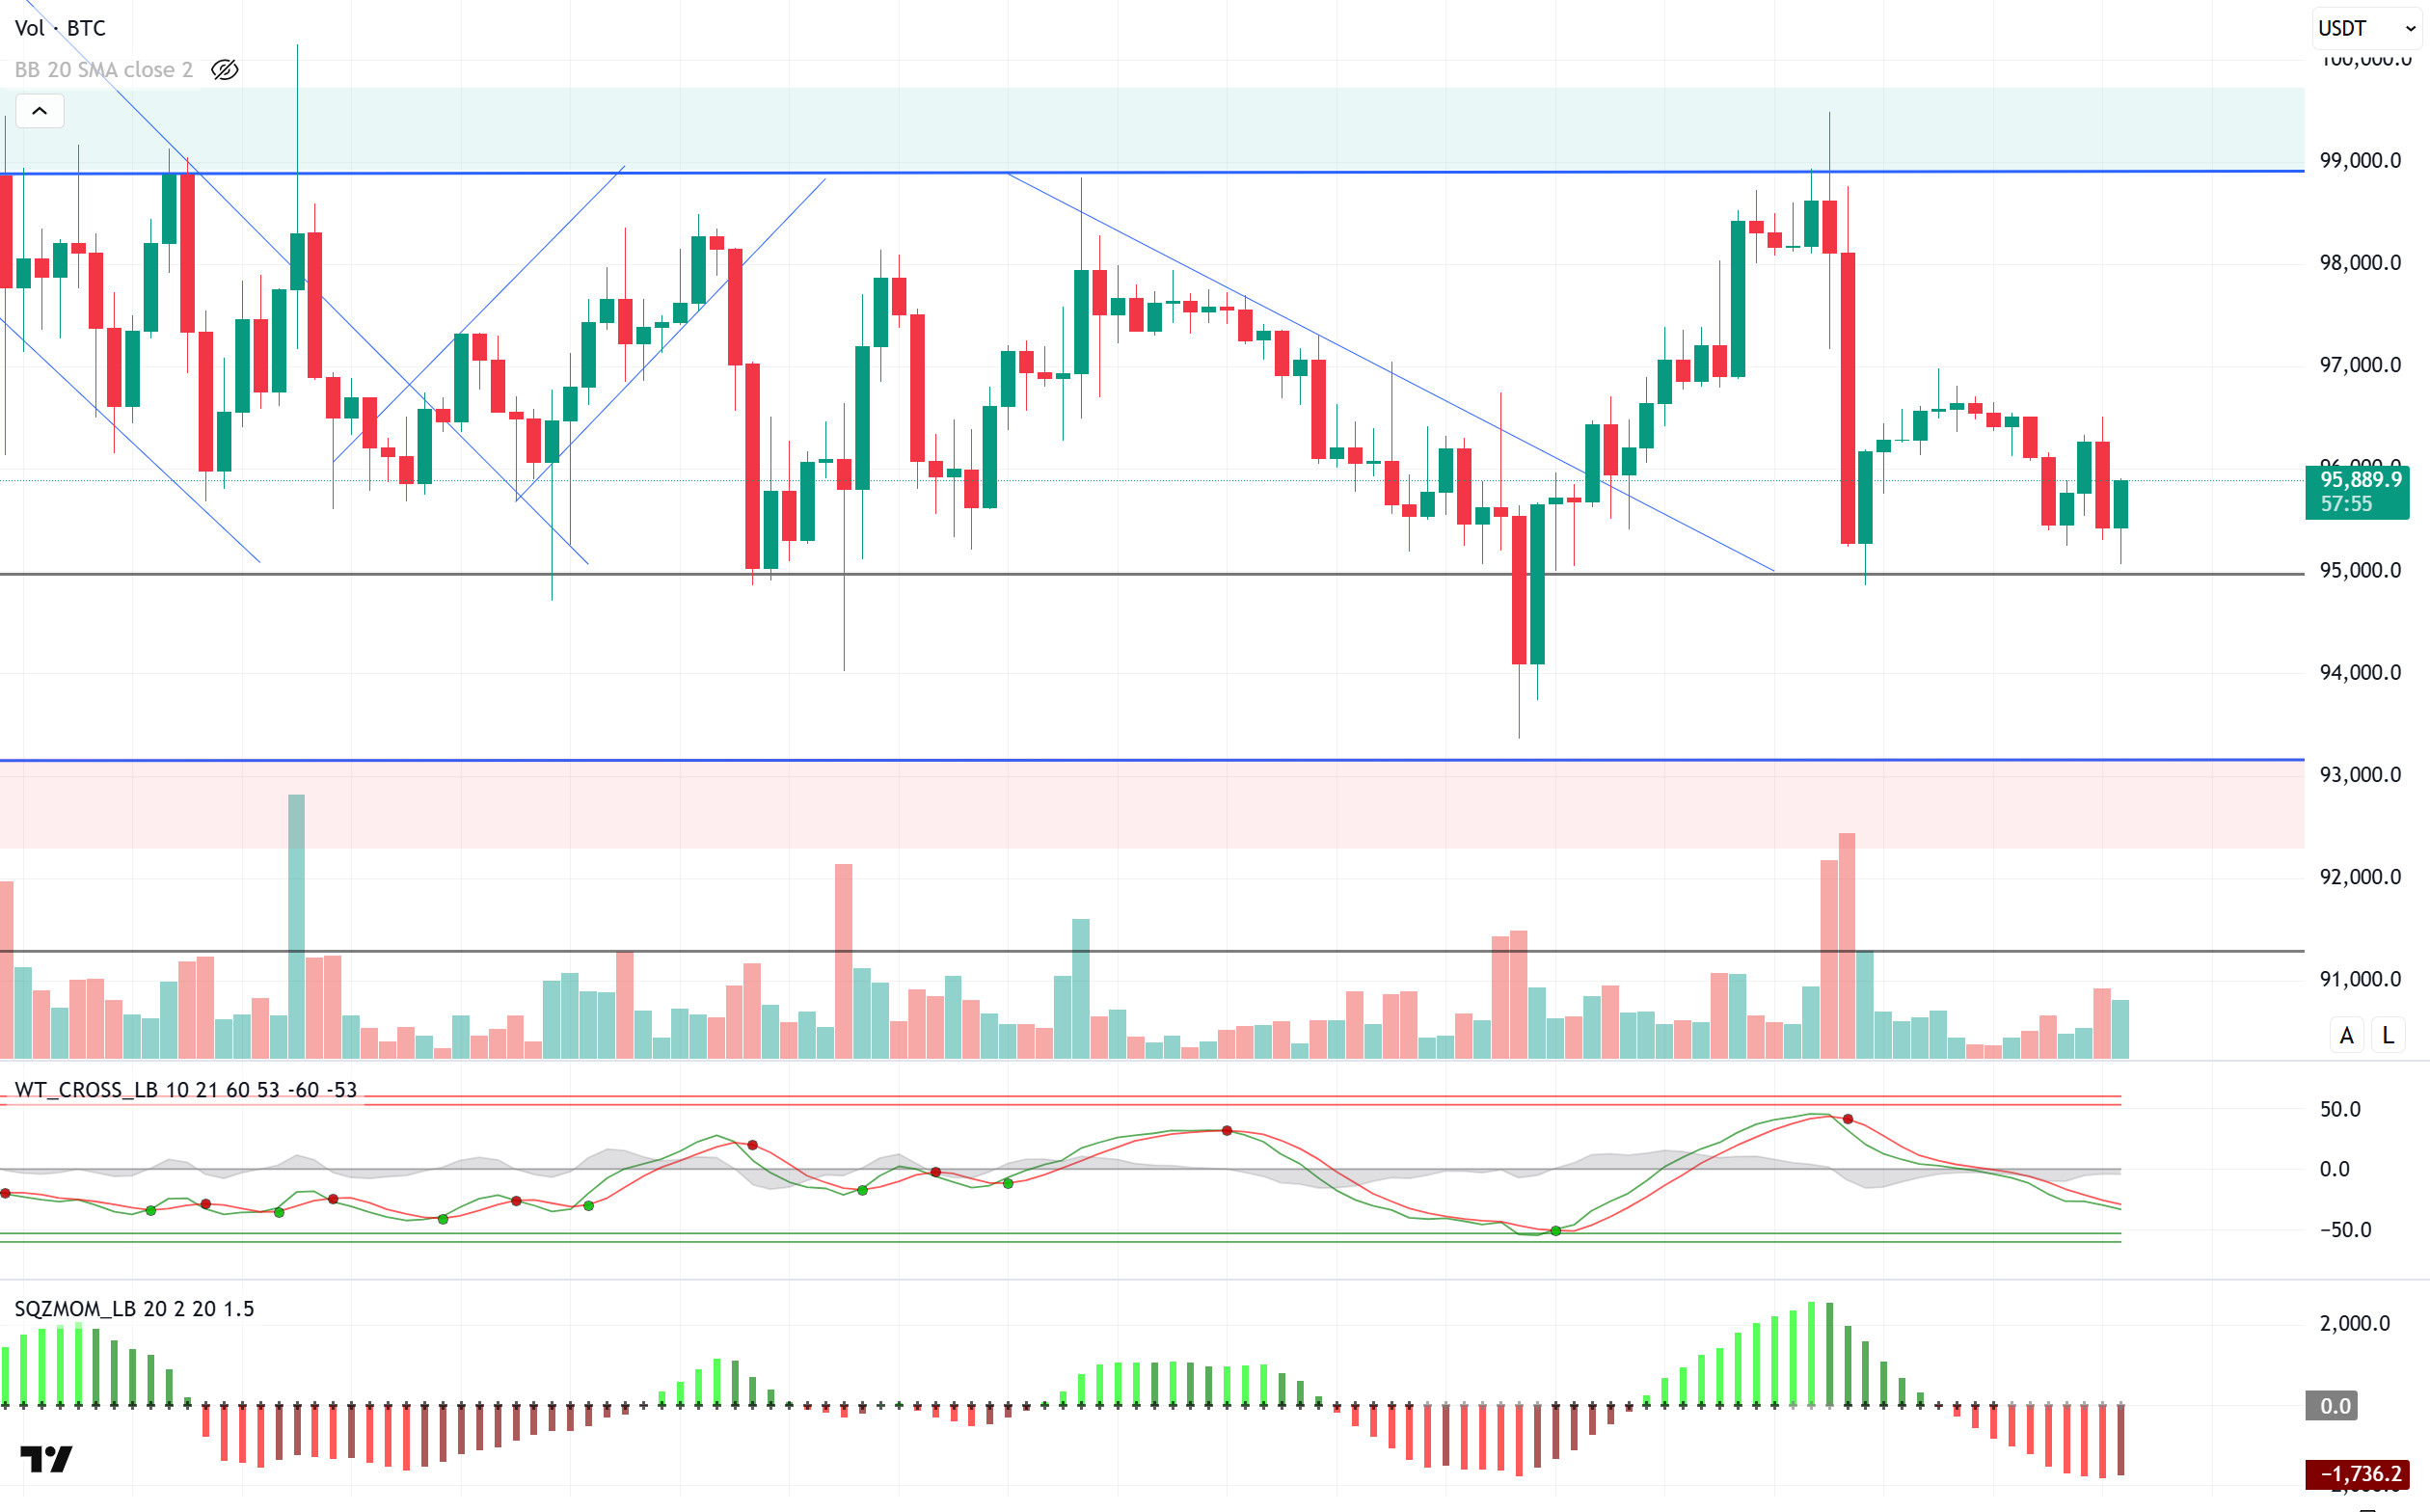
When we look at the technical outlook, it is seen that BTC experienced a sharp retreat after testing the 99,100 resistance level on Friday and the price fell to 94,850. With the purchases coming from this level, BTC entered the recovery process and rose to the 97,000 level, but with the effect of negative news, it could not stay here and tested the 95,000 level again. As of now, BTC is trading at 95,800, just above the major support level. When technical oscillators are analyzed, it is observed that the sell signal continues to be maintained on both the hourly and 4-hour charts. Moreover, momentum indicators continue to weaken, suggesting that the market remains indecisive. Looking at the liquidation heatmap, the long positions at 94,000 level stand out in a possible bearish scenario. This level could be a potential support point. On the other hand, the fact that Strategy BTC purchases will continue today may create a short-term bullish expectation in the market. In this case, short positions concentrated above 97,000 should be carefully monitored. Liquidating these positions during a bullish move could push the BTC price higher.
Supports 95,000 – 92,800 – 90,400
Resistances 97,000 – 99,100 -101,400
ETH/USDT
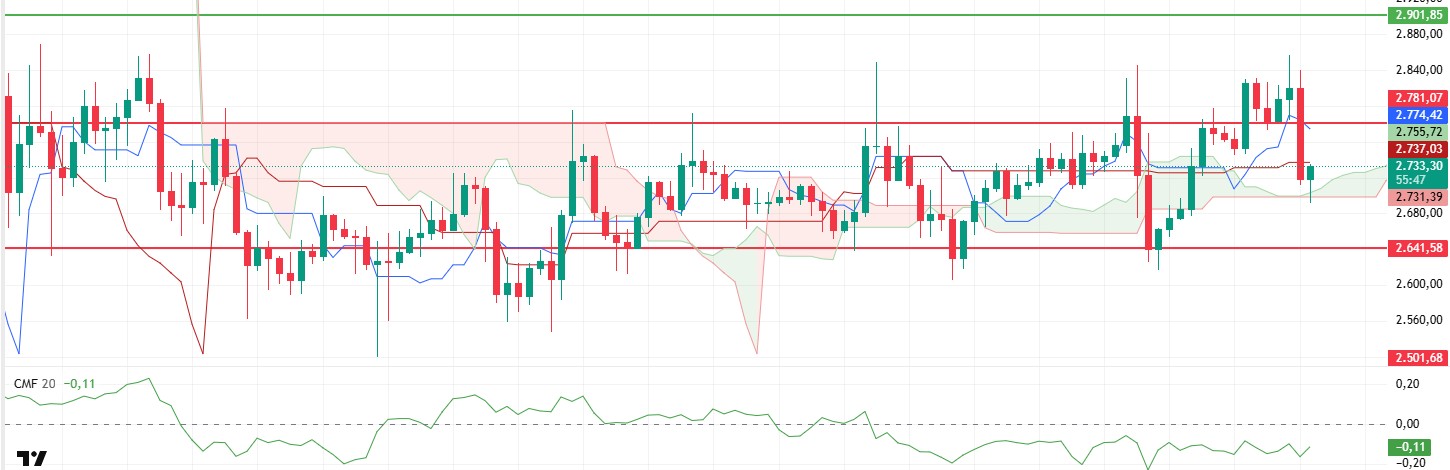
ETH managed to surpass the resistance level of $2,781 last Friday, rising as high as $2,840. However, on the same day, the Bybit exchange was cyberattacked and lost a large amount of funds, causing a sudden wave of sales in the markets. With this development, the ETH price fell as low as $2,641. However, Bybit’s ETH purchases from the market to compensate for the losses contributed to the price recovery. However, with the start of the new week, the $2,781 resistance level was breached again and the price turned down.
An analysis of the Cumulative Volume Delta (CVD) data reveals that the selling pressure was mostly driven by the futures market. The funding rate hovering at low levels indicates that the amount of short positions in the market has increased. If these short positions start to close due to profit-taking or liquidation, there may be upward pressure on the price. According to the Ichimoku indicator, the price is supported by the kumo cloud and has not moved below it. Moreover, the tenkan line remains above the kijun level, indicating that the current trend remains positive. If the price continues to stay above the cloud, bullish movements are likely to continue. When Chaikin Money Flow (CMF) data is analyzed, it is observed that despite the declines, the indicator moves in a narrow range and it can be said that there is no large-scale liquidity outflow from the market and the current demand continues to have an impact on the price.
At current price levels, the increase in spot purchases may cause the price to rise again if short positions are closed and the fears and uncertainties on the market are reduced. The $2,641 level stands out as a strong support zone. If this level is broken downwards, selling pressure may increase and a deeper correction process may begin. In the bullish scenario, if the price exceeds the resistance of $ 2,781 again, the movement towards $ 2,840 and above can be expected to continue.
Supports 2,781 – 2,641 – 2,501
Resistances 2,901 – 2,992 – 3,131
XRP/USDT
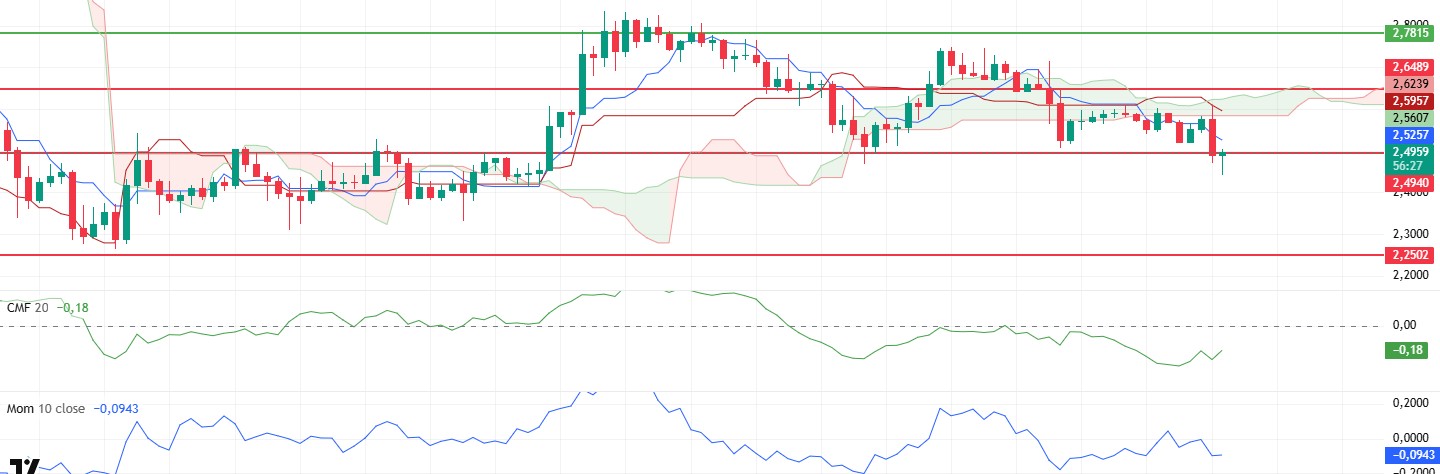
XRP has been declining since Friday as markets reacted to the news flow. After losing the $2.65 level, XRP, which fell to the kumo cloud after losing the $ 2.65 level, lost this region and fell below the main support of $ 2.49 and is trying to hold on to the $ 2.49 level again by getting support from this region.
Chaikin Money Flow (CMF) shows that the liquidity that left with the declines has started to re-enter XRP. However, momentum and volume seem to be weakening. In addition, the loss of the kumo cloud in the ichimoku indicator and the sell signal formed due to the intersection of kijun and tenkan levels can be considered as the most important indicators that ensure the continuation of the negative outlook.
As a result, for XRP, which is holding in a critical zone, closures below the $ 2.49 level may be an important signal that declines may continue. If it manages to hold above this level, rises towards $ 2.65 levels can be seen again.
Supports 2.6489 – 2.4940 – 2.2502
Resistances 2.7815 – 2.9198 – 3.2075
SOL/USDT
Solana’s Pump.fun saw a 70% drop in token launches, revenue declined, and traders accuse the developers of using investors as exit liquidity. On the other hand, Solana is integrating $YLDS, an SEC-approved yielding stablecoin offering 3.85% APR without asset lockups. Franklin Templeton has filed an S-1 with the SEC to launch the spot Solana ETF following growing institutional interest in digital assets.
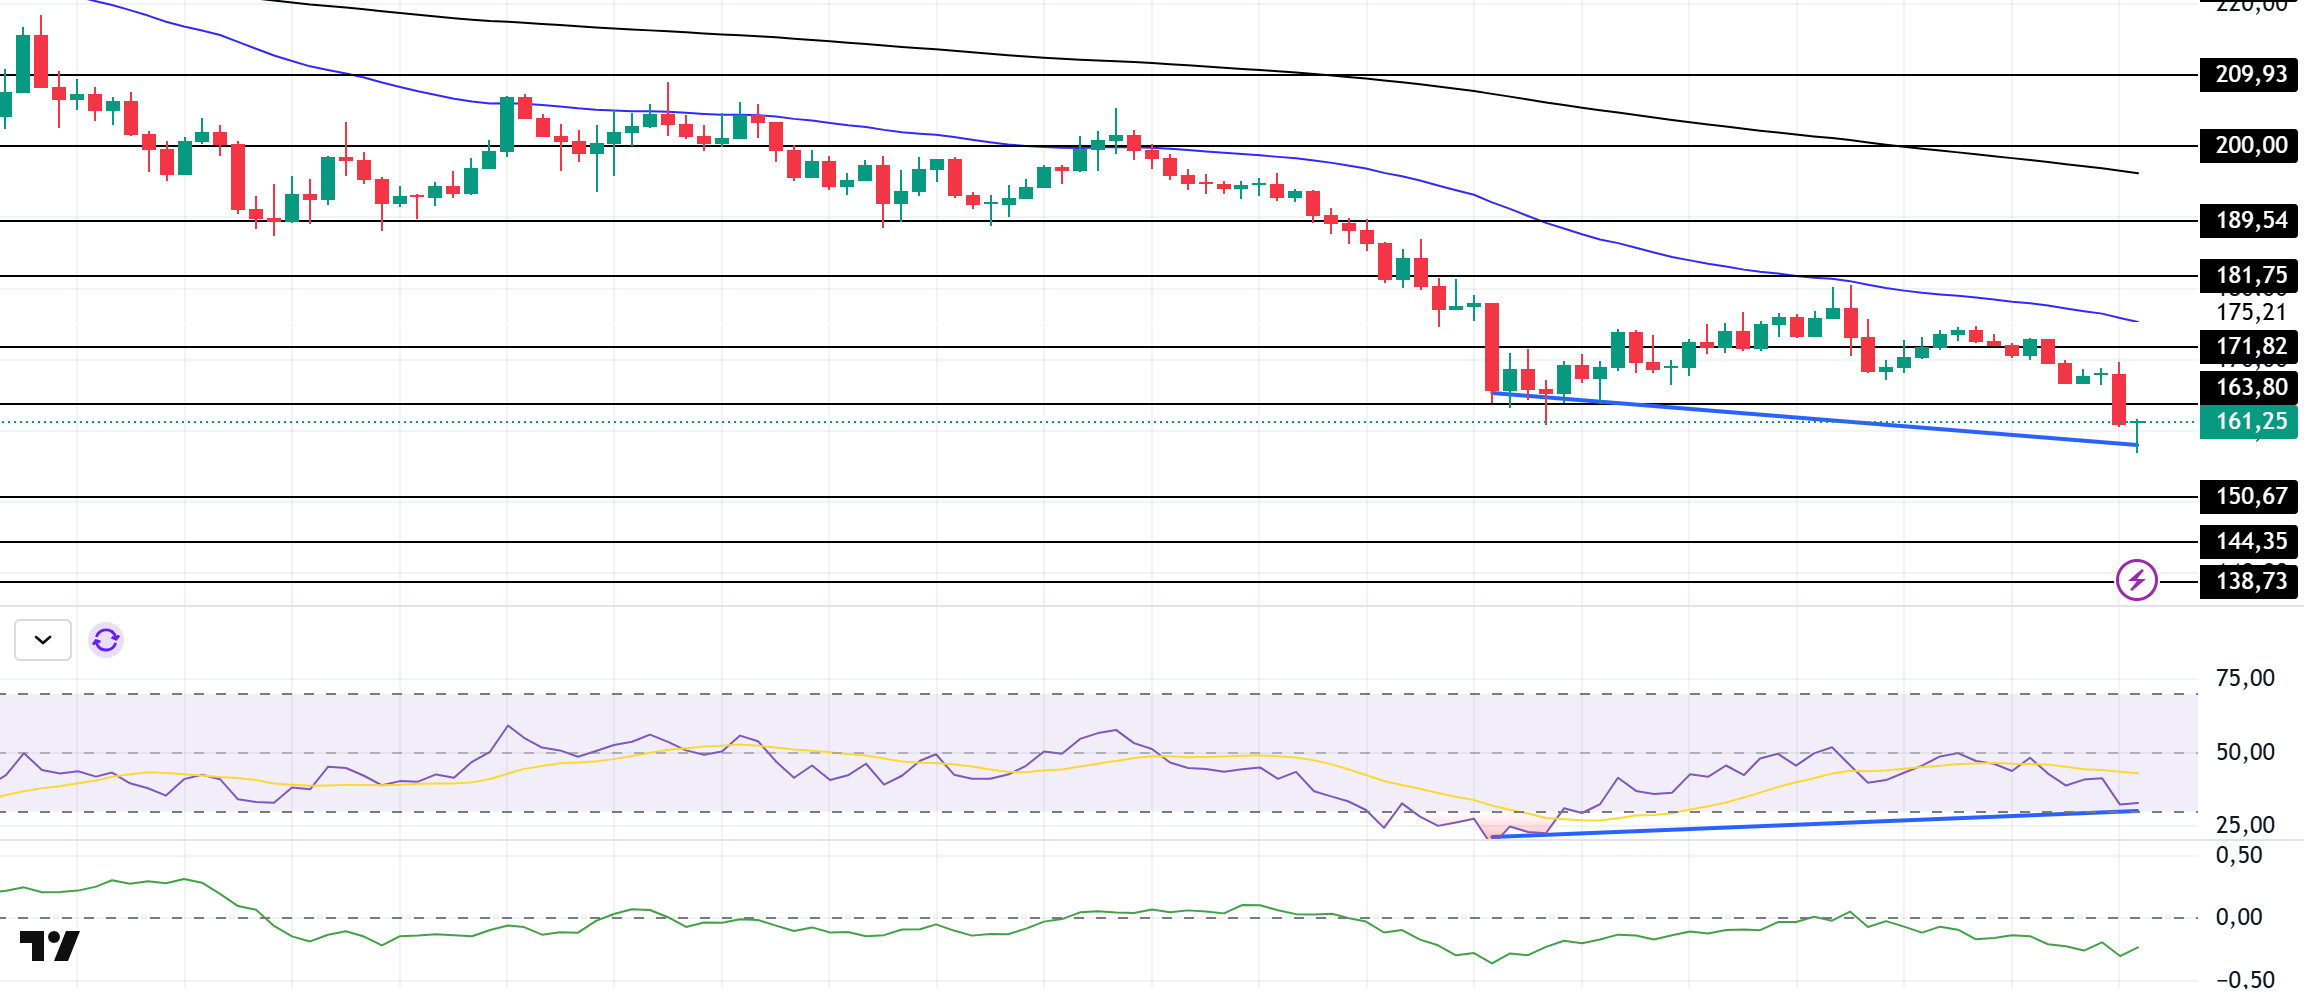
SOL continued its downward movement and broke the strong resistance level of $163.80. On the 4-hour timeframe, the 50 EMA (Blue Line) is below the 200 EMA (Black Line). This may continue to deepen the decline in the medium term. At the same time, the asset remained below both moving averages. However, the higher level between the two moving averages may move the asset up. When we examine the Chaikin Money Flow (CMF)20 indicator, it is in the middle of the negative zone, but the increase in volume may indicate that money outflows may start to decrease here. However, the Relative Strength Index (RSI)14 indicator has fallen into the oversold zone. At the same time, a bullish mismatch between the RSI and the asset should be taken into account. This may have a positive impact on the price. The $200.00 level is a very strong resistance point in the rises driven by both the upcoming macroeconomic data and the news in the Solana ecosystem. If it breaks here, the rise may continue. For the opposite reasons or in case of retracements due to profit sales, the support level of 150.67 dollars can be triggered again. If the price reaches these support levels, a potential bullish opportunity may arise if momentum increases.
Supports 150.67 – 144.35 – 138.73
Resistances 163.80 – 171.82 – 181.75

DOGE/USDT
Since January 20, 160,000 new users have created wallets on the Dogecoin network. At the same time, there was a 34% increase in active addresses. On the other hand, after being given a chainsaw labeled DOGE by Argentine president Javier Millei, Musk posted a very funny photo of himself on the X platform with “The Dogefather” in the background. Also, the official account of the Dogecoin team quoted a tweet from Timothy Stebbing, director of the Dogecoin Foundation, in which he talked about plans to make global adoption of Dogecoin a reality in the future. Stebbing also mentioned that some major partnerships are on the way. The Dogecoin account shared this tweet with a caption: “Adoption is inevitable.” On Onchain, the DOGE Long-Short ratio, which continues to fall according to Coinglass’ data, was valued at 0.87.
DOGE tested the resistance of the downtrend that has been going on since January 21 and failed to break it, continuing its decline. This also activated the falling triangle pattern. At the same time, the asset is below the 50 EMA (Blue Line) 200 EMA (Black Line) on the 4-hour timeframe. This could mean that the decline could deepen further in the medium term. However, the price is below two moving averages. However, the larger gap between the two moving averages could further increase the probability of DOGE moving higher. The Chaikin Money Flow (CMF)20 indicator is in negative territory. This means that money inflows are decreasing, but the increase in volume indicates that money inflows may increase from this level. At the same time, Relative Strength Index (RSI)14 is at the oversold level. The $0.33668 level stands out as a very strong resistance point in the uptrend due to political reasons, macroeconomic data and innovations in the DOGE coin. In case of possible pullbacks due to political, macroeconomic reasons or negativities in the ecosystem, the $0.21154 level, which is the base level of the trend , is an important support. If the price reaches these support levels, a potential bullish opportunity may arise if momentum increases.
Supports 0.22632 – 0.21154 – 0.18954
Resistances 0.25025 – 0.28164 – 0.30545
LEGAL NOTICE
The investment information, comments and recommendations contained herein do not constitute investment advice. Investment advisory services are provided individually by authorized institutions taking into account the risk and return preferences of individuals. The comments and recommendations contained herein are of a general nature. These recommendations may not be suitable for your financial situation and risk and return preferences. Therefore, making an investment decision based solely on the information contained herein may not produce results in line with your expectations.

