
Technical Analysis
BTC/USDT
Last week, capital outflows in the crypto markets attracted attention. According to Coin Shares’ weekly report, there was a total outflow of $508 million from digital asset investment products, while the total outflow in the last two weeks reached $924 million. While the outflow of 560 million dollars, especially from the US, put pressure on the markets, on the European side, Germany and Switzerland showed that demand shifted to the European continent with inflows of 30.5 million dollars and 15.8 million dollars, respectively.
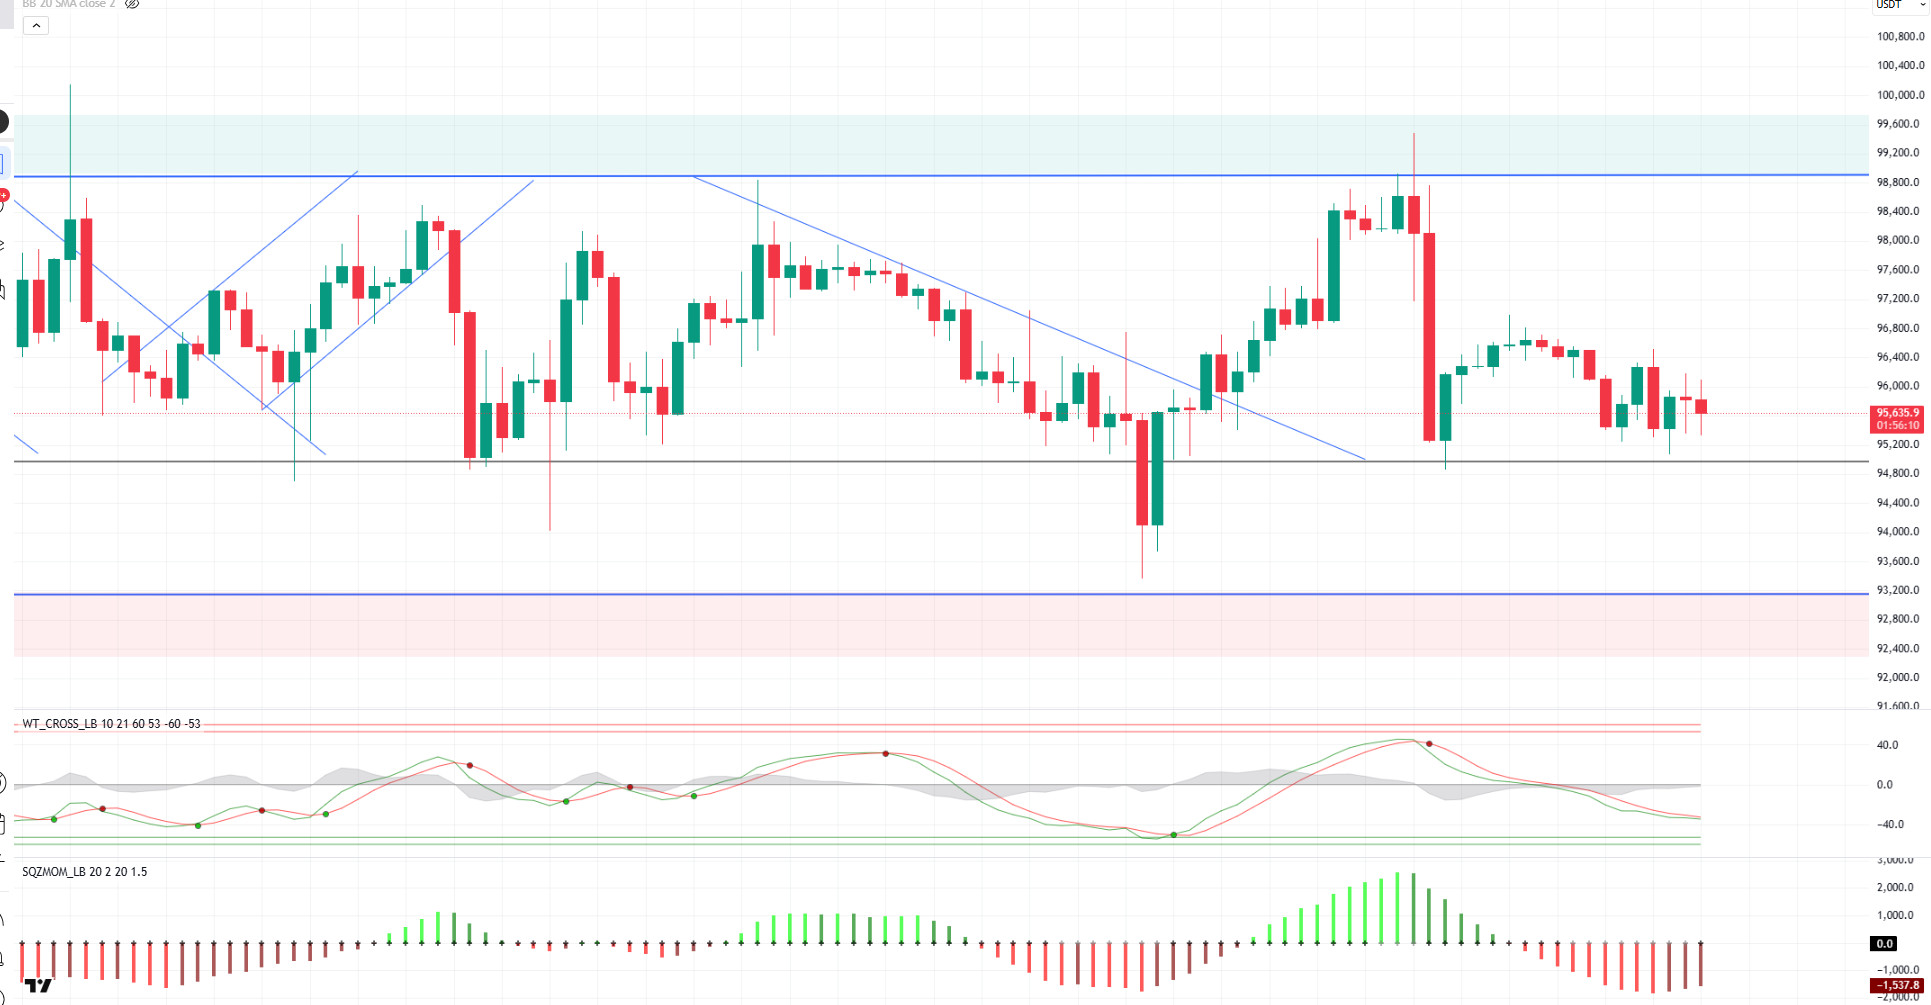
When we look at the technical outlook, BTC is moving in an effort to recover after falling to 95,000 during the day. Currently trading at 95,650, BTC continues to search for direction. On the 4-hour chart, two indecisive candle formations in a row are noteworthy, while technical indicators follow a neutral course in the hourly period. On the 4-hour charts, it is seen that the weakening selling pressure may turn into a buy signal in the coming hours. Momentum indicators confirm that BTC has started to regain momentum, while oscillators are giving recovery signals. Looking at the daily liquidation heatmap, long positions concentrated at 94,000 suppress the rise, while less intense short positions in the 96,000 and 97,000 area may be the first target of the price. Positive inflows on the Spot BTC ETF side again today may provide support for the price to head towards these levels. In the opposite scenario, the possibility of continued selling pressure should not be ignored.
Supports 95,000 – 92,800 – 90,400
Resistances 97,000 – 99,100 -101,400
ETH/USDT
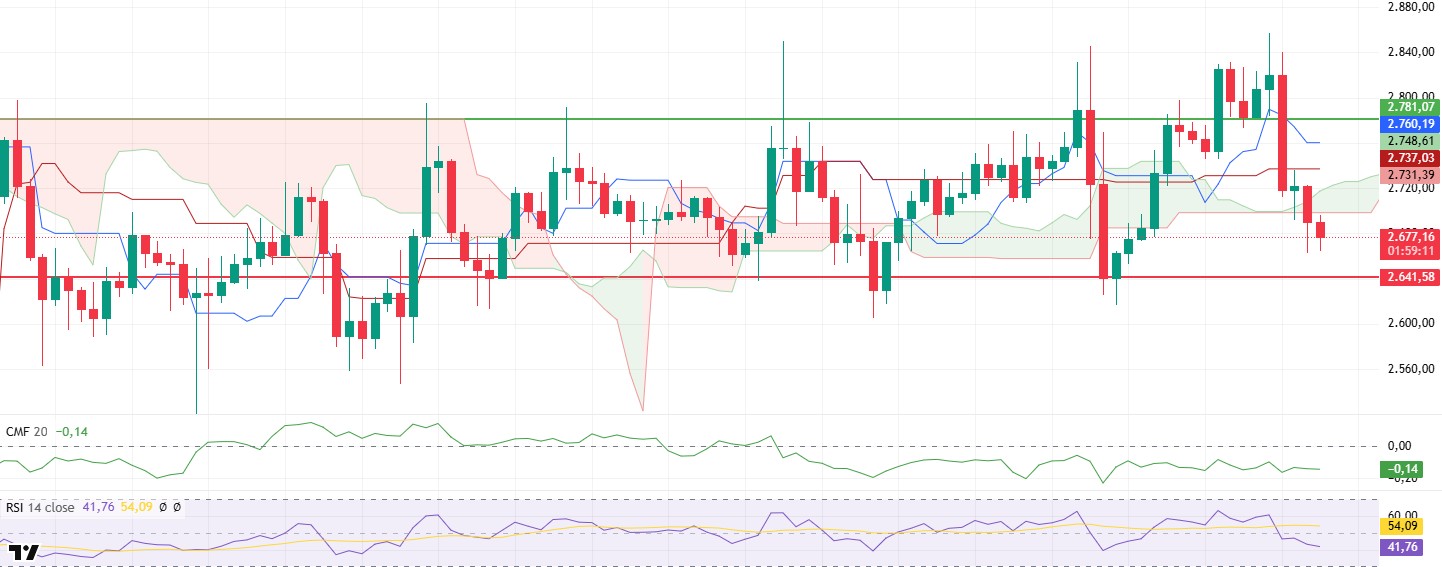
The ETH price rebounded from the $2,660 level twice during the day, showing a slight uptrend. However, this recovery does not seem to be enough to turn the overall market outlook positive. In particular, the fact that the price is still trading below kumo shows that the current risks persist. In addition, the ongoing uncertainty over the fate of ETH stolen from Bybit may continue to undermine investor confidence in the market.
Looking at the technical indicators, ETH dipped below the kumo cloud and closed below this zone, suggesting that bearish pressure remains and the price is trading on a weak footing. The loss of the kumo cloud suggests that buyers don’t have enough strength and sellers are in control. However, an analysis of the Cumulative Volume Delta (CVD) data shows that spot buying has started, albeit to a lesser extent. This is one of the positive signals that the market may face buyer interest at the lows. In addition, the upward movement of the Chaikin Money Flow (CMF) indicator suggests that the capital inflows into the market are increasing and this could support a potential rebound.
Critical levels for ETH price action have started to become evident. In the short term, the price breaking above the $2,698 level, which is the kumo cloud resistance, stands out as an important threshold for the continuation of the rise. If this region is exceeded and sustained above it, a rise up to the level of $ 2,781 can be seen as the next target. However, if the resistance of $ 2,698 cannot be exceeded and the price cannot hold at current levels, the possibility of a retreat towards $ 2,641 levels may come to the agenda.
Supports 2,641 – 2,501 – 2,368
Resistances 2,781 – 2,901 – 2,992
XRP/USDT
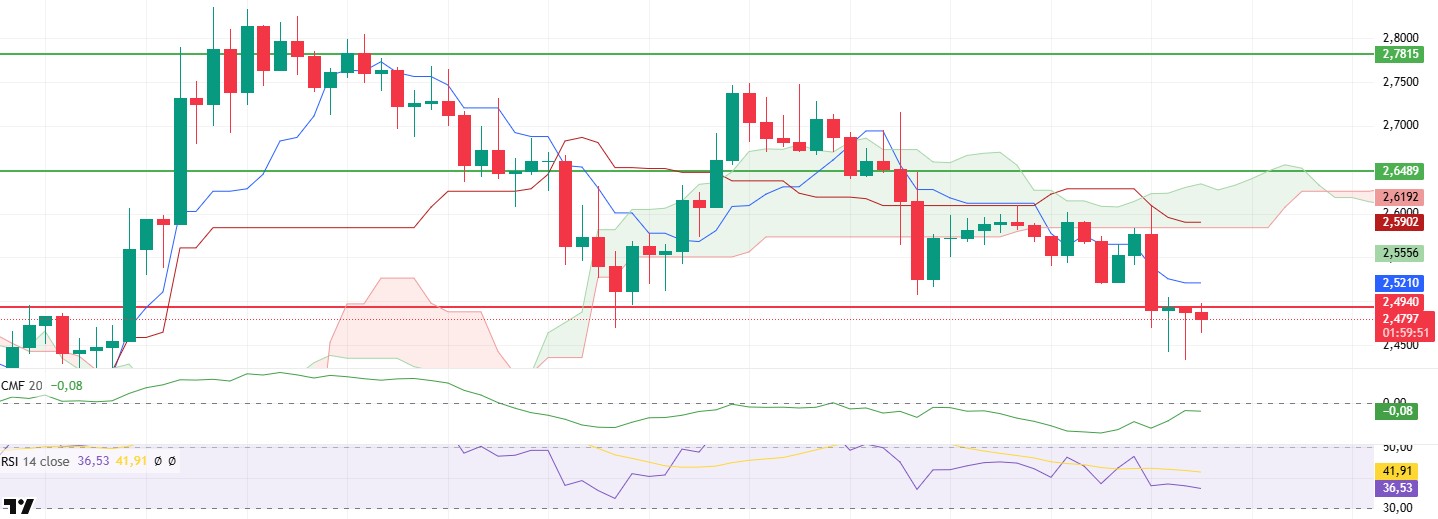
XRP price dipped below the critical $2.49 support, dipping below the kumo cloud after its overnight decline. Although it is currently trying to hold at this level, weakness in price action and market dynamics suggest that uncertainty remains. The loss of momentum and volume decline reveal that buyers are struggling to gain strength in the market.
Analyzing the technical indicators, it is noteworthy that the Chaikin Money Flow (CMF) indicator is trending upwards regardless of the price action. Although this usually indicates an increase in liquidity entering the market, when considered together with the current price pressure, it suggests that heavy selling from the futures market is outweighing spot buying. Open interest and funding rate data also support this view; the increase in short positions in leveraged transactions suggests that selling pressure is dominating the market. In addition, the Relative Strength Index (RSI) continued its downtrend and remained below the 50 level, suggesting that momentum is weak and there is not enough buying power in the market. The RSI hovering at these low levels is an important signal that the current downtrend may continue.
In summary, the $2.49 level stands out as a critical threshold for XRP. Staying below this level indicates that weakness will continue and sales may deepen. Daily closes below the $2.49 level could increase selling pressure and trigger a move towards lower support levels. On the other hand, if the price holds above the $2.49 level and there is a volume recovery, it may be possible to support slight increases in the short term. However, in order for the market to gain strength, an increase in volume and an upward breakout are required.
Supports 2.4940 – 2.2502 – 2.0201
Resistances 2.6486 – 2.7815 – 2.9198
SOL/USDT
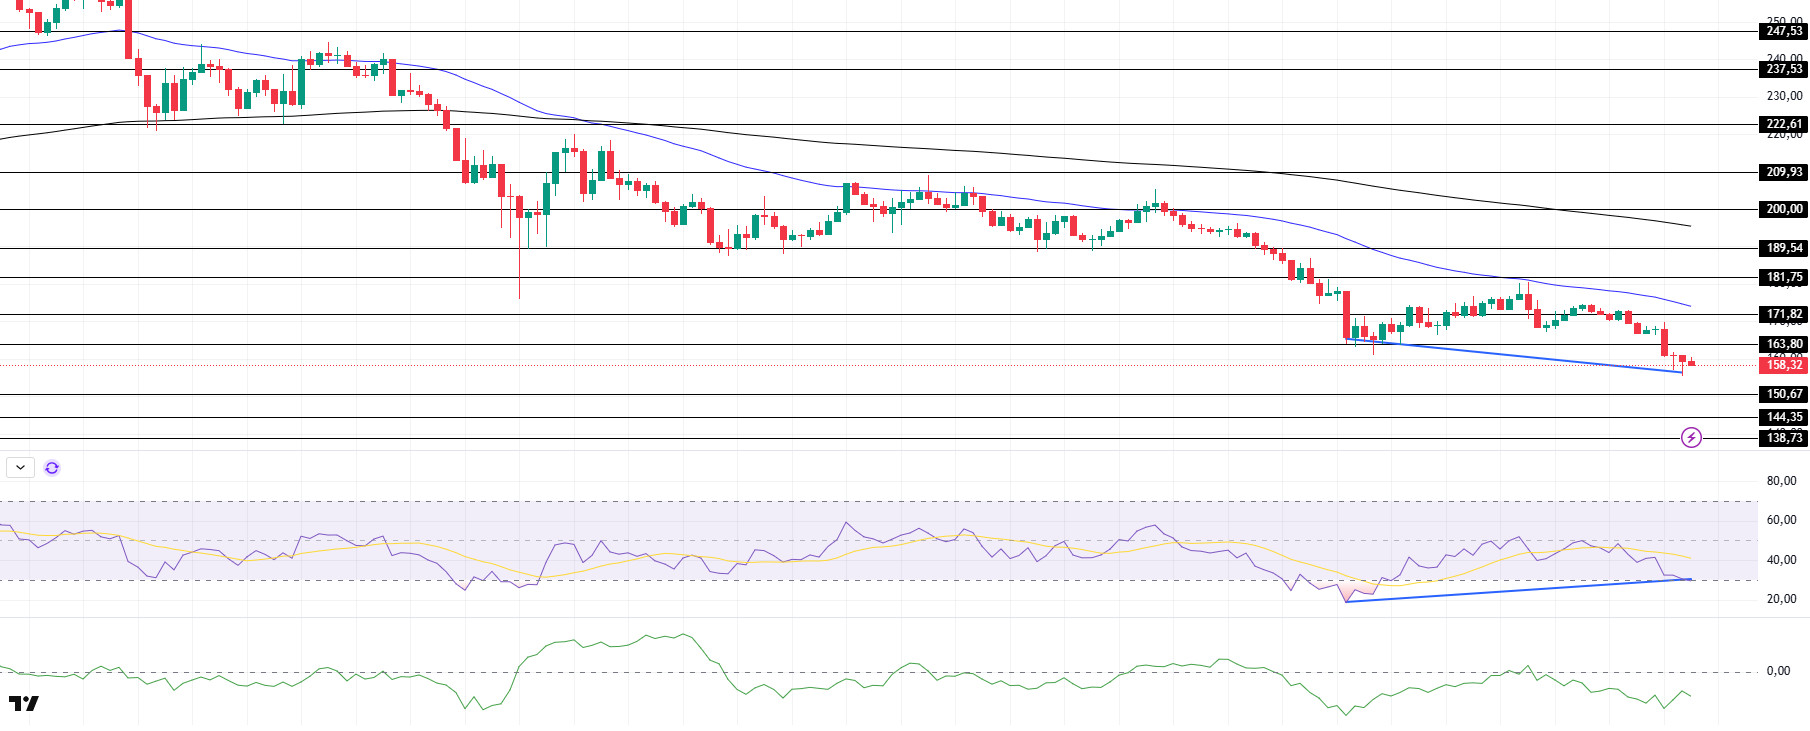
SOL has held its level since our morning analysis. On the 4-hour timeframe, the 50 EMA (Blue Line) is below the 200 EMA (Black Line). This could continue to deepen the decline in the medium term. At the same time, the asset remained below both moving averages. However, the higher level between the two moving averages may move the asset up. When we examine the Chaikin Money Flow (CMF)20 indicator, it is in the middle of the negative zone, but the increase in volume may indicate that money outflows may start to decrease here. However, the Relative Strength Index (RSI)14 indicator has fallen into the oversold zone. At the same time, a bullish mismatch between the RSI and the asset should be taken into account. This may have a positive impact on the price. The $200.00 level is a very strong resistance point in the rises driven by both the upcoming macroeconomic data and the news in the Solana ecosystem. If it breaks here, the rise may continue. In case of retracements for the opposite reasons or due to profit sales, the support level of 150.67 dollars can be triggered again. If the price reaches these support levels, a potential bullish opportunity may arise if momentum increases.
Supports 150.67 – 144.35 – 138.73
Resistances 163.80 – 171.82 – 181.75
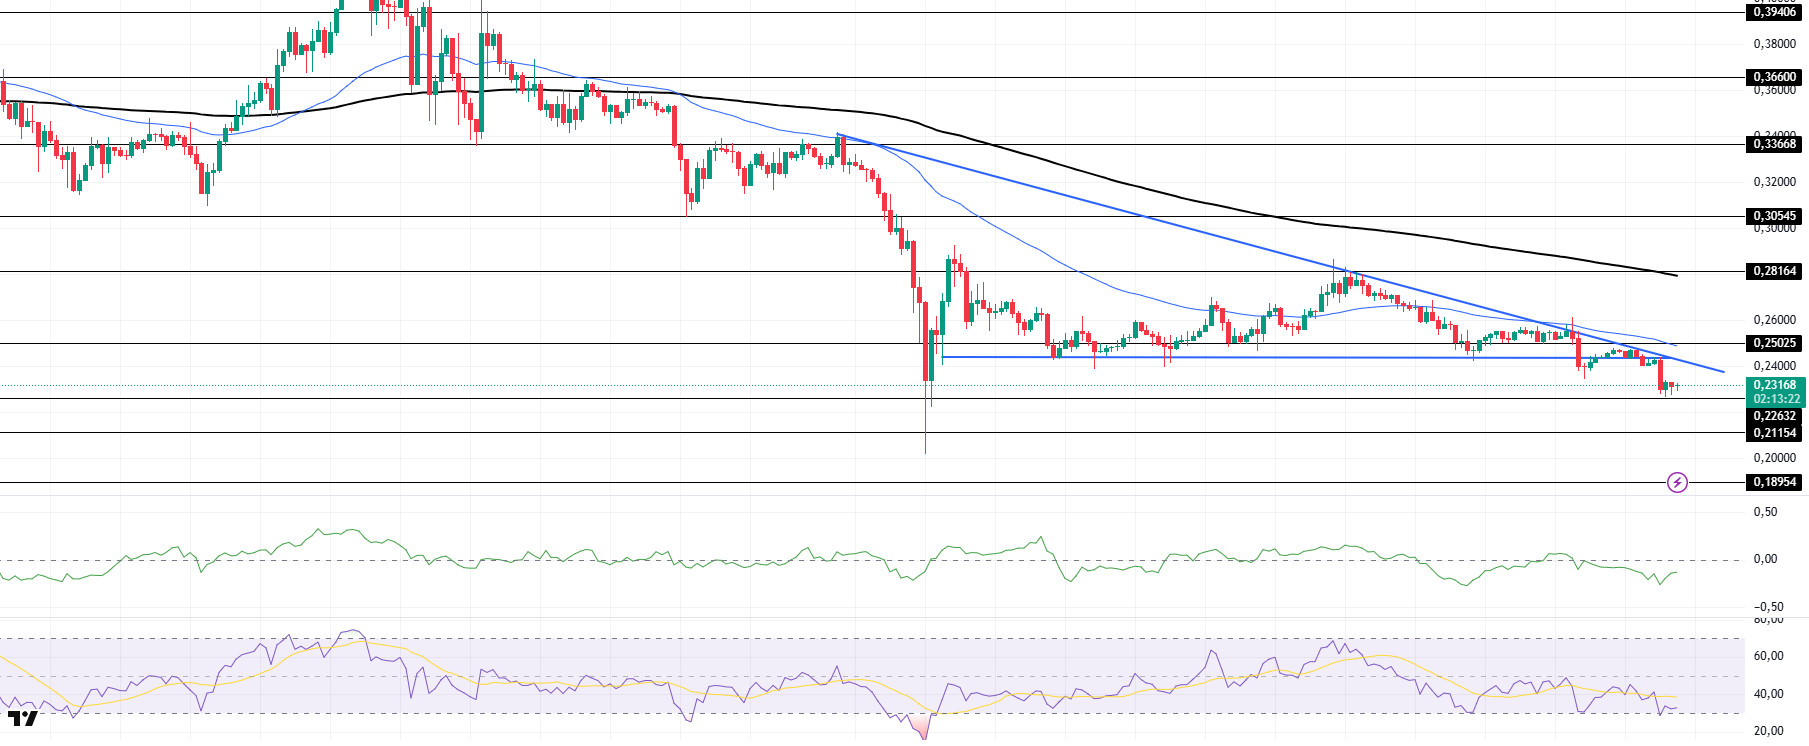
DOGE/USDT
DOGE tested the resistance of the downtrend that has been going on since January 21 and failed to break it, continuing its decline. This also activated the falling triangle pattern. On the 4-hour timeframe, the 50 EMA (Blue Line) is below the 200 EMA (Black Line). This could mean that the decline could deepen further in the medium term. However, the price is below two moving averages. However, the larger gap between the two moving averages could further increase the probability of DOGE moving higher. The Chaikin Money Flow (CMF)20 indicator is in negative territory. This means that money inflows are decreasing, but the increase in volume indicates that money inflows may increase from this level. At the same time, Relative Strength Index (RSI)14 is at the oversold level. The $0.33668 level stands out as a very strong resistance point in the uptrend due to political reasons, macroeconomic data and innovations in the DOGE coin. In case of possible pullbacks due to political, macroeconomic reasons or negativities in the ecosystem, the $0.21154 level, which is the base level of the trend, is an important support. If the price reaches these support levels, a potential bullish opportunity may arise if momentum increases.
Supports 0.22632 – 0.21154 – 0.18954
Resistances 0.25025 – 0.28164 – 0.30545
LEGAL NOTICE
The investment information, comments and recommendations contained herein do not constitute investment advice. Investment advisory services are provided individually by authorized institutions taking into account the risk and return preferences of individuals. The comments and recommendations contained herein are of a general nature. These recommendations may not be suitable for your financial situation and risk and return preferences. Therefore, making an investment decision based solely on the information contained herein may not produce results in line with your expectations.

