
TECHNICAL ANALYSIS
BTC/USDT
Four states in the US have opposed the investment of public funds in Bitcoin and altcoins. Montana joined North Dakota, Wyoming and Pennsylvania in rejecting a bill supporting Bitcoin reserves. On the other hand, US President Donald Trump officially approved his tariff plan against Mexico and Canada, increasing tensions in trade relations. In Asia, South Korea’s Financial Intelligence Unit (FIU) imposed new regulations on Upbit, the country’s largest crypto exchange. In this context, new users were restricted from depositing and withdrawing cryptocurrencies for three months. In addition, with the uncertainty in the markets, the Fear and Greed Index fell to 25, reaching its lowest level since September 2024.
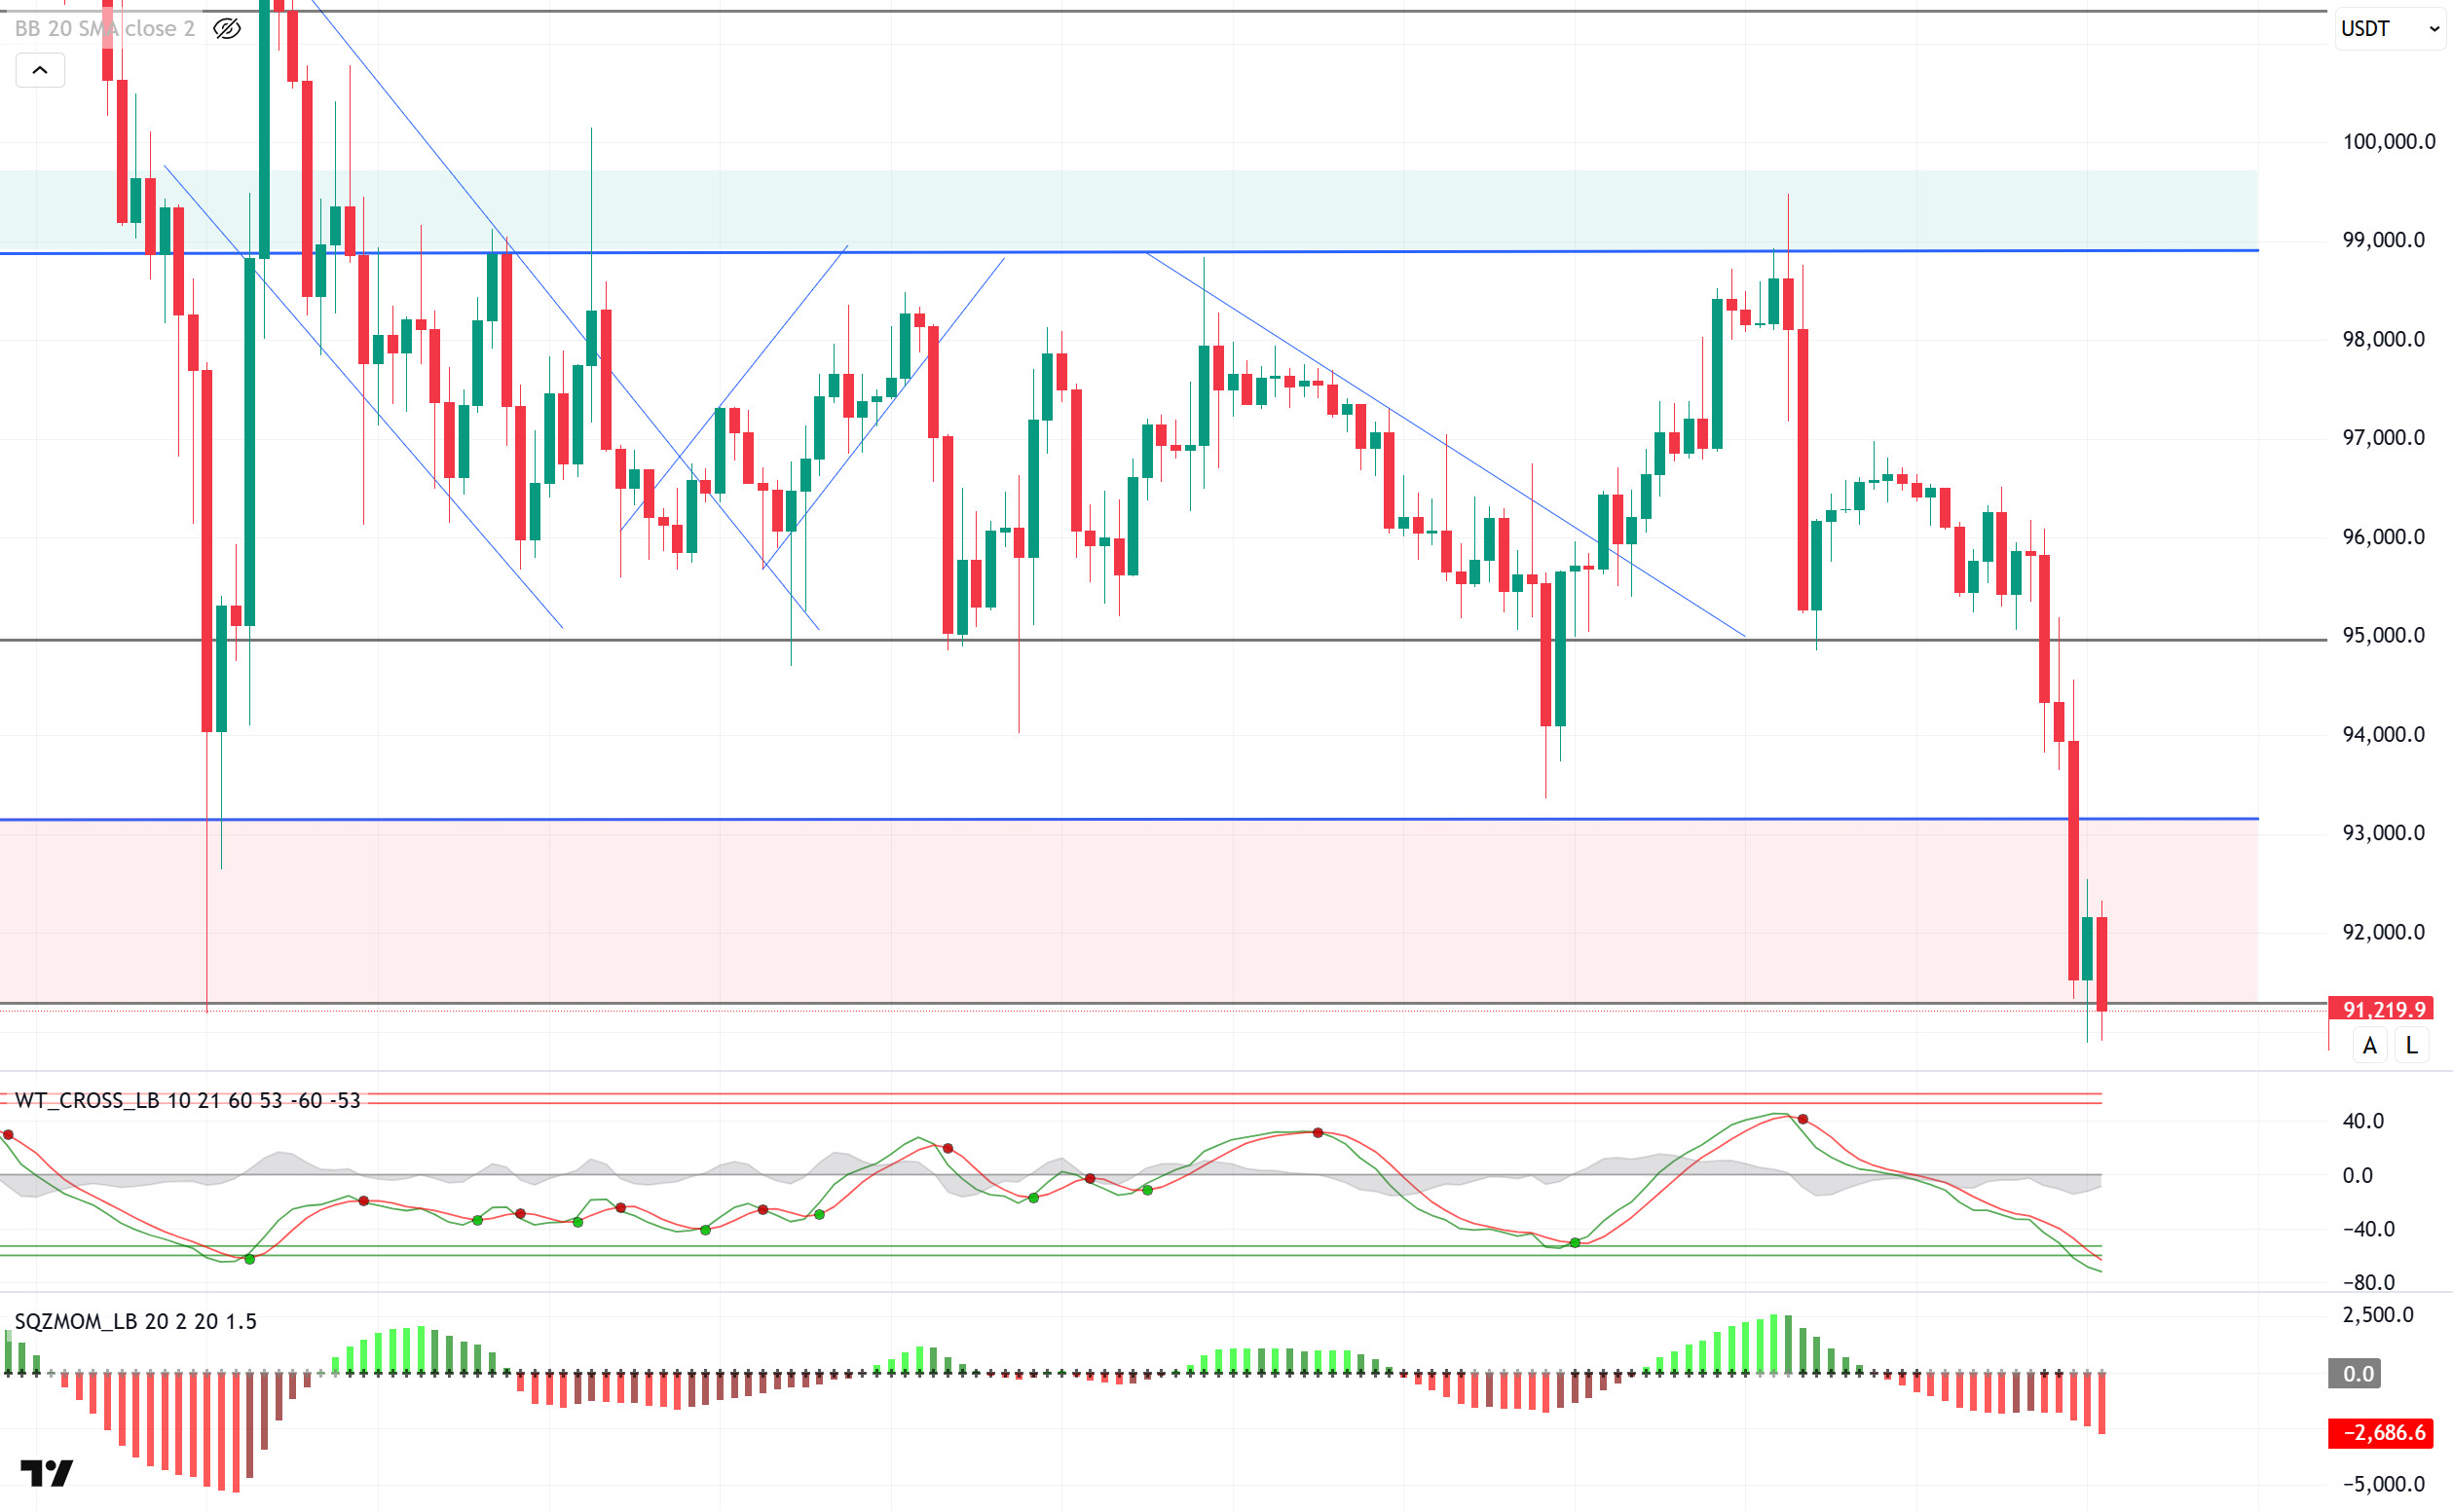
Looking at the technical outlook, BTC’s major support level of 95,000 was broken, deepening the selling pressure and the price fell sharply to test the 90,900 level. This level was previously tested on January 13 and February 3, and at that time, the price experienced a rapid recovery and rose to six-digit levels. This time, however, the price settled around 91,000, reflecting the low-risk appetite, fear and uncertainty in the market. While the rebounds on the second 4-hour candle in previous declines showed that the risk appetite was high, the persistence of the price at these levels in the current situation reveals that the market is acting more cautiously. Currently, BTC is trading at 91,300. Analysing the technical oscillators, indicators remain in the oversold zone and continue to maintain the sell signal. Moreover, momentum indicators are also showing a weakening trend, confirming that the market is still under pressure. In a bearish correction, BTC’s first resistance areas will be 92,800 and 93,000. Breaching these levels will be critical for a short-term recovery. However, if the downtrend deepens, the 89,800 level stands out as an important support point. In case of a decline below this level, selling pressure may increase further. On the other hand, with the loss of the reference level of 95,000, it can be expected that the negative atmosphere will continue in the short term for the market.
Supports 90,400 – 89,800 – 88,300
Resistances 92,800 – 95,000 – 97,000
ETH/USDT
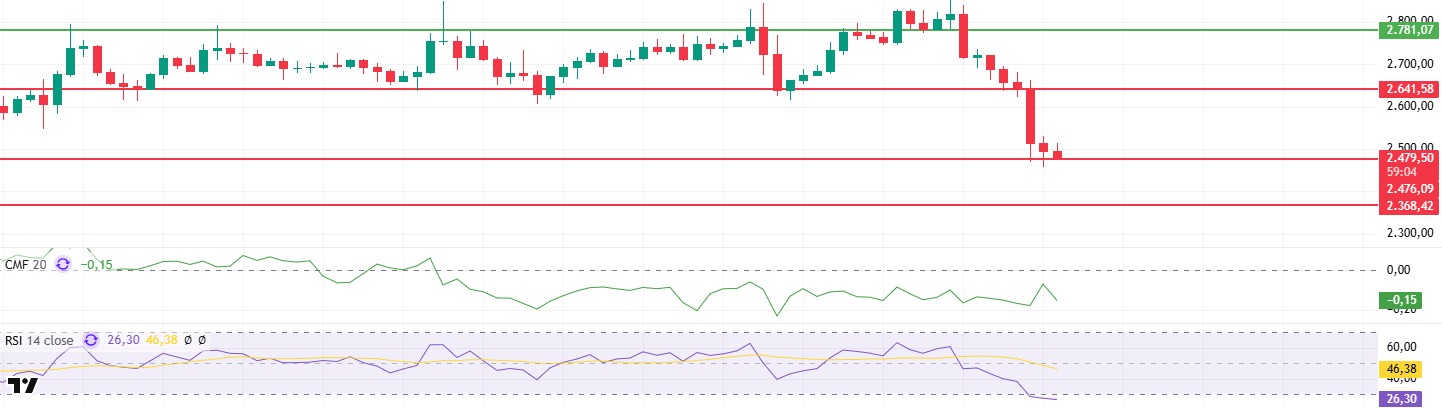
Yesterday evening, there was a sharp retreat in the cryptocurrency market due to the news about OKX. Following this development, ETH lost its support at $ 2,641 and fell to $ 2,476 and is trying to hold at this level. Looking at the market dynamics, various technical indicators stand out that the selling pressure is increasing.
Cumulative Volume Delta (CVD) data showed the start of selling in the spot market, while the Chaikin Money Flow (CMF) indicator moved down in the negative territory, indicating that liquidity outflows from the market accelerated and seller pressure strengthened. In addition, the Relative Strength Index (RSI) entered oversold territory for the first time after the recent drop to $2,157. Since this decline occurred without any positive divergence, it stands out as one of the important factors that strengthen the negative outlook.
In general terms, the negative pressure on ETH continues. If the $2,476 level is lost during the day, the decline is likely to deepen to the $2,368 level. Breaking this support may cause the price to retreat to the $2,128 level. In terms of possible upward movements, exceeding the $ 2,641 level is seen as a critical threshold.
Supports 2,476 – 2,368 – 2,131
Resistances 2,641 – 2,781 – 2,901
XRP/USDT
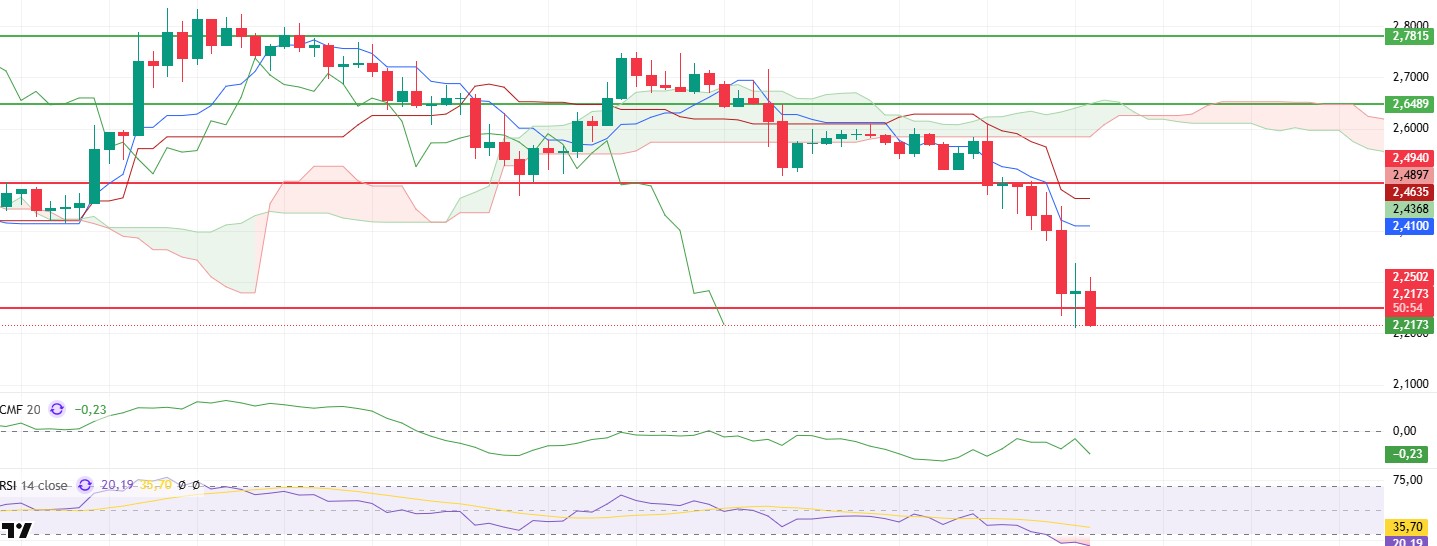
XRP consolidated its negative outlook by retreating to its support at the $2.24 level with the sharp selling wave overnight. While this price action shows that the market-wide selling pressure is also felt intensely on XRP, technical indicators suggest that the downward trend may continue.
The Relative Strength Index (RSI) indicator continues to move bearishly in oversold territory. This suggests that XRP’s price momentum has severely weakened and selling pressure may continue in the short term. On the other hand, the downward movement of the Chaikin Money Flow (CMF) indicator in the negative zone reveals that liquidity outflows from the market have increased and investors remain cautious.
Under current conditions, pressure on XRP can be expected to continue. While the $2.02 level stands out as a strong support point, the loss of this level may bring deeper retracements. Especially if this support is broken, sales will accelerate and the possibility of moving XRP to lower levels will increase. On the other hand, exceeding the $ 2.46 level is seen as a critical threshold for the uptrend to start again. Persistence above this level can support the recovery process by increasing buyer interest.
Supports 2.2402 – 2.0201 – 1.6309
Resistances 2.4940 – 2.6489 – 2.7815
SOL/USDT
With five days to go until the scheduled unlock of 1 million SOLs on Saturday, March 11.2, it has only intensified. On the other hand, according to Arkham Intelligence, Wintermute attracted 24 million SOLs worth over $3 million on a centralized exchange in just 20 hours. On the onchain side, it continues with daily active addresses falling to a three-month low of 3.4 million.
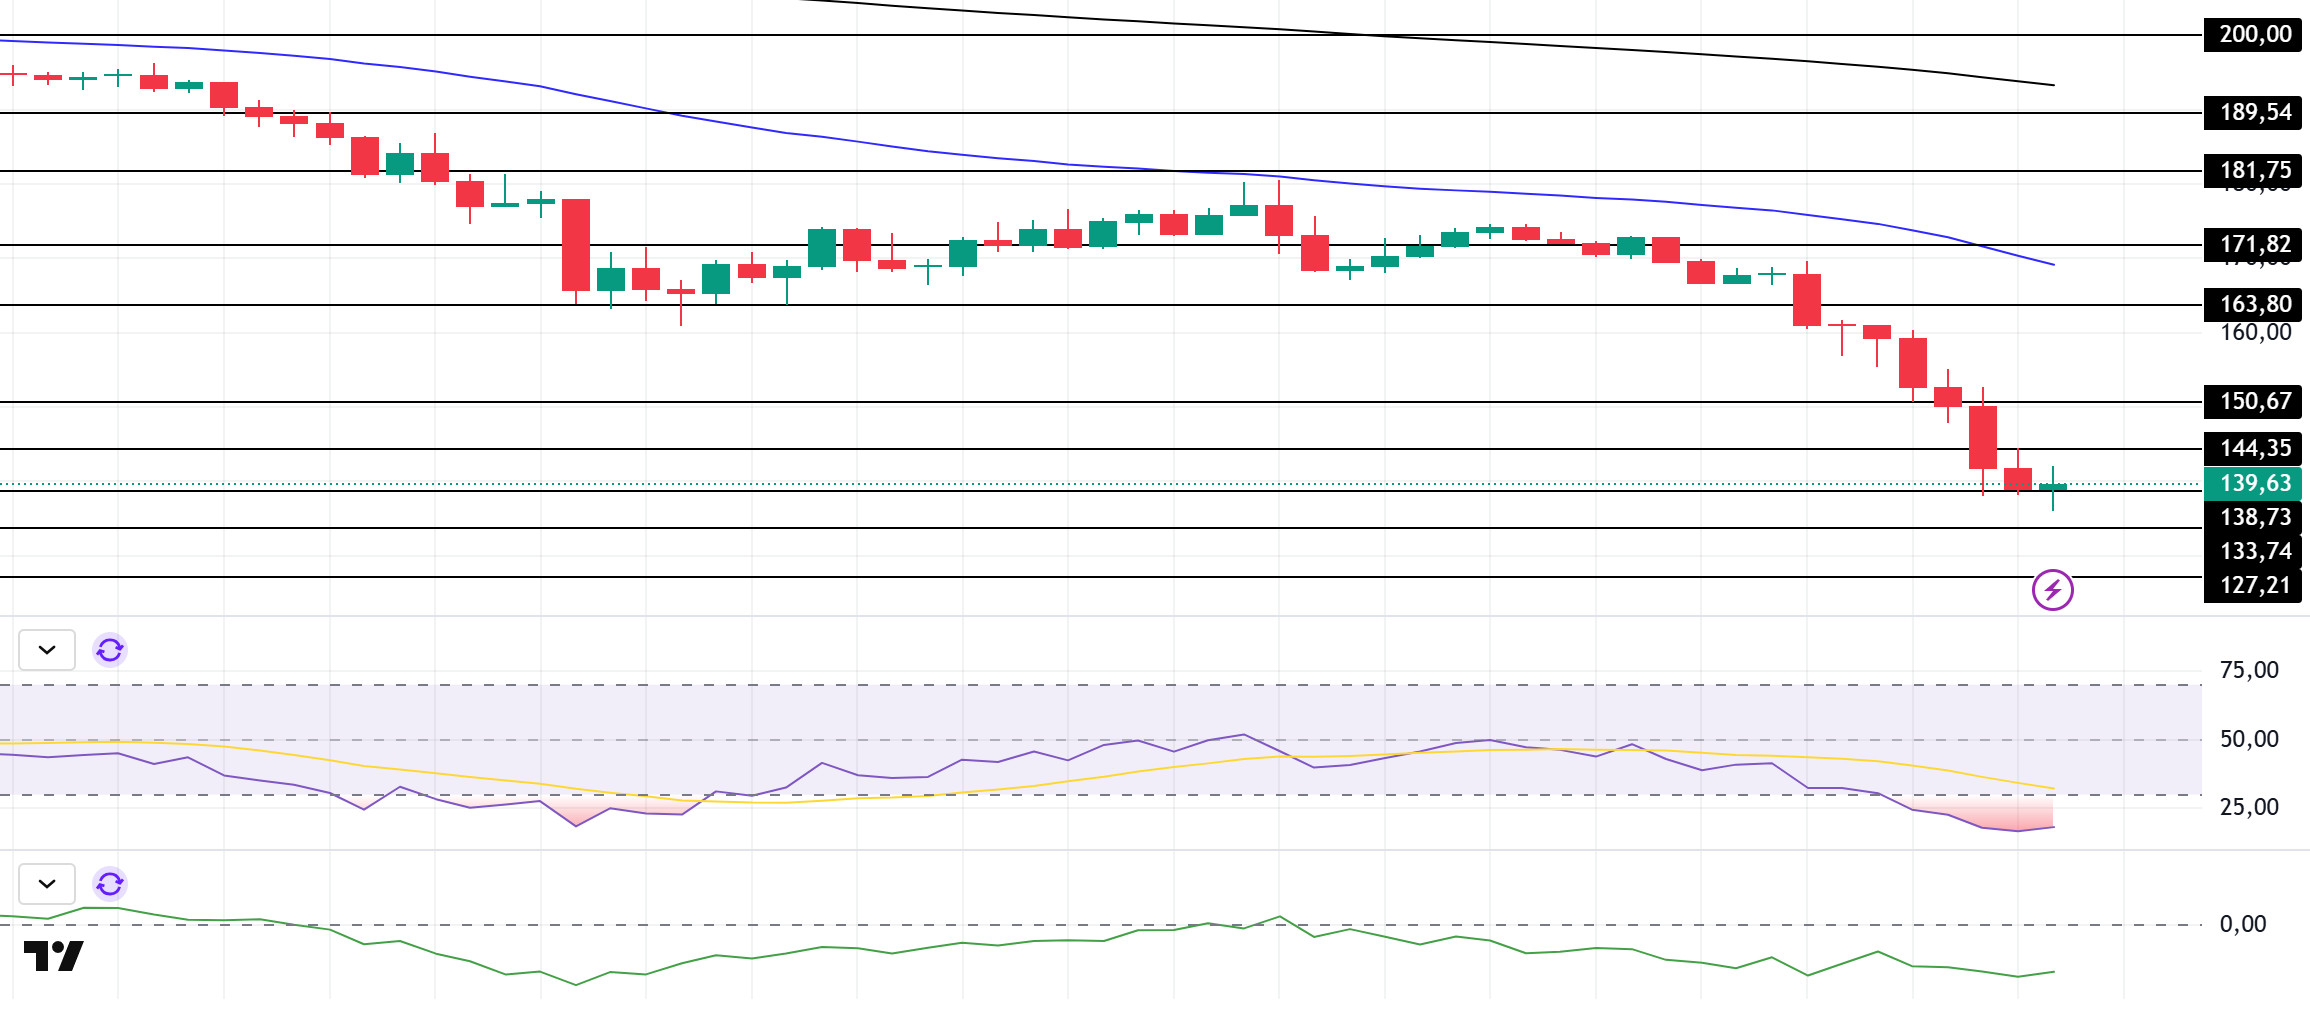
SOL deepened its decline, keeping pace with the overall market. On the 4-hour timeframe, the 50 EMA (Blue Line) is below the 200 EMA (Black Line). This could continue to deepen the decline in the medium term. At the same time, the asset remained below both moving averages. However, the higher level between the two moving averages may move the asset up. When we examine the Chaikin Money Flow (CMF)20 indicator, it is in the negative zone, but the increase in volume may indicate that money outflows may start to decrease here. However, the Relative Strength Index (RSI)14 indicator has fallen into the oversold zone. The $ 181.75 level stands out as a very strong resistance place in the rises driven by both the upcoming macroeconomic data and the news in the Solana ecosystem. If it breaks here, the rise may continue. In case of retracements for the opposite reasons or due to profit sales, the support level of 121.07 dollars can be triggered again. If the price comes to these support levels, a potential bullish opportunity may arise if momentum increases.
Supports 138.73 – 133.74 – 127.21
Resistances 144.35 – 150.67 – 163.80
DOGE/USDT
DOGE’s trading was down 88% due to whale inactivity. On Onchain, options volume fell by just over 58% in the last 24 hours while open interest increased by 15.12% in the same period. However, spot outflows in the last 24 hours amounted to $5.05 million. In 2025, the highest single-day spot outflows observed by Coinglass was $166.99 million on January 19.
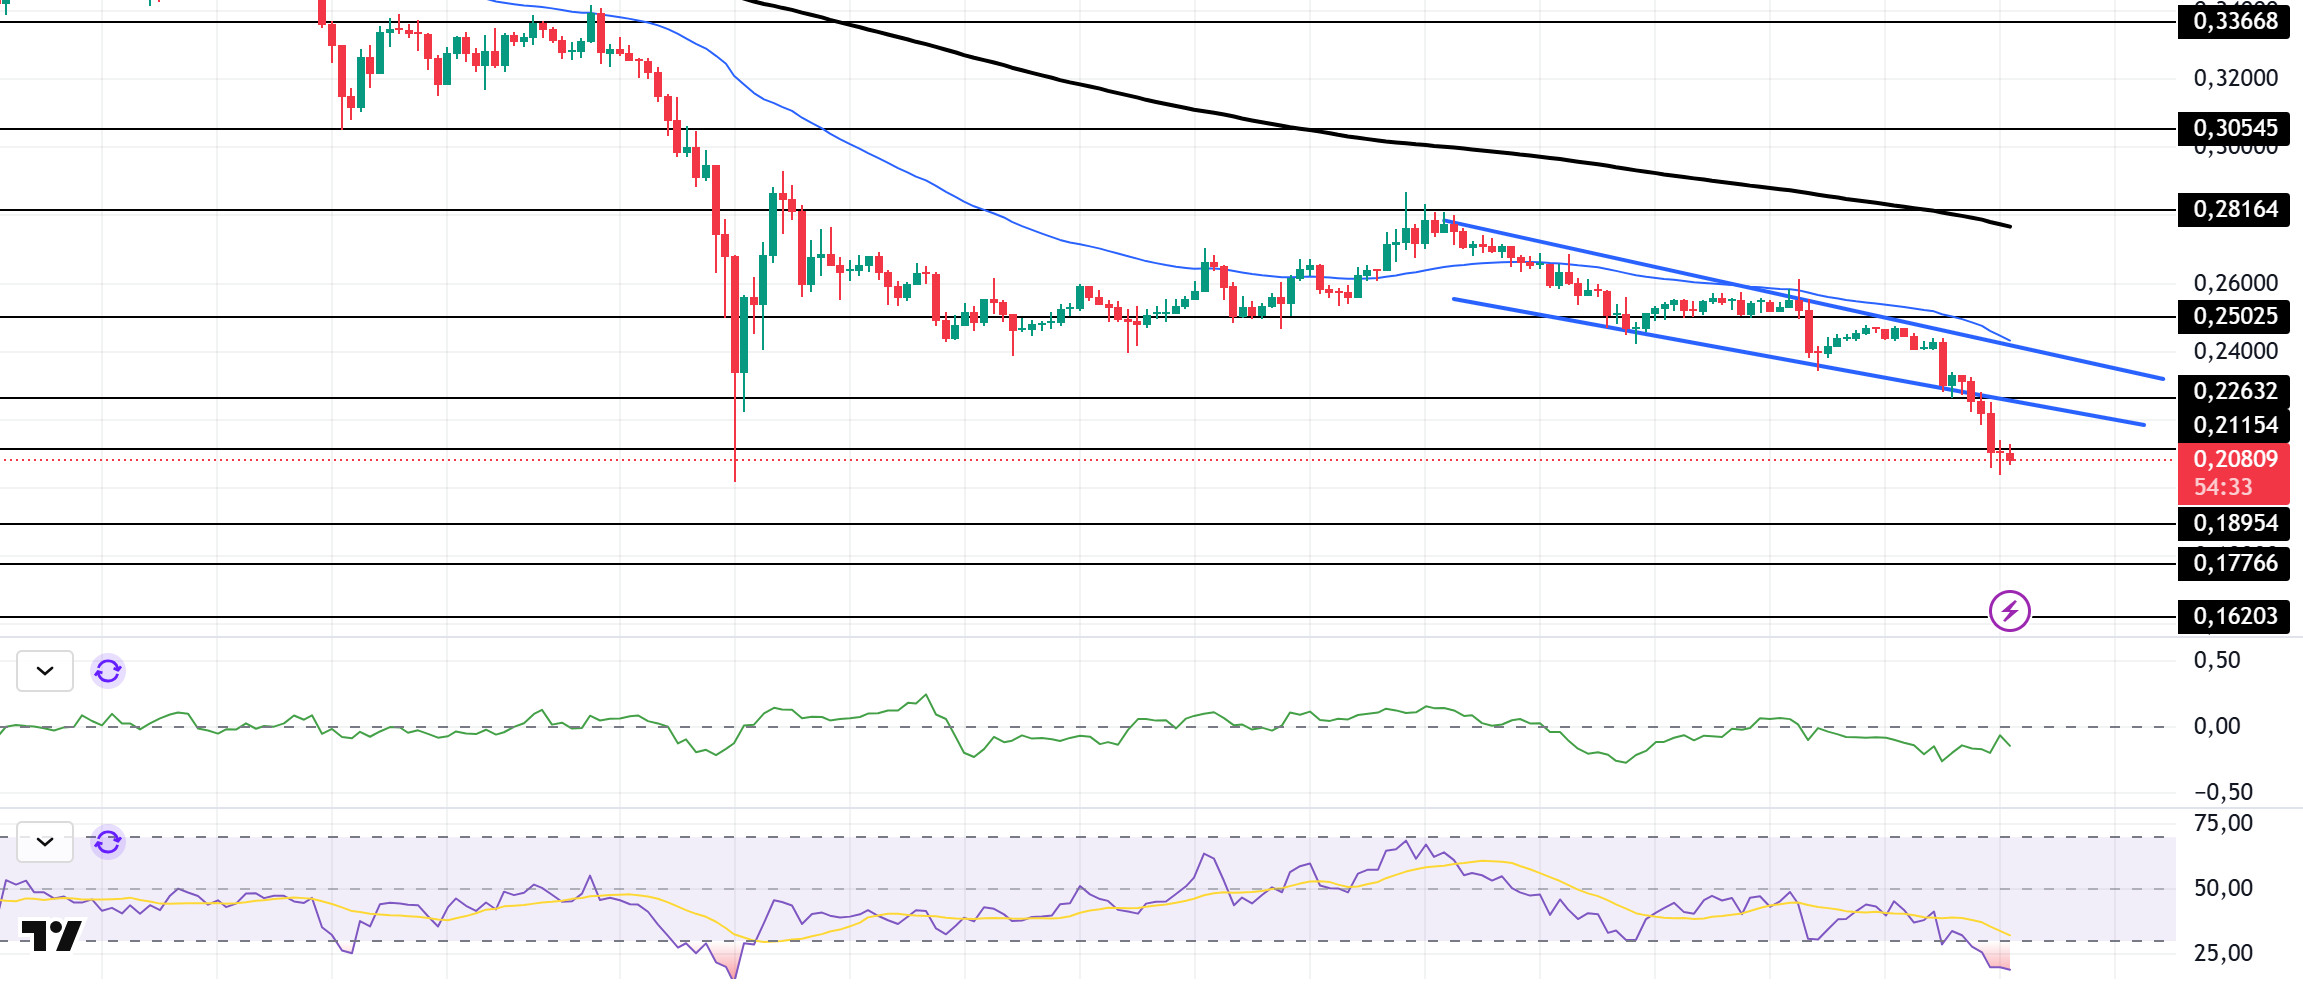
DOGE continued to depreciate, deepening the downtrend that has been in place since January 21. On the 4-hour timeframe, the 50 EMA (Blue Line) is below the 200 EMA (Black Line). This could mean that the decline could deepen further in the medium term. However, the price is hovering below two moving averages. However, the larger gap between the two moving averages could further increase the probability of DOGE moving higher. This could cause the downtrend, which started on February 15, to test the base level as a place of resistance. The Chaikin Money Flow (CMF)20 indicator is in negative territory. This means that money inflows are decreasing, but the increase in volume indicates that money inflows may increase from this level. At the same time, Relative Strength Index (RSI)14 is at the oversold level. The $0.33668 level stands out as a very strong resistance point in the uptrend due to political reasons, macroeconomic data and innovations in the DOGE coin. In case of possible pullbacks due to political, macroeconomic reasons or negativities in the ecosystem, the $0.18954 level, which is the base level of the trend, is an important support. If the price reaches these support levels, a potential bullish opportunity may arise if momentum increases.
Supports 0.18954 – 0.17766 – 0.16203
Resistances 0.21154 – 0.22632 – 0.25025
LEGAL NOTICE
The investment information, comments and recommendations contained herein do not constitute investment advice. Investment advisory services are provided individually by authorized institutions taking into account the risk and return preferences of individuals. The comments and recommendations contained herein are of a general nature. These recommendations may not be suitable for your financial situation and risk and return preferences. Therefore, making an investment decision based solely on the information contained herein may not produce results in line with your expectations.

