
TECHNICAL ANALYSIS
BTC/USDT
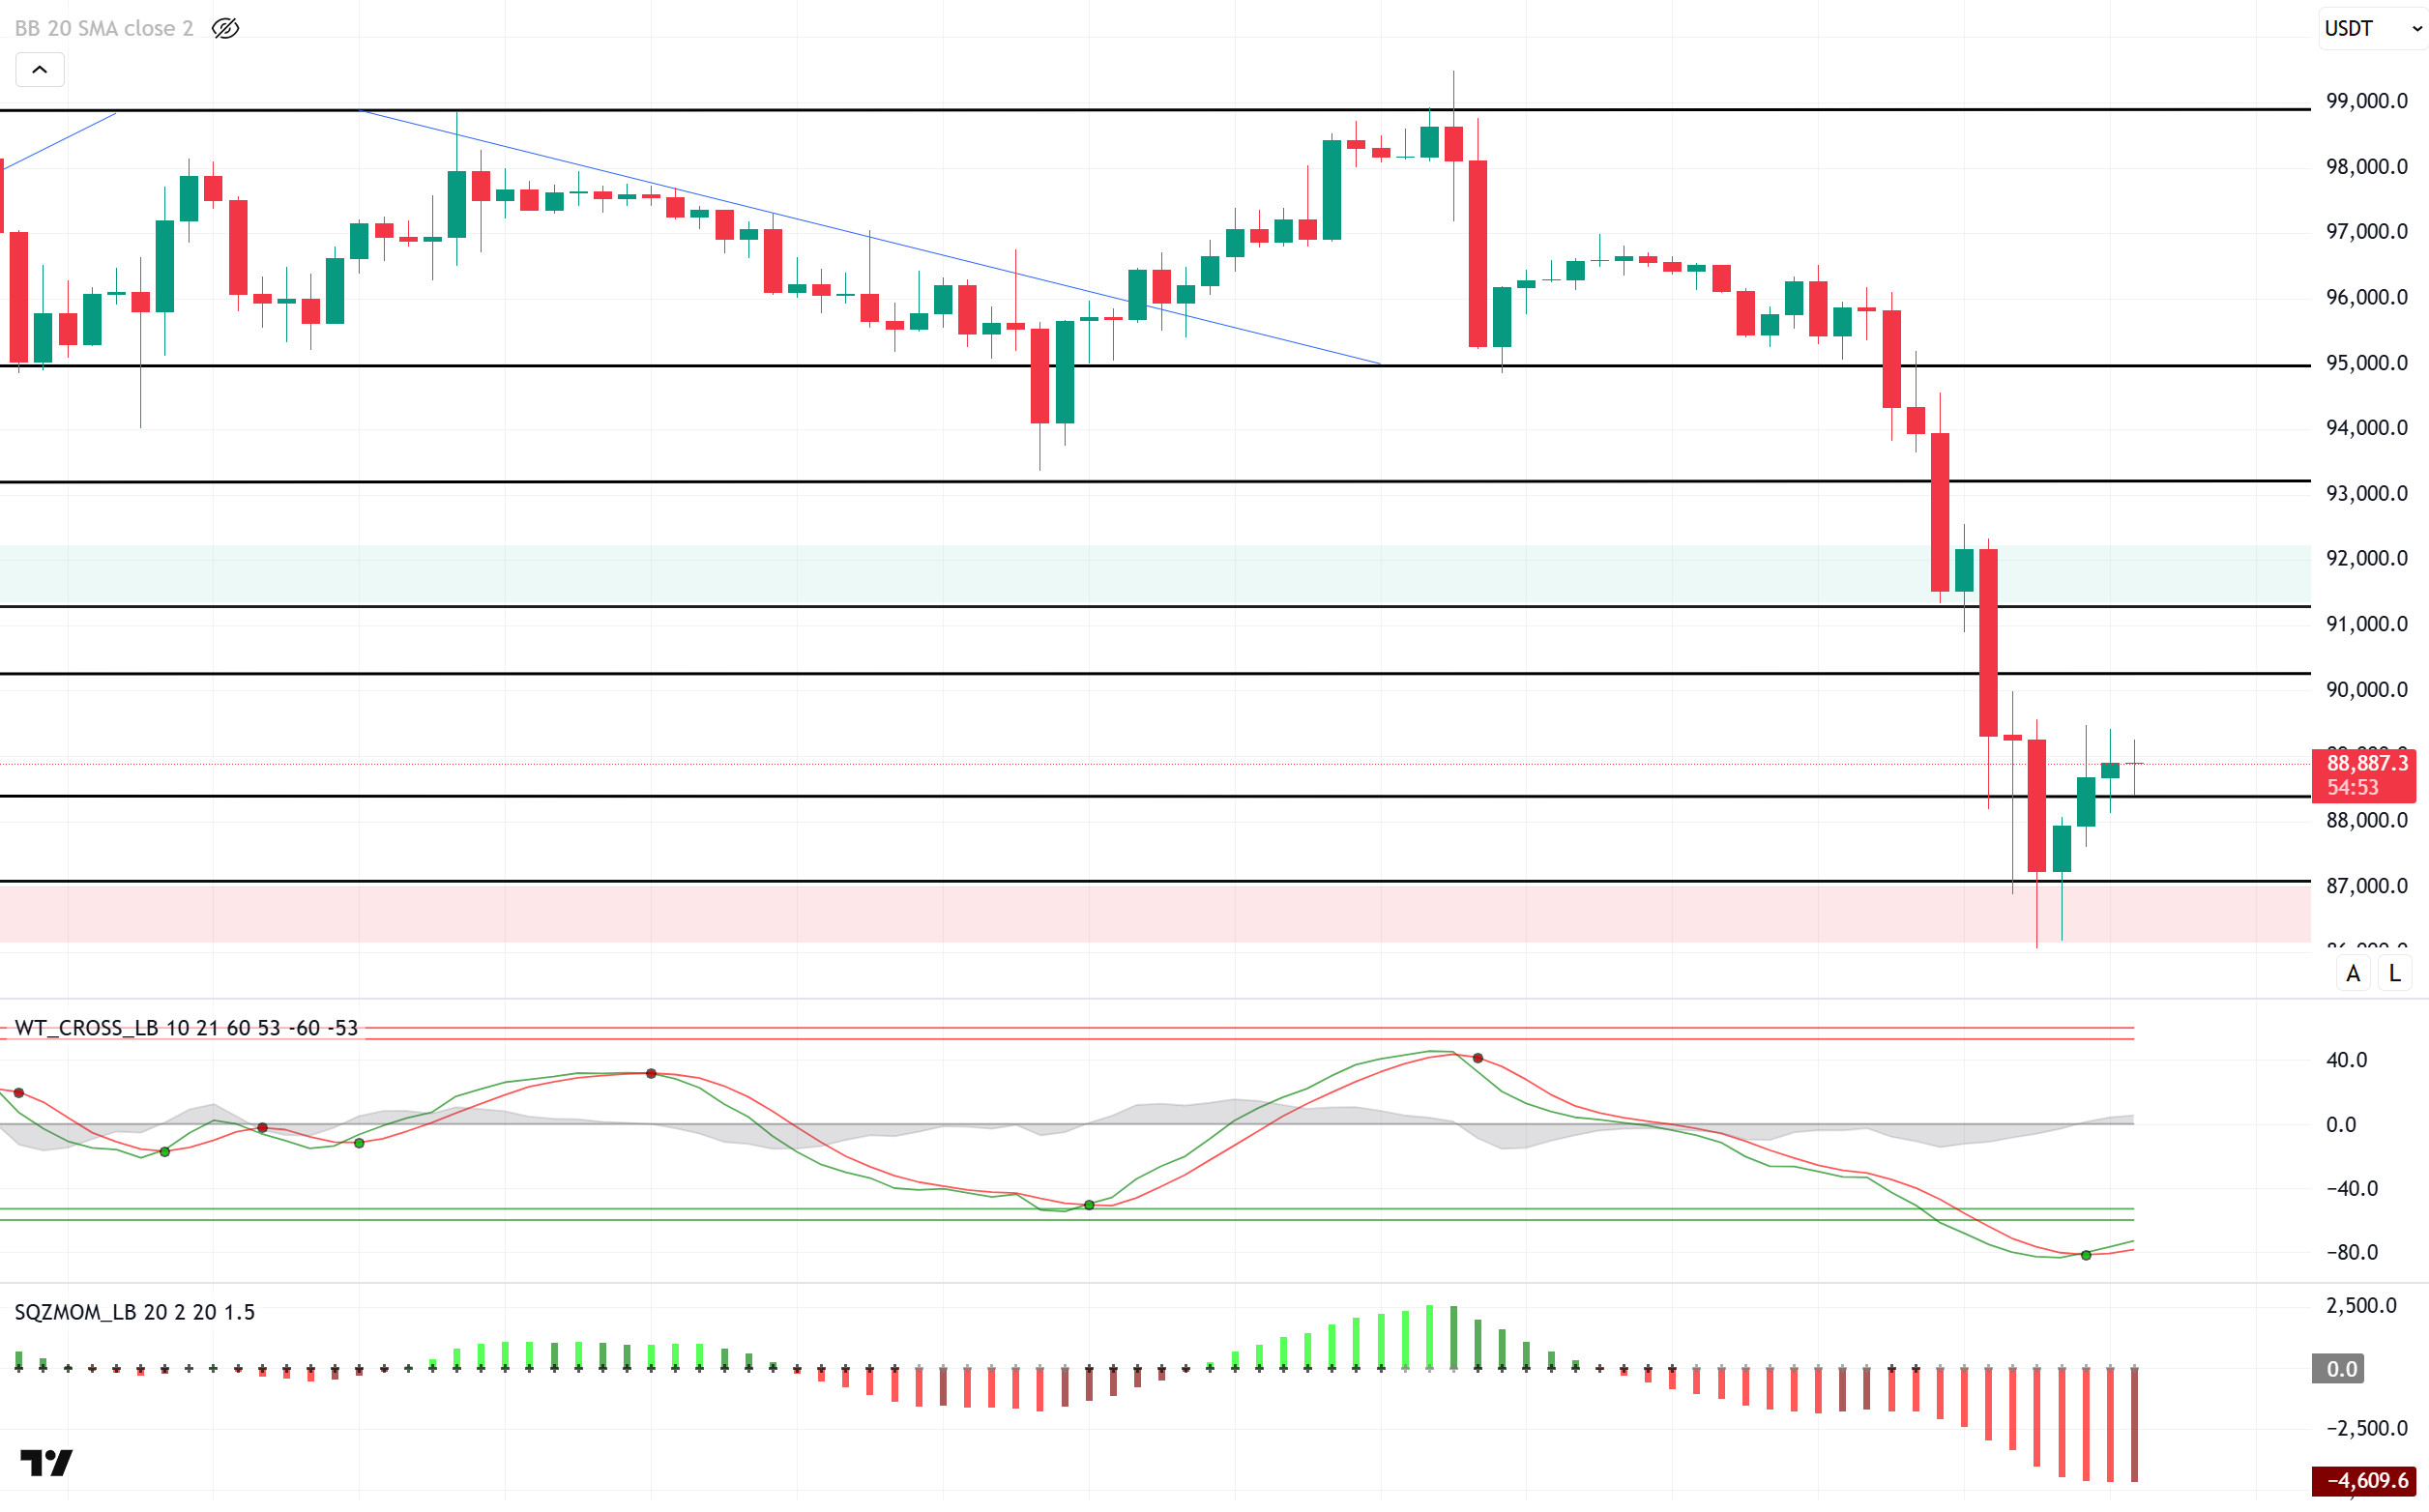
Bitcoin fell below the critical $90,000 level for the first time since November 2024, hitting a three-month low at $86,000. One of the most important reasons for this sharp decline was the ongoing outflows from Spot Bitcoin ETFs. In particular, the net outflow of over $516 million on February 24 caused concern among investors and increased selling pressure in the markets. The main reason for these record outflows in Spot Bitcoin ETFs is that carry trades no longer offer higher yields than the US 10-year Treasury bond.
When we look at the technical outlook after the impact of fundamental factors on the market, it is seen that BTC fell to the 86,000 level yesterday with selling pressure. The price, which entered the recovery process from this level, tested the 89,500 level, but could not stay here and fell again. The changing bandwidth in BTC and the limited consolidation process previously experienced at these levels cause the support and resistance areas to gain a flexible structure. Currently, BTC is trading at 88,850 above the 88,300-support level. When technical oscillators are analyzed, it is observed that it has started to generate a buy signal in the oversold area, but momentum indicators remain weak. While BTC displays a neutral outlook on the hourly charts, it is noteworthy that it continues to maintain its sell signal on the 4-hour and daily charts. The previously mentioned trend reversal and loss of reference points continue to increase the pressure on the price. In the absence of a strong catalyst to move the market up again, it becomes important to follow price movements on the liquidation heat map. Bullish positions are concentrated at 86,000 and 87,000 levels and these levels can be monitored as support zones. On the other hand, the 89,000 – 90,500 band stands out as the resistance zone where selling positions are concentrated.
Supports 88,300 – 87,000 – 85,000
Resistances 90,300 – 92,800 – 95,000
ETH/USDT
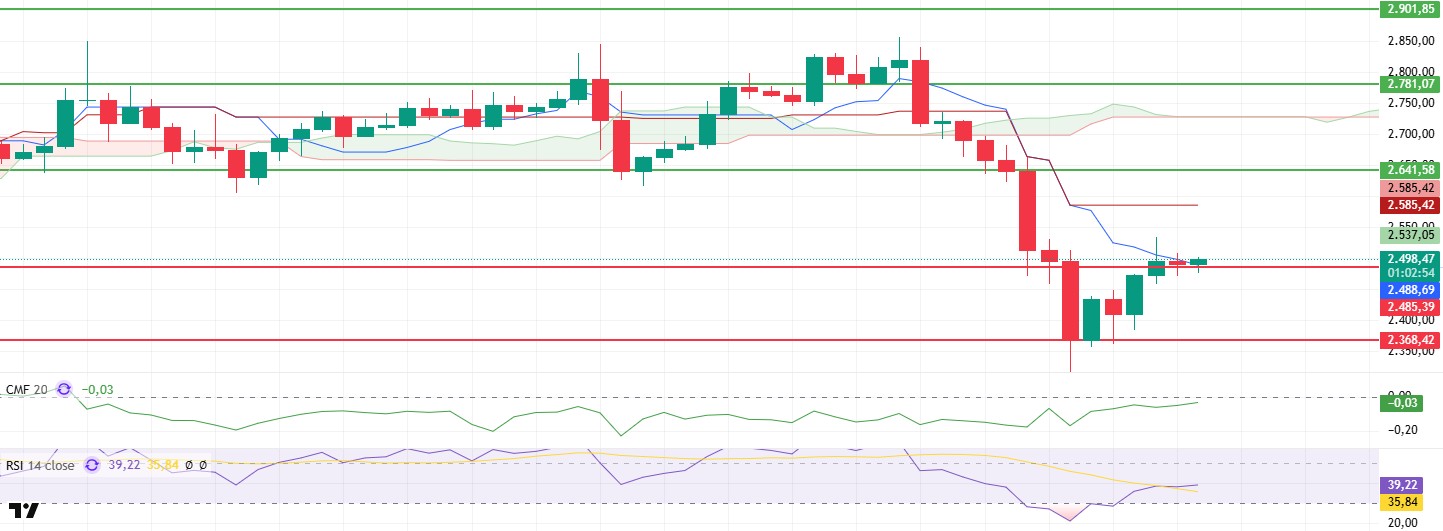
ETH managed to rise above the $2,485 resistance level, taking a reaction from the $2,368 level in line with expectations yesterday evening. When the Cumulative Volume Delta (CVD) is analyzed, it is seen that the selling pressure in the spot market has increased again, but a relatively buyer course prevails on the futures side. This should be considered as a factor that may cause volatility in short-term price movements.
When momentum indicators are analyzed, the Relative Strength Index (RSI) crossed the basic moving average (based MA) line upwards by exiting the oversold zone, which stands out as a positive signal supporting the market outlook. At the same time, the Chaikin Money Flow (CMF) indicator accelerated upwards and converged to the zero line, indicating that liquidity inflows to the market continued. This can be considered as a positive development in terms of the sustainability of the uptrend. When the Ichimoku indicator is analyzed, the price regaining the tenkan level indicates that a bullish pressure on the market is strengthening.
Overall, technical indicators suggest that the price may continue its upward movement during the day for a while. However, for this scenario to be valid, it is critical to maintain the $2.485 level as support. If persistence can be achieved above this level, the price is likely to rise to the level of $ 2,641. On the other hand, it should be kept in mind that if the $2,485 level is broken down, selling pressure may increase and lead to a retracement to $2,368 and then to $2,131.
Supports 2,485 – 2,368 – 2,131
Resistances 2,641 – 2,781 – 2,901
XRP/USDT
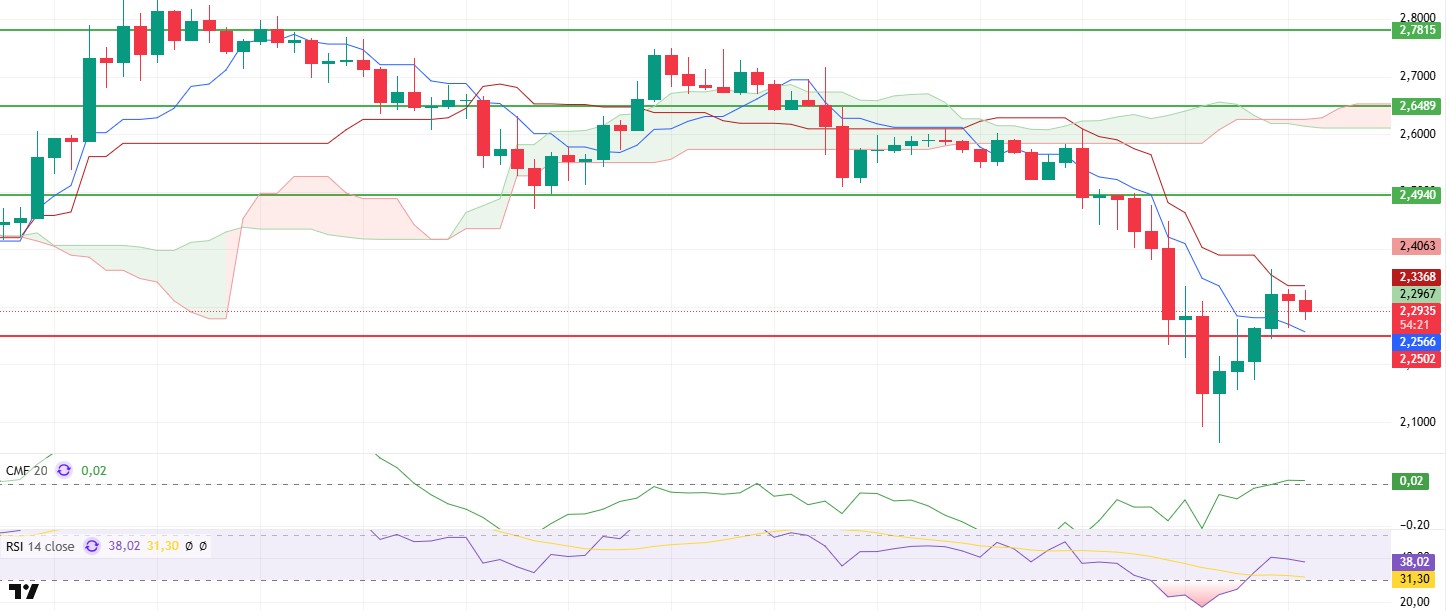
XRP rose to the level of $ 2.36 after breaking the $ 2.25 resistance, as expected yesterday evening. It can be said that the positive outlook continues for XRP, which is currently pricing at around $ 2.30.
Looking at the ichimoku indicator first, the price’s rise back to the area between tenkan and kijun looks positive. The Chaikin Money Flow (CMF) indicator’s rise back to the positive zone after a long period of time indicates that buyers are dominating again and liquidity inflows are accelerating. The fact that the Relative Strength Index (RSI) indicator continues its upward movement from the oversold zone is another detail that contributes to the positive outlook.
In summary, provided that the price does not close below the $ 2.25 level, slight increases can be expected to continue during the day. Closings below $ 2.25 may bring declines to $ 2.02 levels again.
Supports 2.2502 – 2.0201 – 1.6309
Resistances 2.4940 – 2.6489 – 2.7815
SOL/USDT
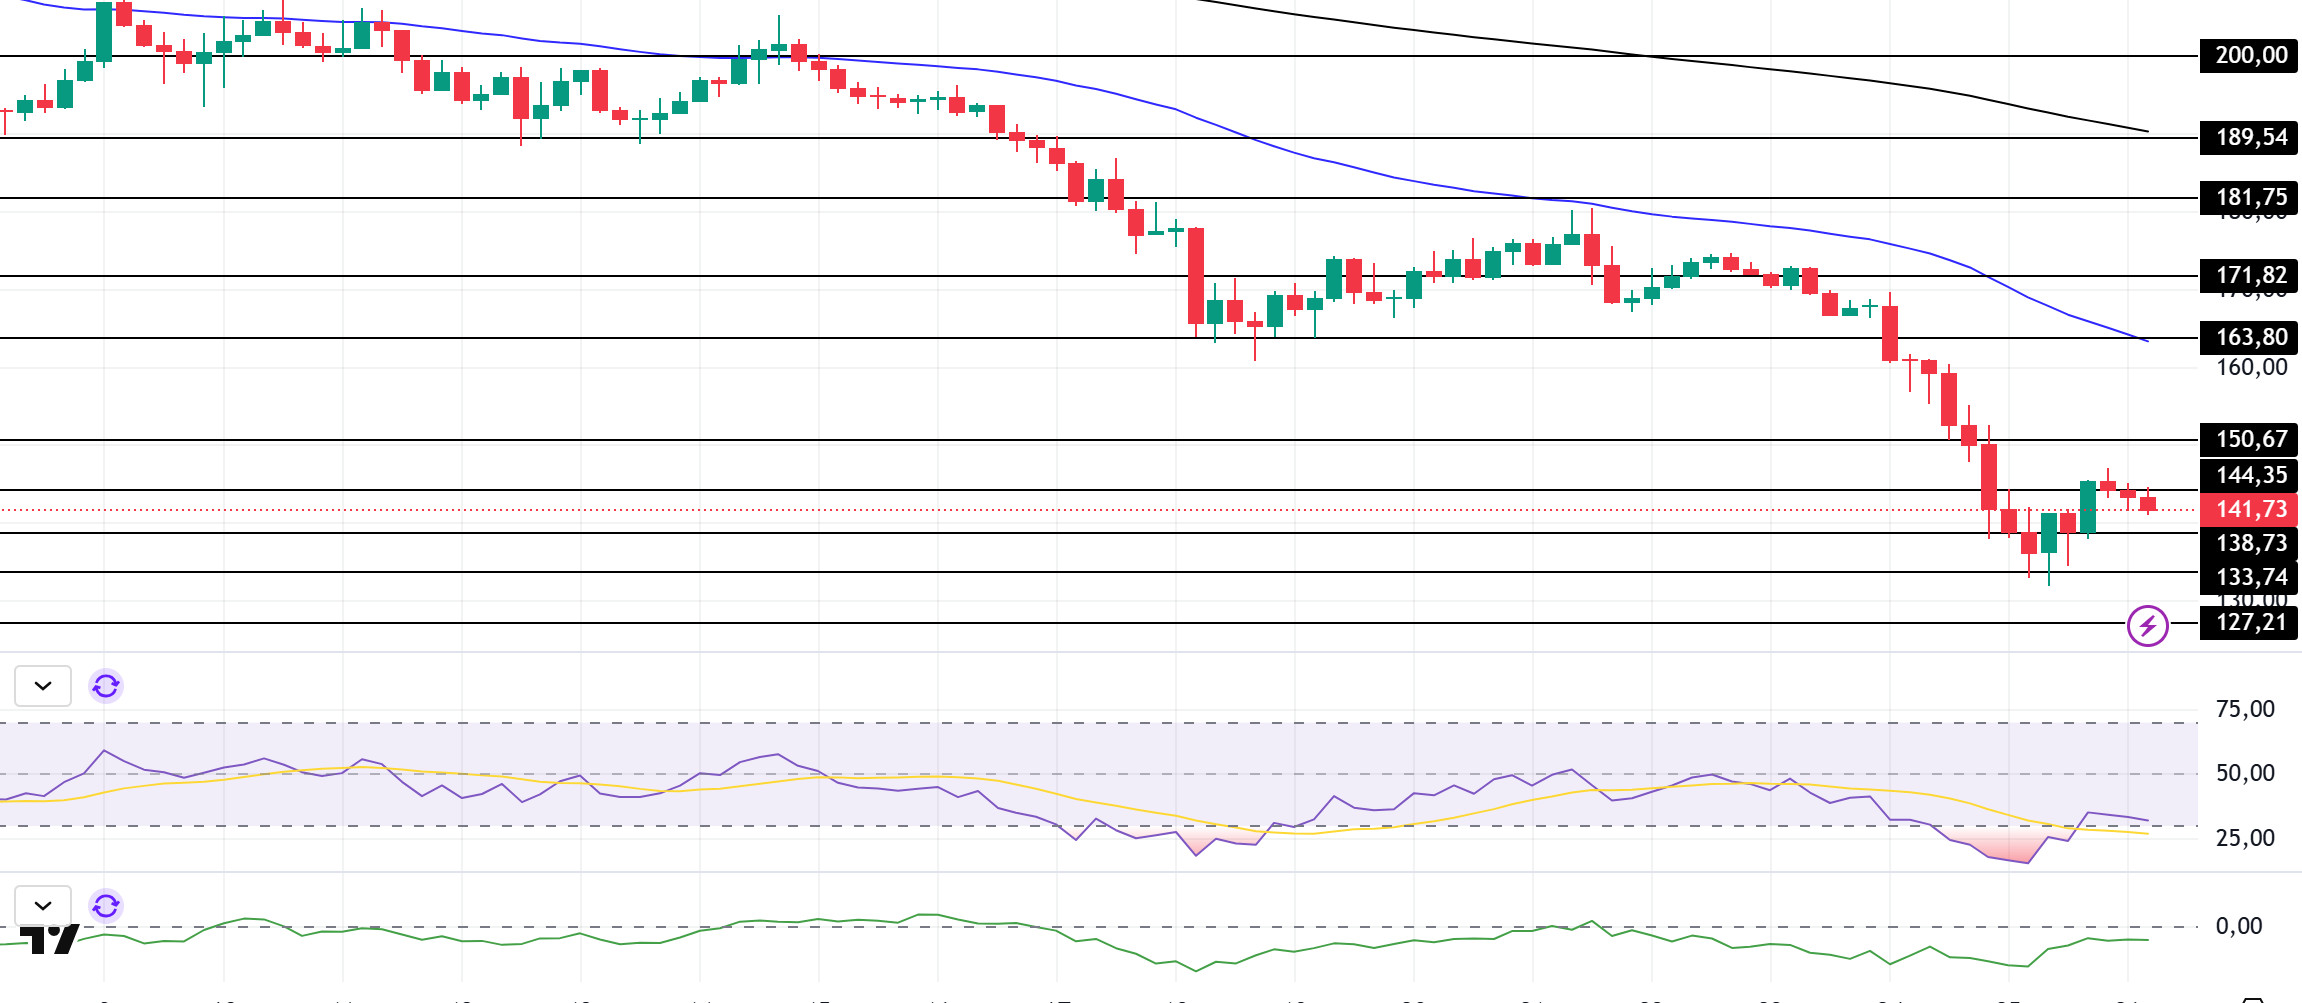
SOL has tested 133.74 as support twice since our analysis yesterday. The asset was slightly bullish but turned bearish again. On the 4-hour timeframe, the 50 EMA (Blue Line) continues to be below the 200 EMA (Black Line). This could deepen the decline further in the medium term. At the same time, the price remained below both moving averages. However, the higher level between the two moving averages could push the asset higher. When we examine the Chaikin Money Flow (CMF)20 indicator, it is in negative territory, but the decline in volume may indicate that money outflows may start to increase further here. However, the Relative Strength Index (RSI)14 indicator has fallen into oversold territory. This shows us that the sell trades have reached the saturation point. This may cause a rise. The $ 163.80 level appears to be a very strong resistance point in the rises driven by both the upcoming macroeconomic data and the news in the Solana ecosystem. If it breaks here, the rise may continue. In case of retracements for the opposite reasons or due to profit sales, the support level of $ 127.21 can be triggered again. If the price comes to these support levels, a potential bullish opportunity may arise if momentum increases.
Supports 138.73 – 133.74 – 127.21
Resistances 144.35 – 150.67 – 163.80
DOGE/USDT
It marked a significant drop in DOGE’s network activity. Whale transactions dropped to 66, while daily active addresses remained below 60 000. This is the lowest number recorded on this network since October 2024.
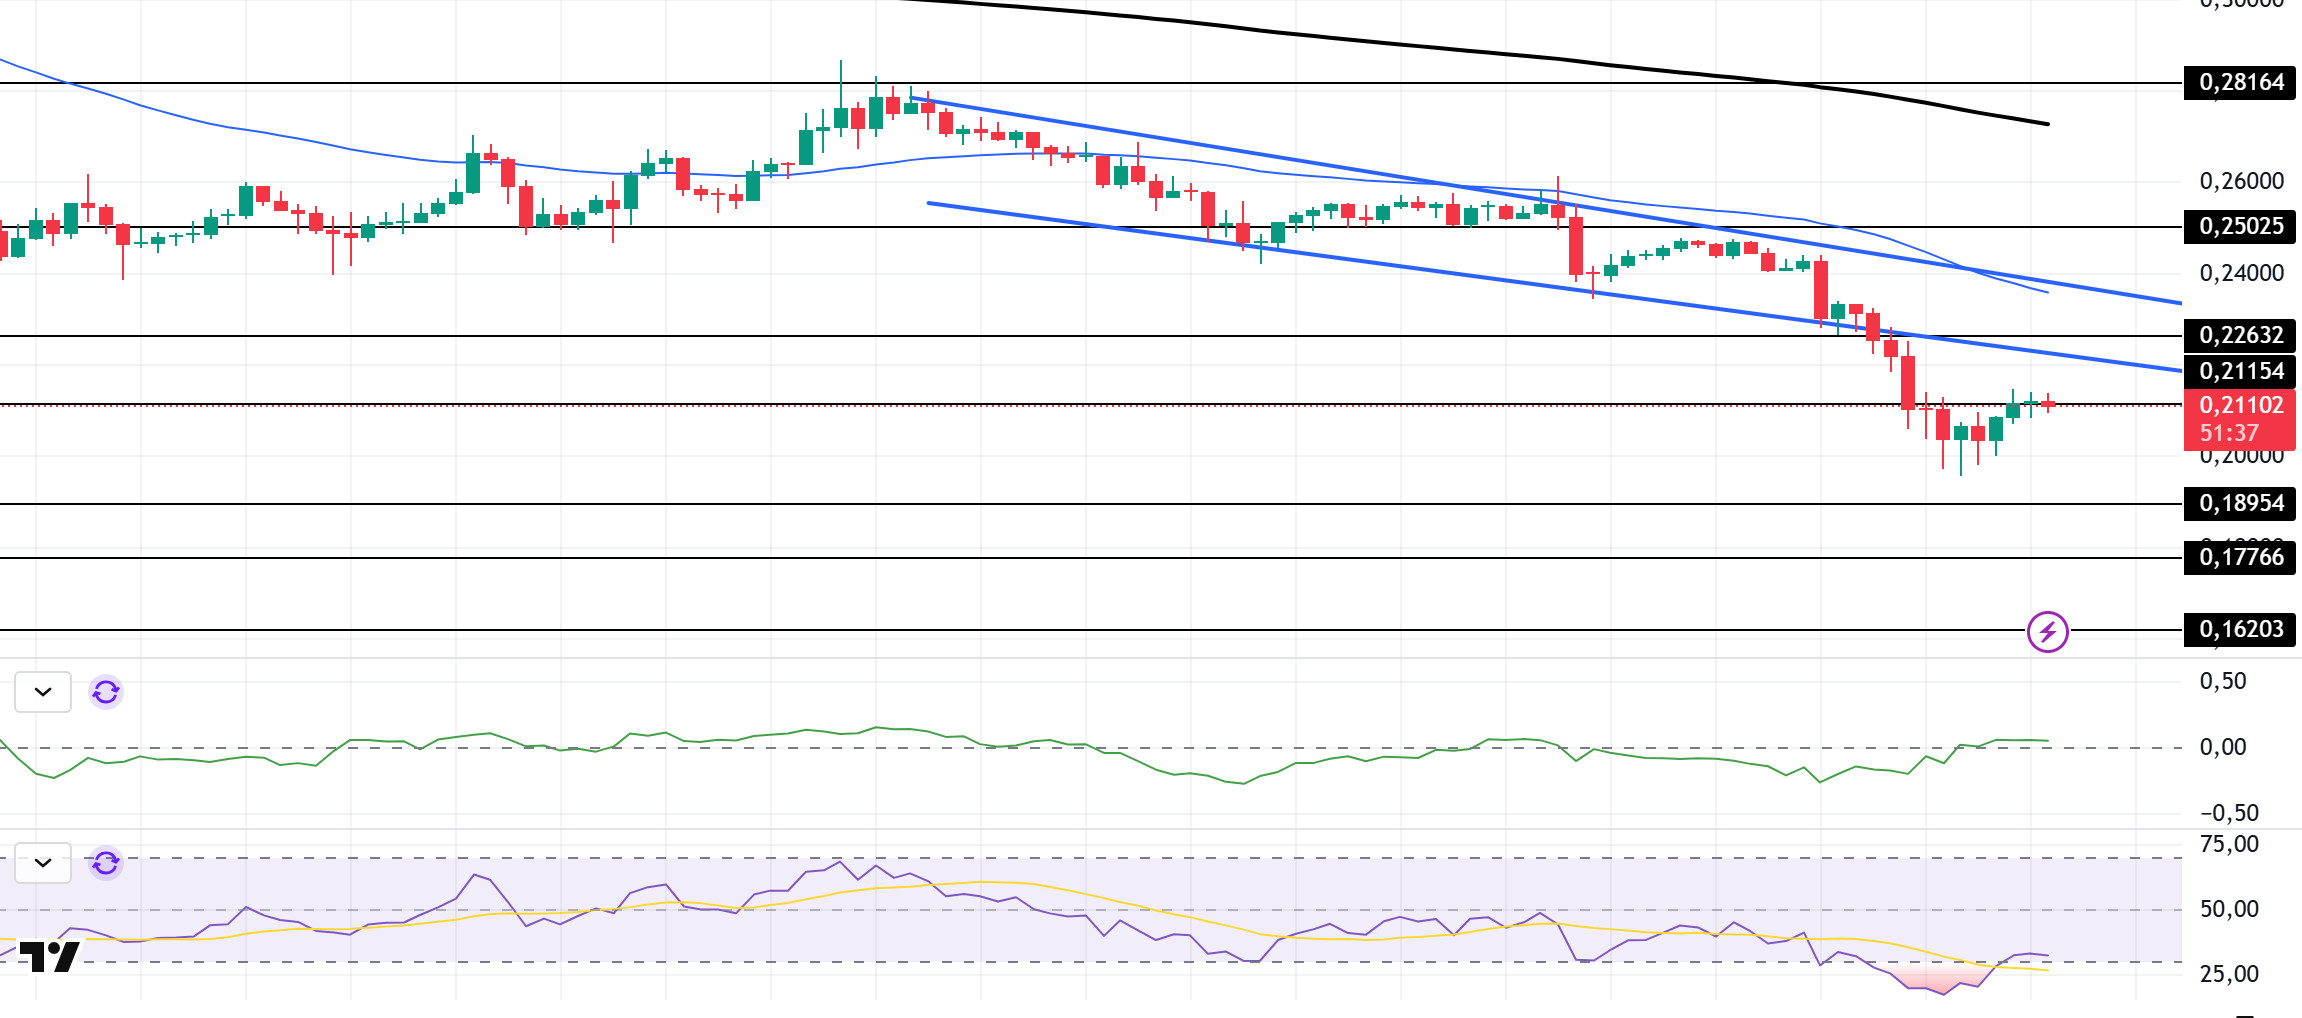
DOGE continued its downtrend since February 15, breaking the downtrend downwards from the support zone. On the 4-hour timeframe, the 50 EMA (Blue Line) is below the 200 EMA (Black Line). This could mean that the decline could deepen further in the medium term. However, the price is hovering below two moving averages. However, the difference between the two moving averages and the difference between the price and the 50 EMA is large, which may increase the probability that DOGE will rise and test the base level of the downtrend that started on February 15 as a resistance. When we examine the Chaikin Money Flow (CMF)20 indicator, it switched to the positive zone, but the decline in volume shows us that money inflows may fall from this level. At the same time, the Relative Strength Index (RSI)14 is at the oversold level. This may lead to a recovery. The $0.22632 level stands out as a very strong resistance point in the rises due to political reasons, macroeconomic data and innovations in the DOGE coin. In case of possible pullbacks due to political, macroeconomic reasons or negativities in the ecosystem, the $0.18954 level, which is the base level of the trend, is an important support. If the price reaches these support levels, a potential bullish opportunity may arise if momentum increases.
Supports 0.18954 – 0.17766 – 0.16203
Resistances 0.21154 – 0.22632 – 0.25025
LEGAL NOTICE
The investment information, comments and recommendations contained herein do not constitute investment advice. Investment advisory services are provided individually by authorized institutions taking into account the risk and return preferences of individuals. The comments and recommendations contained herein are of a general nature. These recommendations may not be suitable for your financial situation and risk and return preferences. Therefore, making an investment decision based solely on the information contained herein may not produce results in line with your expectations.

