
TECHNICAL ANALYSIS
BTC/USDT
Concerns over tariffs, inflation and higher interest rates continued to trigger selling pressure in crypto markets, while doubts about US dominance over artificial intelligence increased the market’s risk aversion. According to CryptoQuant data, 79,300 BTC was sold at a loss on exchanges in the last 24 hours, the largest Bitcoin sale of 2025, while Bitcoin ETFs recorded a net outflow of $1 billion yesterday and a total of $1.8 billion for the week.
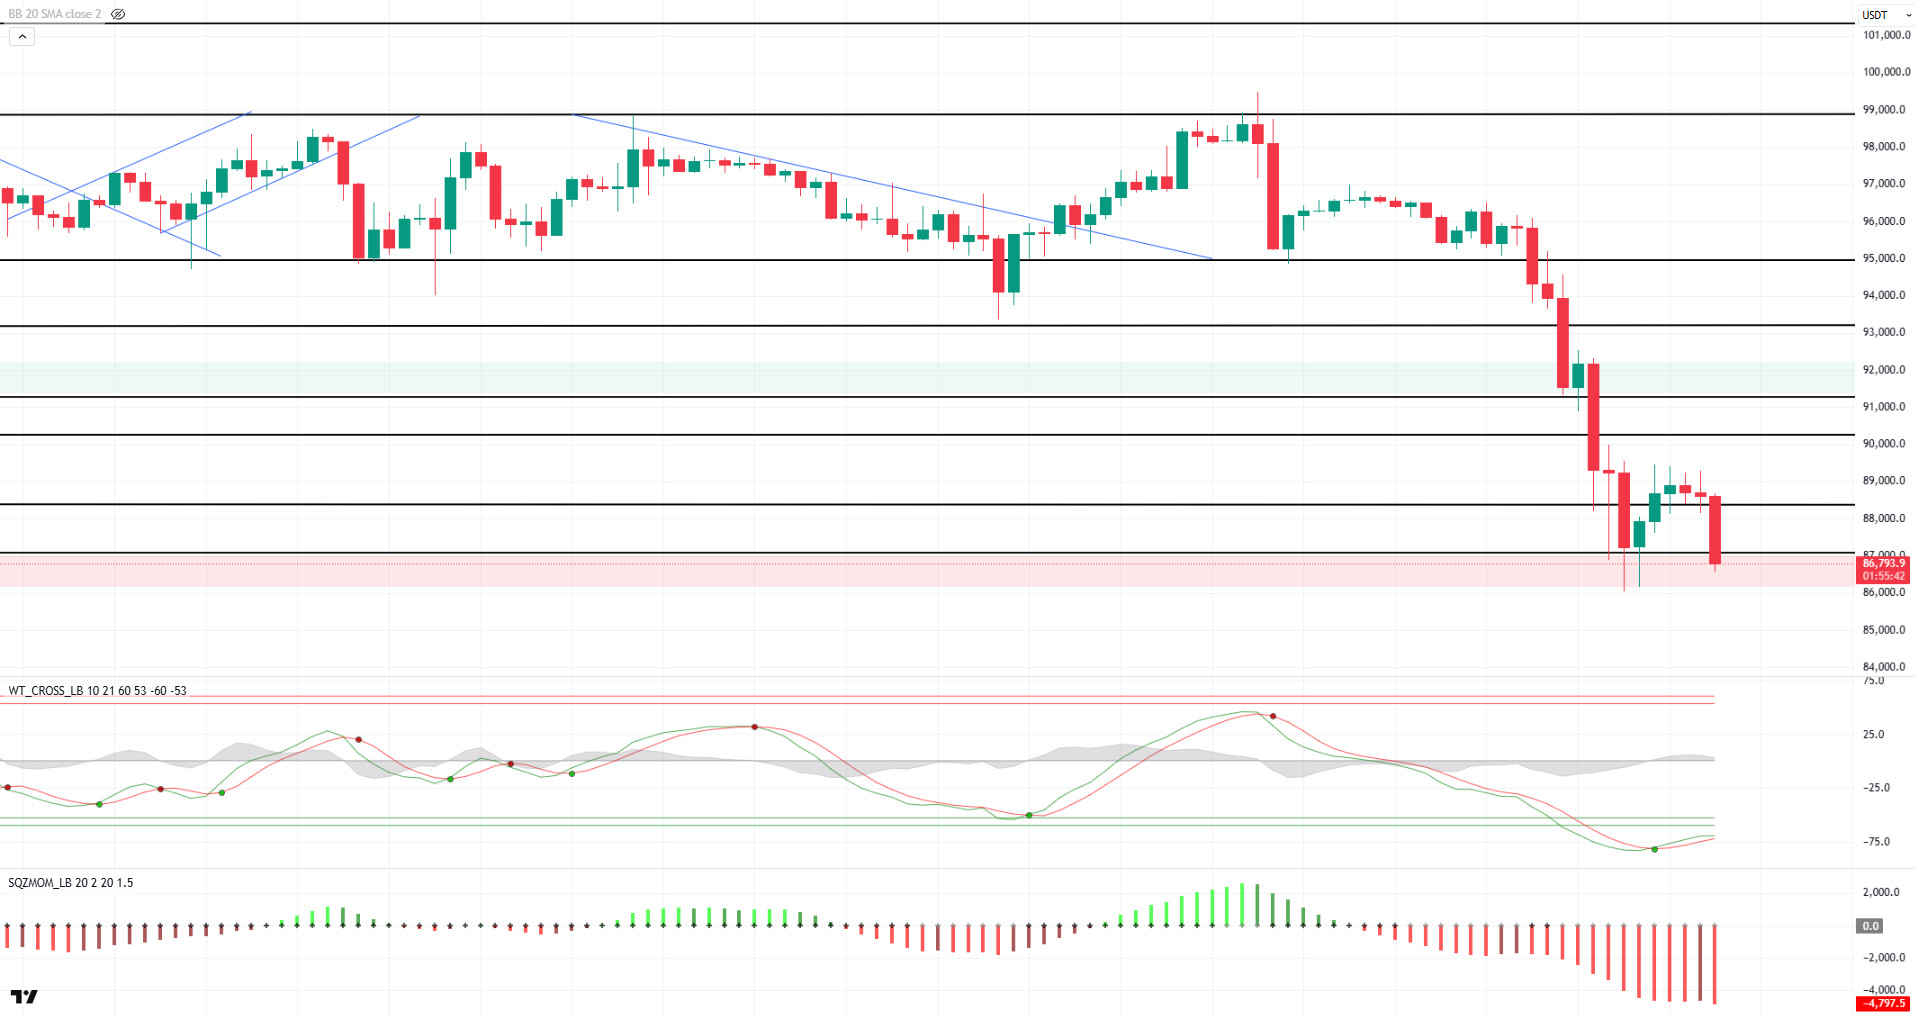
When we look at the technical outlook, it is seen that BTC has completed its correction movement after the decline it recorded and exhibited a downward trend again. BTC, which pushed the 90,000 levels during the day, is currently trading at the critical support level of 87,300. When technical oscillators are analyzed, it is seen that it gives a buy signal in the oversold zone. However, the uncertainty in the market continues to put pressure on the price. Despite the buy signal, momentum indicators display a weak outlook, confirming that the uptrend is struggling to gain strength. In case the decline deepens, 87,000 and 86,000 levels stand out as critical support points. If these levels are lost, the possibility of moving to the gap zone, where there are no support and resistance levels on the technical chart, may increase and volatile price movements may be seen. In a possible recovery scenario, closes above 88,000 will be monitored and given the current uncertainty and low momentum, it is important to follow the market carefully.
Supports 87,000 – 85,000 – 80,000
Resistances 88,300 – 90,300 – 92,800
ETH/USDT
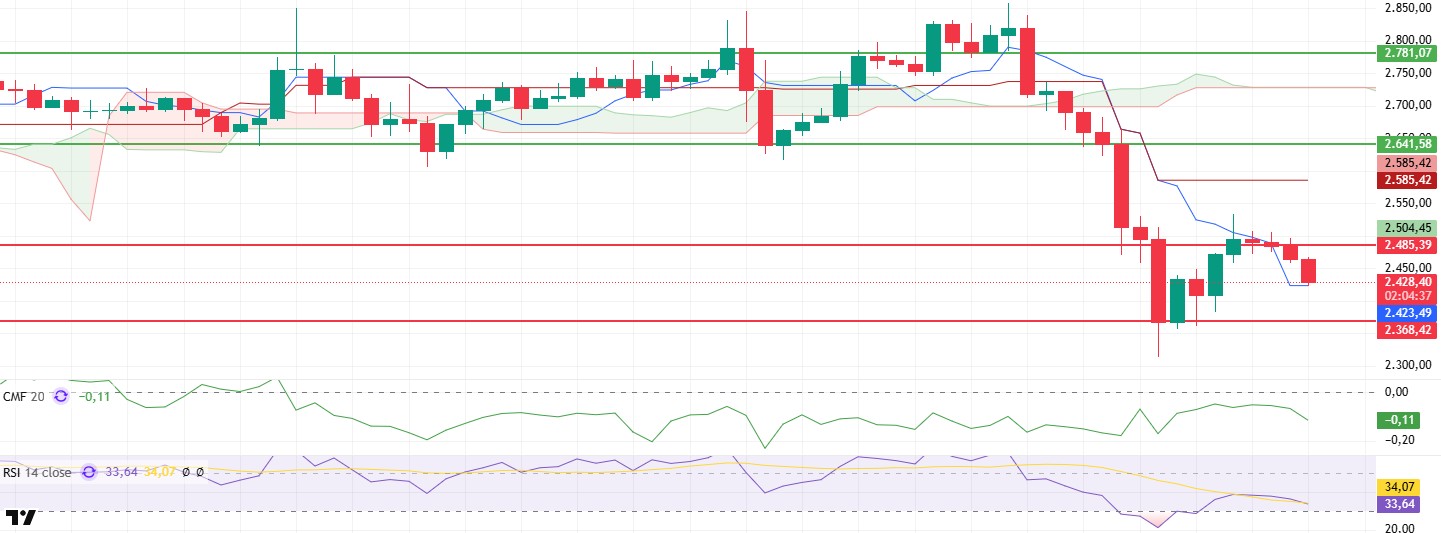
ETH failed to hold at the $2,485 level during the day, retreating to the tenkan line, the short-term equilibrium level of the Ichimoku cloud, at $2,423. However, the fact that this level has not yet been broken to the downside does not provide sufficient justification to say that bullish momentum has been completely lost. While technical indicators are still relatively strong, the Bybit hacker’s market-independent ETH sell-off stands out as one of the main reasons for the negative price action.
In terms of technical analysis, the Chaikin Money Flow (CMF) indicator fell back into negative territory and remained there, indicating that selling pressure is still evident in the market. The negative liquidity flow suggests that the strength of buyers is not dominant enough and the market is open to downside risks. On the other hand, the Relative Strength Index (RSI), although retreating, does not signal deep weakness with support from the Based MA baseline. This suggests that despite the selling pressure, the price has not been dragged into a completely uncontrolled decline and is still trying to hold on to certain support points.
In general terms, the fact that the price has not yet broken the tenkan level and momentum indicators do not produce a sharp sell signal indicates that it is premature to say that the current trend is completely negative. However, if the sales of the Bybit hacker continue, the market may remain under selling pressure for a while. While the $2,368 level stands out as a critical main support point, a downside break of this level could trigger deeper corrections in the ETH price.
Supports 2,368 – 2,131 – 1,999
Resistances 2,485 – 2,641 – 2,781
XRP/USDT
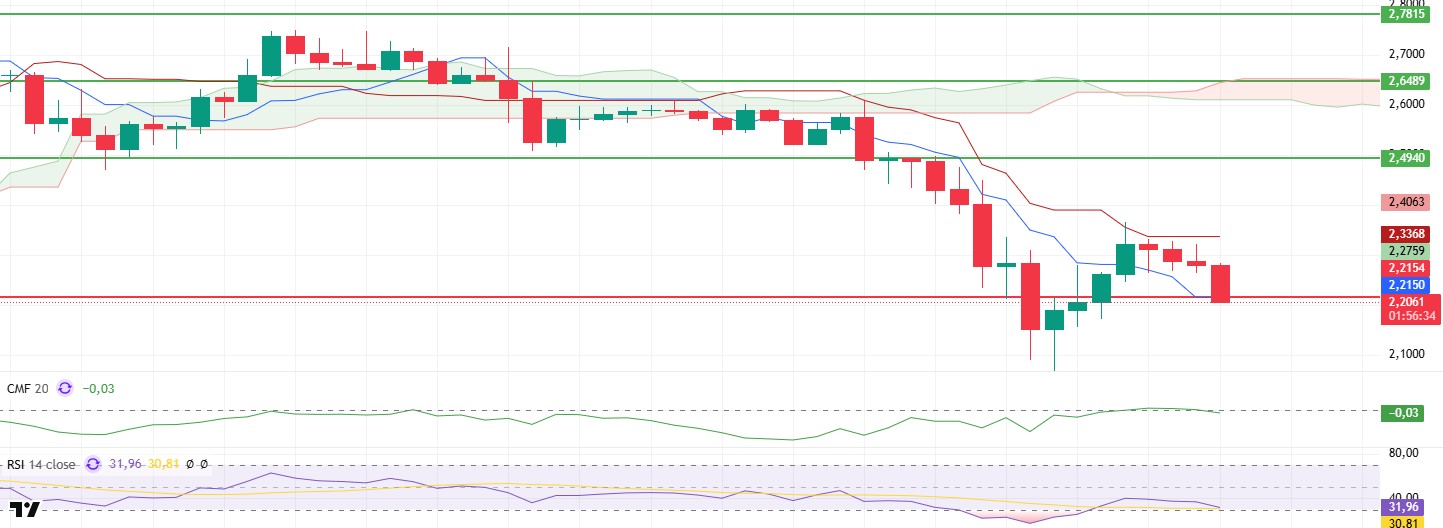
Although XRP rose up to the kijun level in the morning hours, it retreated back to $ 2.23 levels with the sales it encountered in this region. It can be said that a clear direction is not yet clear for XRP, which is pricing between the tenkan and kijun levels.
The rejection of the Chaikin Money Flow (CMF) indicator from the zero line indicates that sellers are again dominant and heavy liquidity outflows may continue. Relative Strength Index (RSI), on the other hand, is falling towards the oversold zone again and momentum seems to be weakening.
As a result, the failure of the price to hold at the 2.21 tenkan level may bring declines down to $ 2.02 levels. However, a reaction from this region may trigger rises up to $ 2.30 and above in the evening hours.
Supports 2.2154 – 2.0201 – 1.6309
Resistances 2.4940 – 2.6489 – 2.7815
SOL/USDT
According to BlockBeats, today Onchain Lens reported that a whale did not stake 198.67 million SOLs worth $1.36 million and transferred the amount to FalconX’s hot wallet. The whale still has 5.79 million SOLs worth $40,376 million in its wallet.
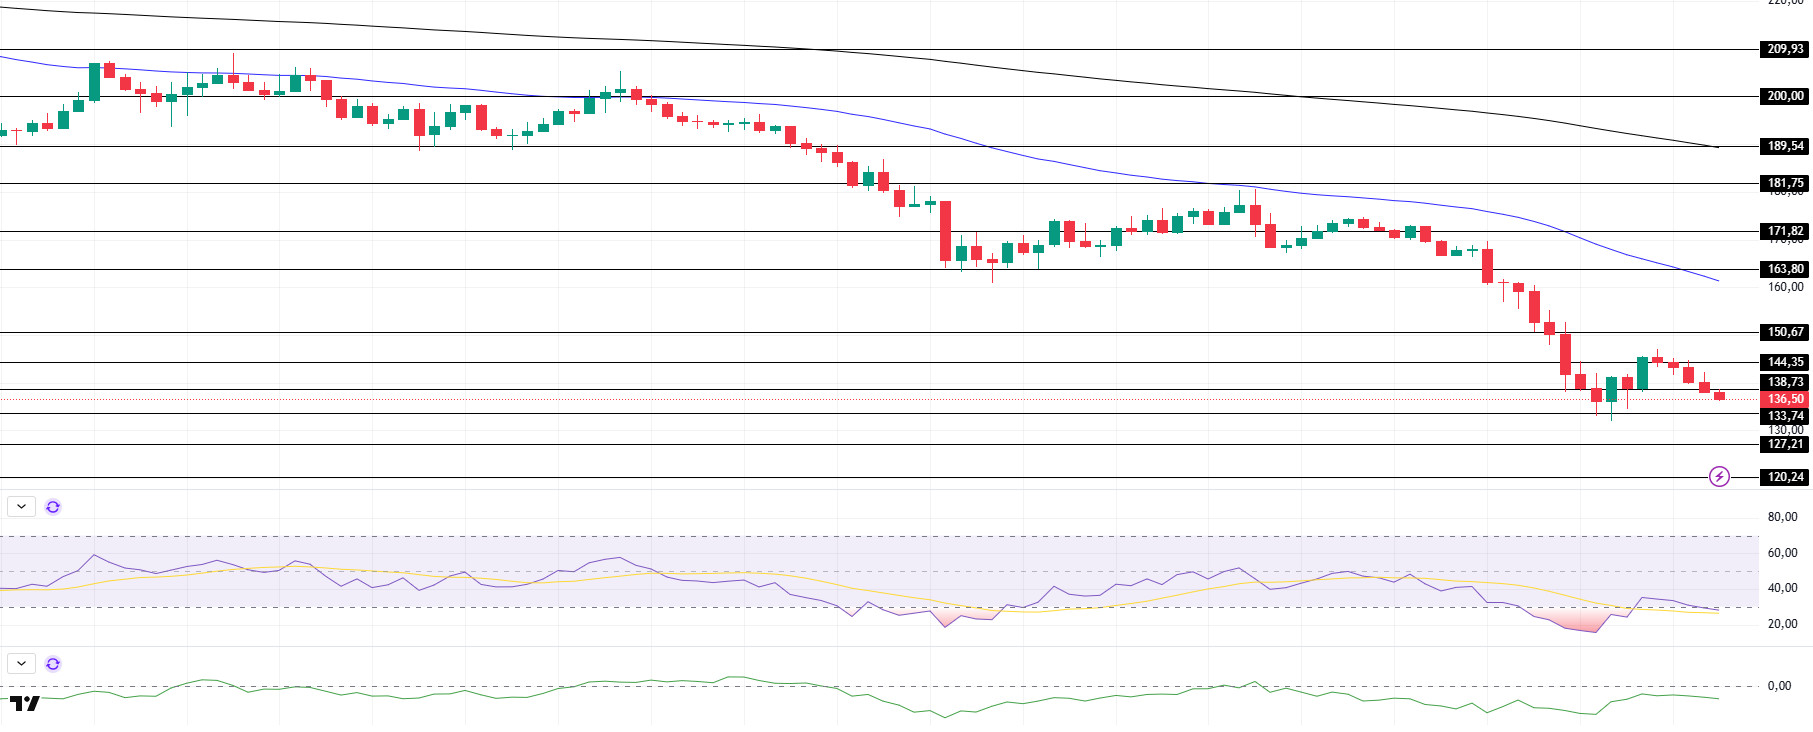
SOL has continued to decline since our analysis in the morning. On the 4-hour timeframe, the 50 EMA (Blue Line) continues to be below the 200 EMA (Black Line). This could deepen the decline further in the medium term. At the same time, the price remained below both moving averages. However, the higher level between the two moving averages could push the asset higher. When we examine the Chaikin Money Flow (CMF)20 indicator, it is in the negative zone and the decline in volume may mean that money outflows may start to increase further. However, the Relative Strength Index (RSI)14 indicator has fallen into oversold territory. This shows us that the sell trades have reached the saturation point. This could be the beginning of a rise. The $ 163.80 level appears to be a very strong resistance point in the rises driven by both the upcoming macroeconomic data and the news in the Solana ecosystem. If it breaks here, the rise may continue. In case of retracements for the opposite reasons or due to profit sales, the support level of $ 127.21 can be triggered again. If the price comes to these support levels, a potential bullish opportunity may arise if momentum increases.
Supports 133.74 – 127.21 – 120.24
Resistances 138.73 – 144.35 – 150.67
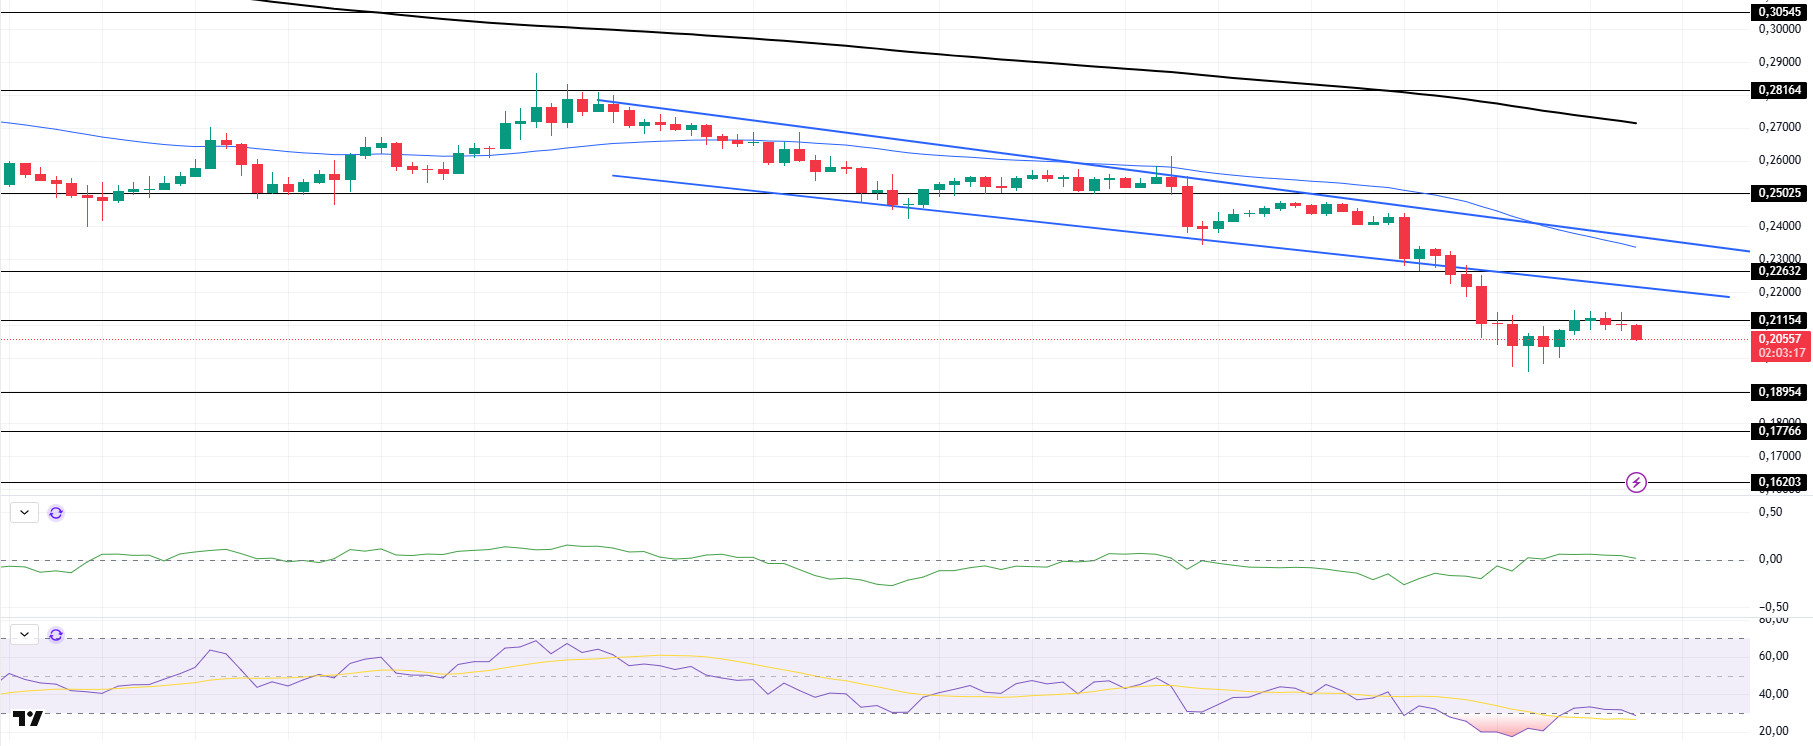
DOGE/USDT
Dogecoin whales sent 312 million DOGE to a centralized exchange. Active addresses on the network have reached a record low since November last year.
DOGE continued its downtrend since February 15, breaking the downtrend downwards from the support zone. The asset, which has been flat since our morning analysis, is below the 50 EMA (Blue Line) 200 EMA (Black Line) on the 4-hour timeframe. This could mean that the decline could deepen further in the medium term. However, the price is below two moving averages. However, the difference between the two moving averages and the difference between the price and the 50 EMA is large, which may increase the probability that DOGE will rise and test the base level of the downtrend that started on February 15 as a resistance. When we examine the Chaikin Money Flow (CMF)20 indicator, it is in the positive zone, close to the neutral level, but the volume is balanced, indicating that inflows are not high. At the same time, Relative Strength Index (RSI)14 is at the oversold level. This may lead to a recovery. The $ 0.22632 level is a very strong resistance point in the rises due to political reasons, macroeconomic data and innovations in the DOGE coin. In case of possible pullbacks due to political, macroeconomic reasons or negativities in the ecosystem, the $0.18954 level, which is the base level of the trend, is an important support. If the price reaches these support levels, a potential bullish opportunity may arise if momentum increases.
Supports 0.18954 – 0.17766 – 0.16203
Resistances 0.21154 – 0.22632 – 0.25025
LEGAL NOTICE
The investment information, comments and recommendations contained herein do not constitute investment advice. Investment advisory services are provided individually by authorized institutions taking into account the risk and return preferences of individuals. The comments and recommendations contained herein are of a general nature. These recommendations may not be suitable for your financial situation and risk and return preferences. Therefore, making an investment decision based solely on the information contained herein may not produce results in line with your expectations.

