
TECHNICAL ANALYSIS
BTC/USDT
Global markets and the crypto ecosystem are experiencing an eventful week with regulatory developments and changes in trade policies. US President Donald Trump announced the imminent imposition of a 25% tariff on the European Union, which could cover automobiles and other goods. On the other hand, Nvidia grew its revenue by 78% to $39.3 billion thanks to strong demand for its artificial intelligence chips. On the crypto side, the US Senate held its first digital asset hearing and announced that stablecoin legislation will be prioritized. Additionally, the US Treasury Secretary appointed Tyler Williams as blockchain policy advisor to lead digital asset policies.
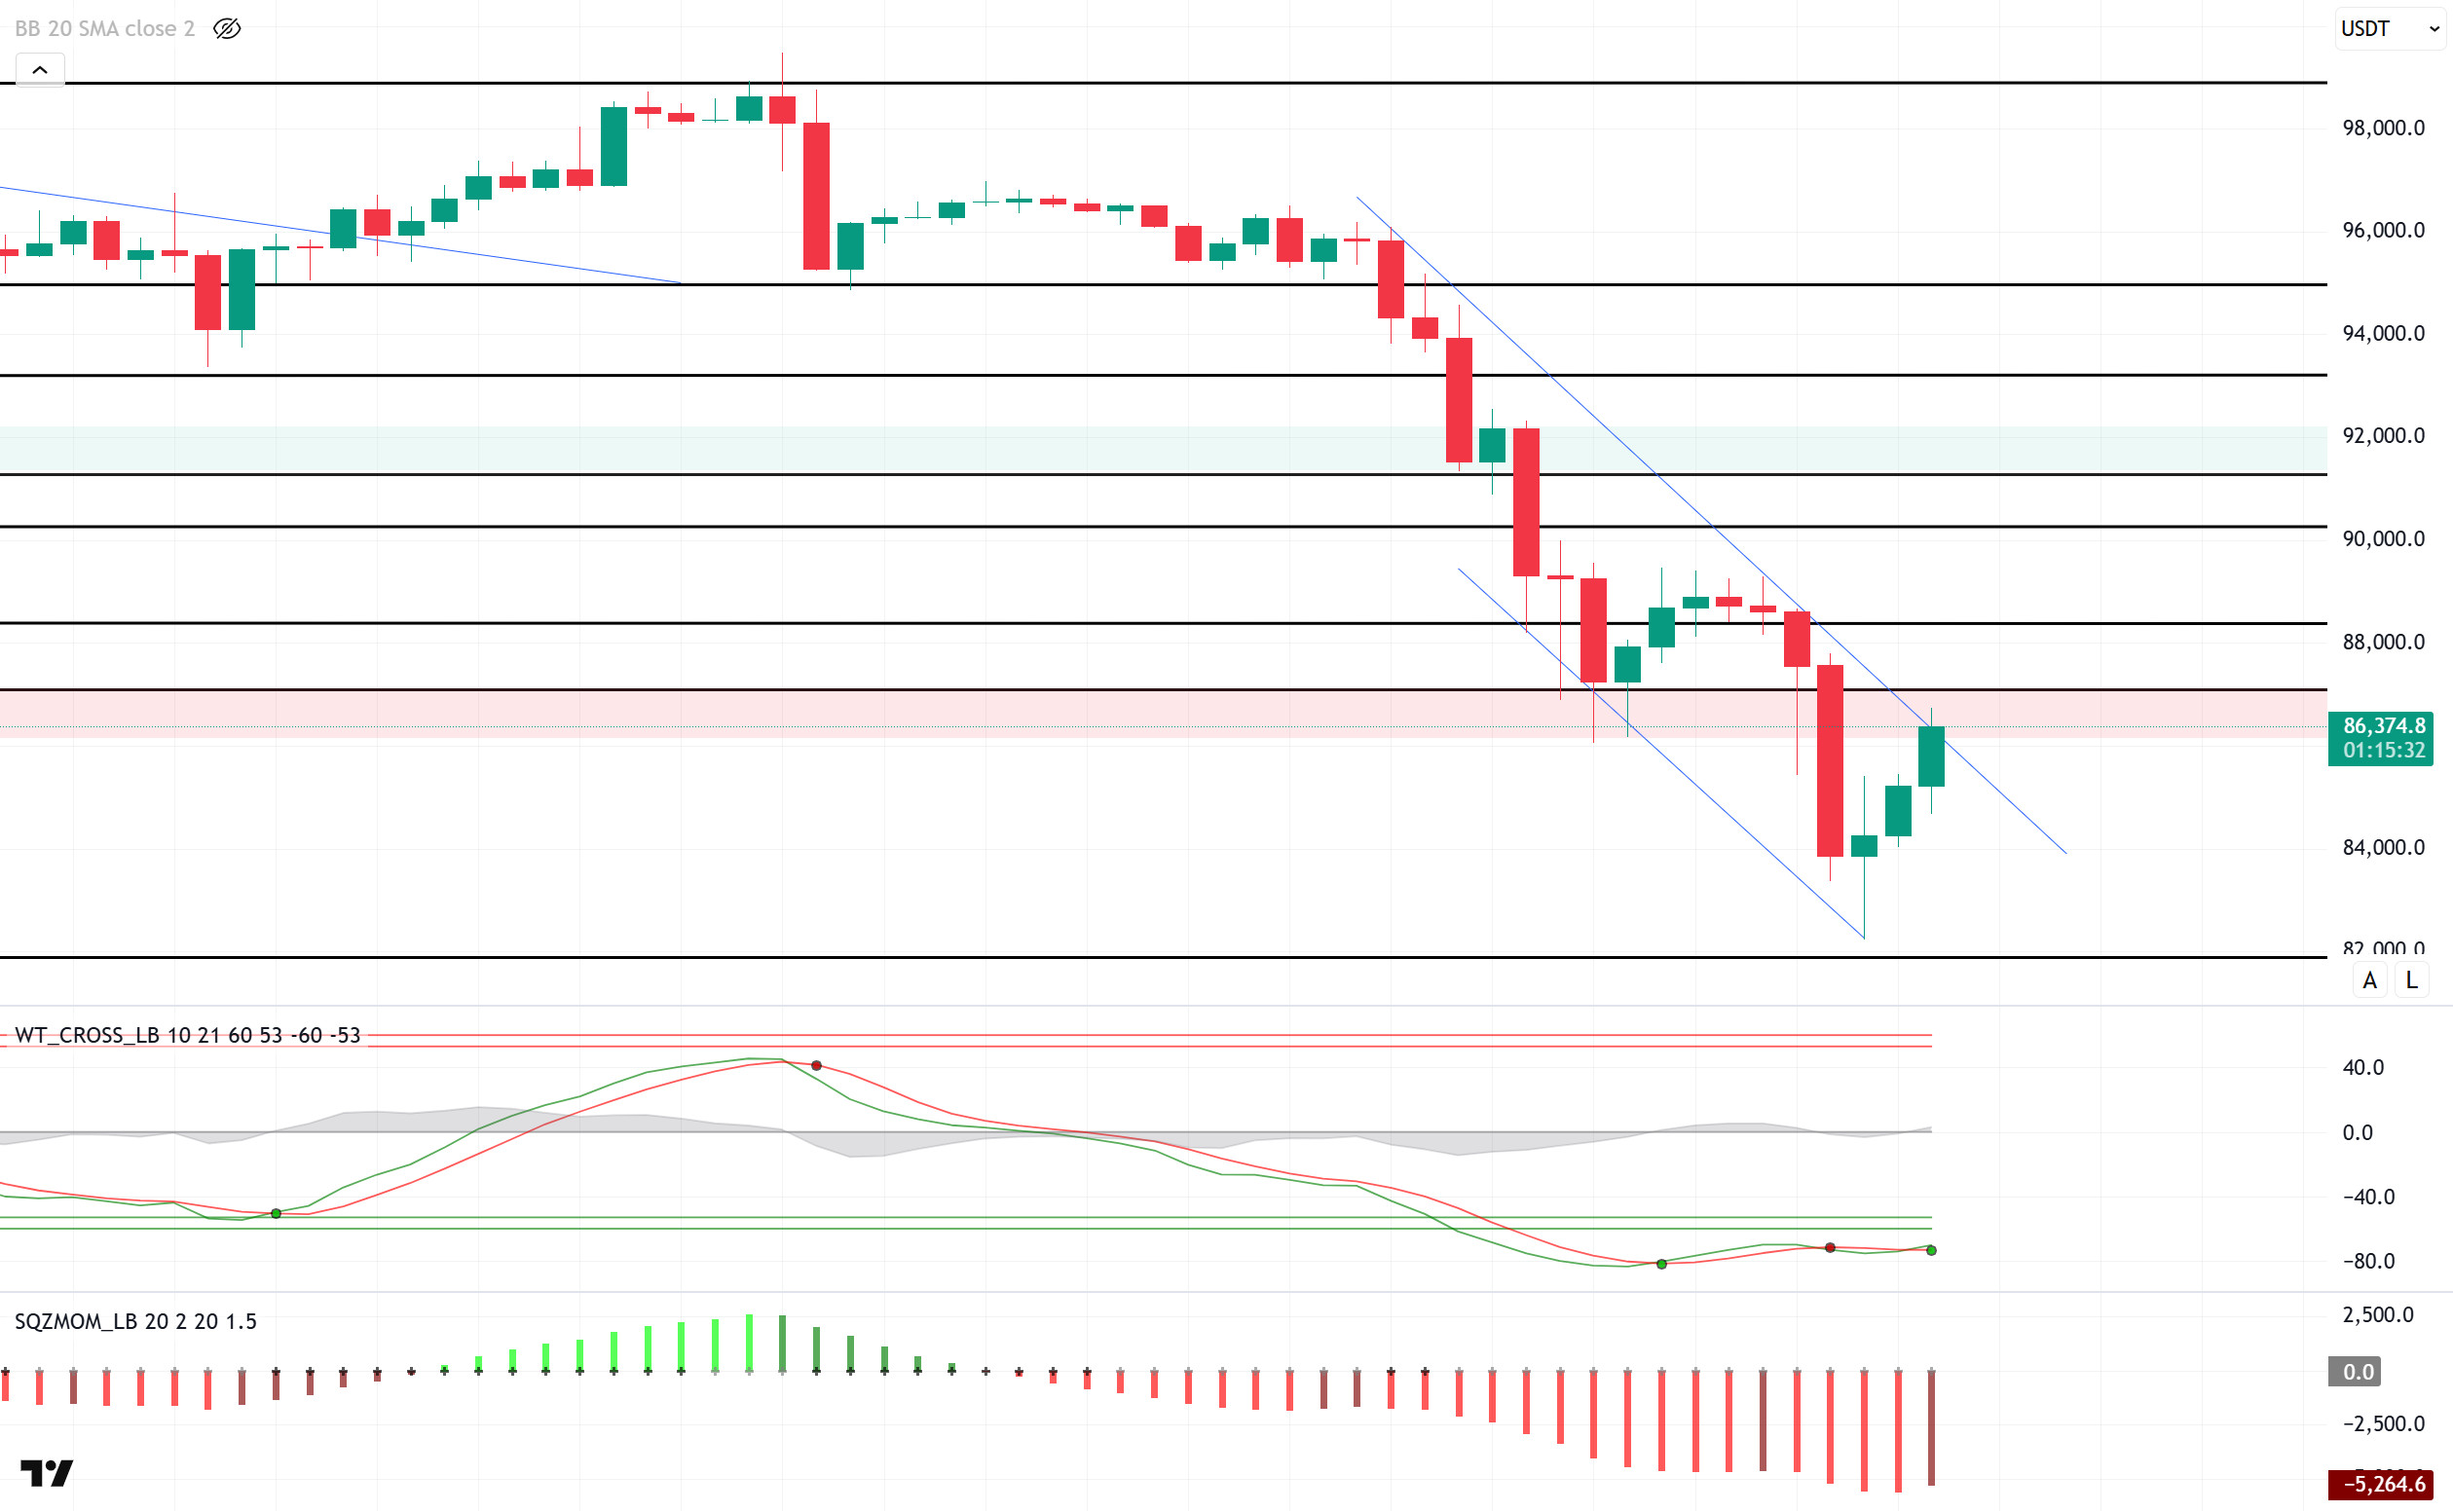
Looking at the technical outlook, BTC experienced another sharp pullback with selling pressure. With the break of the 85,000 level we mentioned in previous analysis, the price fell to 82,200, entering the so-called “gap” zone. Although technical oscillators have started to generate buy signals on the hourly and 4-hour charts, bullish movements remain only as a correction of declines for now due to the seller’s market. The continuation of the downtrend structure in the medium term may require BTC to break this structure and form a bowl pattern to signal an upward reversal. An analysis of the weekly liquidation heatmap shows that futures are dominated by short positions and the market has not yet formed a clear bullish expectation in the medium term. With high volatility, the 87,000 – 88,000 band stands out as an accumulation zone if BTC rebounds. However, if the selling pressure continues, the price may retest the 82,000 level. As a result, while the medium-term downtrend in BTC is maintained, the recovery movements do not give a permanent bullish signal for the time being. While 87,000 – 88,000 levels are followed as critical resistances for recovery, the 82,000 level can be monitored as a support point if selling pressure continues.
Supports 85,000 – 82,000 – 80,000
Resistances 87,000 – 88,300 – 90,300
ETH/USDT
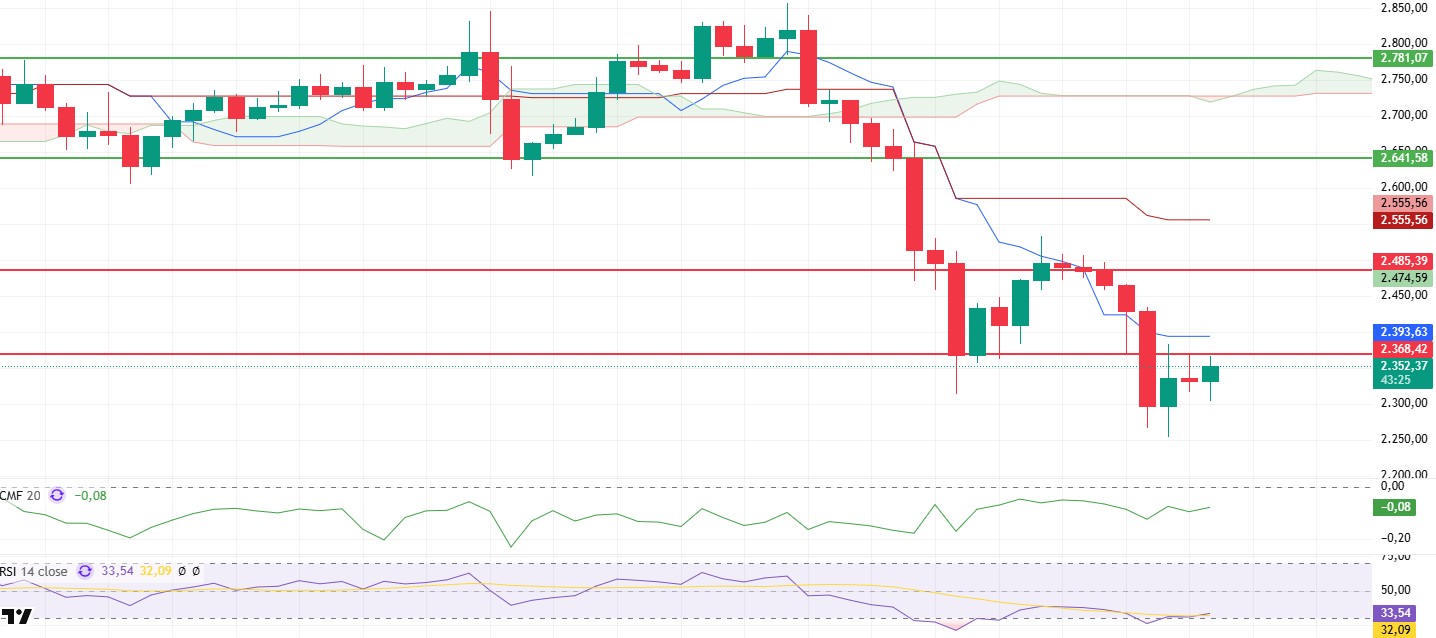
ETH lost its support of $ 2,368 yesterday evening and retreated to the level of $ 2,250. At this level, reaction purchases were observed as buyers stepped in and the price is trying to rise above the $2,368 level again. However, current technical indicators still contain uncertainties about the sustainability of the rise.
In particular, the downward movement of the kumo cloud indicates that the overall trend of the market is still weak, while the decline in the tenkan level indicates that the conditions for the price to recover in the short term are not fully formed. However, the Relative Strength Index (RSI) indicator’s breakout from the oversold zone gives a positive signal for short-term upside movements. The convergence of the Chaikin Money Flow (CMF) indicator to the zero line indicates that the market has started to receive liquidity inflows, suggesting that buyers are trying to regain strength.
In this context, if the price can persist above the $2,368 level, the possibility of gradual increases during the day will increase. However, if sufficient buyer volume cannot be achieved after exceeding this level and the selling pressure from the resistance zone pushes the price down again, there is a risk that the decline will deepen to $ 2,131.
Supports 2,131 – 1,999 – 1,860
Resistances 2,368 – 2,485 – 2,641
XRP/USDT
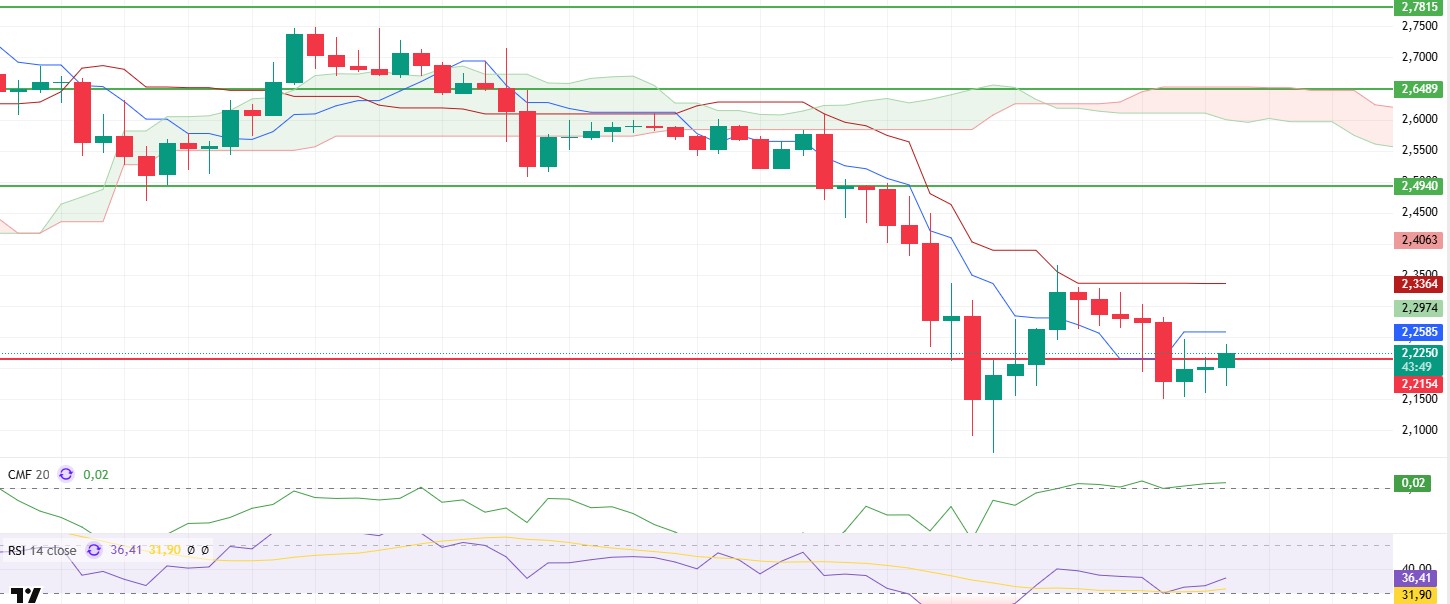
XRP rose as high as the $2.33 area where the Kijun level was located yesterday but then faced selling pressure at this level and retreated and fell below the $2.21 support. However, with the re-engagement of buyers in the night hours, there was a slight rise, and the price managed to rise above the $ 2.21 level.
Technical indicators provide important signals about price movements. The Chaikin Money Flow (CMF) indicator moved back into positive territory, which is a positive signal that liquidity is flowing into the market and buyers are gaining strength. In addition, the Relative Strength Index (RSI) moved upwards with support from the oversold area, confirming that momentum is rising, and the price is on a recovery trend. However, according to the Ichimoku indicator, XRP price is still hovering below the tenkan and kijun levels, indicating that the overall market outlook remains negative. Therefore, it is critical that these levels are breached in order for price action to turn into a strong uptrend.
As a result, if XRP holds above the $2.21 level, there may be rises up to the Tenkan level in the short term. However, if the $2.21 level is lost, there is a risk of deepening the downtrend with increased selling pressure.
Supports 2.2154 – 2.0201 – 1.6309
Resistances 2.4940 – 2.6489 – 2.7815
SOL/USDT
A centralized exchange has launched CFTC-regulated Solana futures contracts, an important step towards potential Solana ETF approvals. Pump. Fun’s X account was hacked to promote a fake token called ‘$PUMP’. The crypto community quickly detected the fraudulent activity. New addresses on the Solana network hit a 3-month low, signaling waning investor interest and weakening macro momentum. From 18.5 million active addresses to just 7.3 million today, network activity has dropped by 60%.
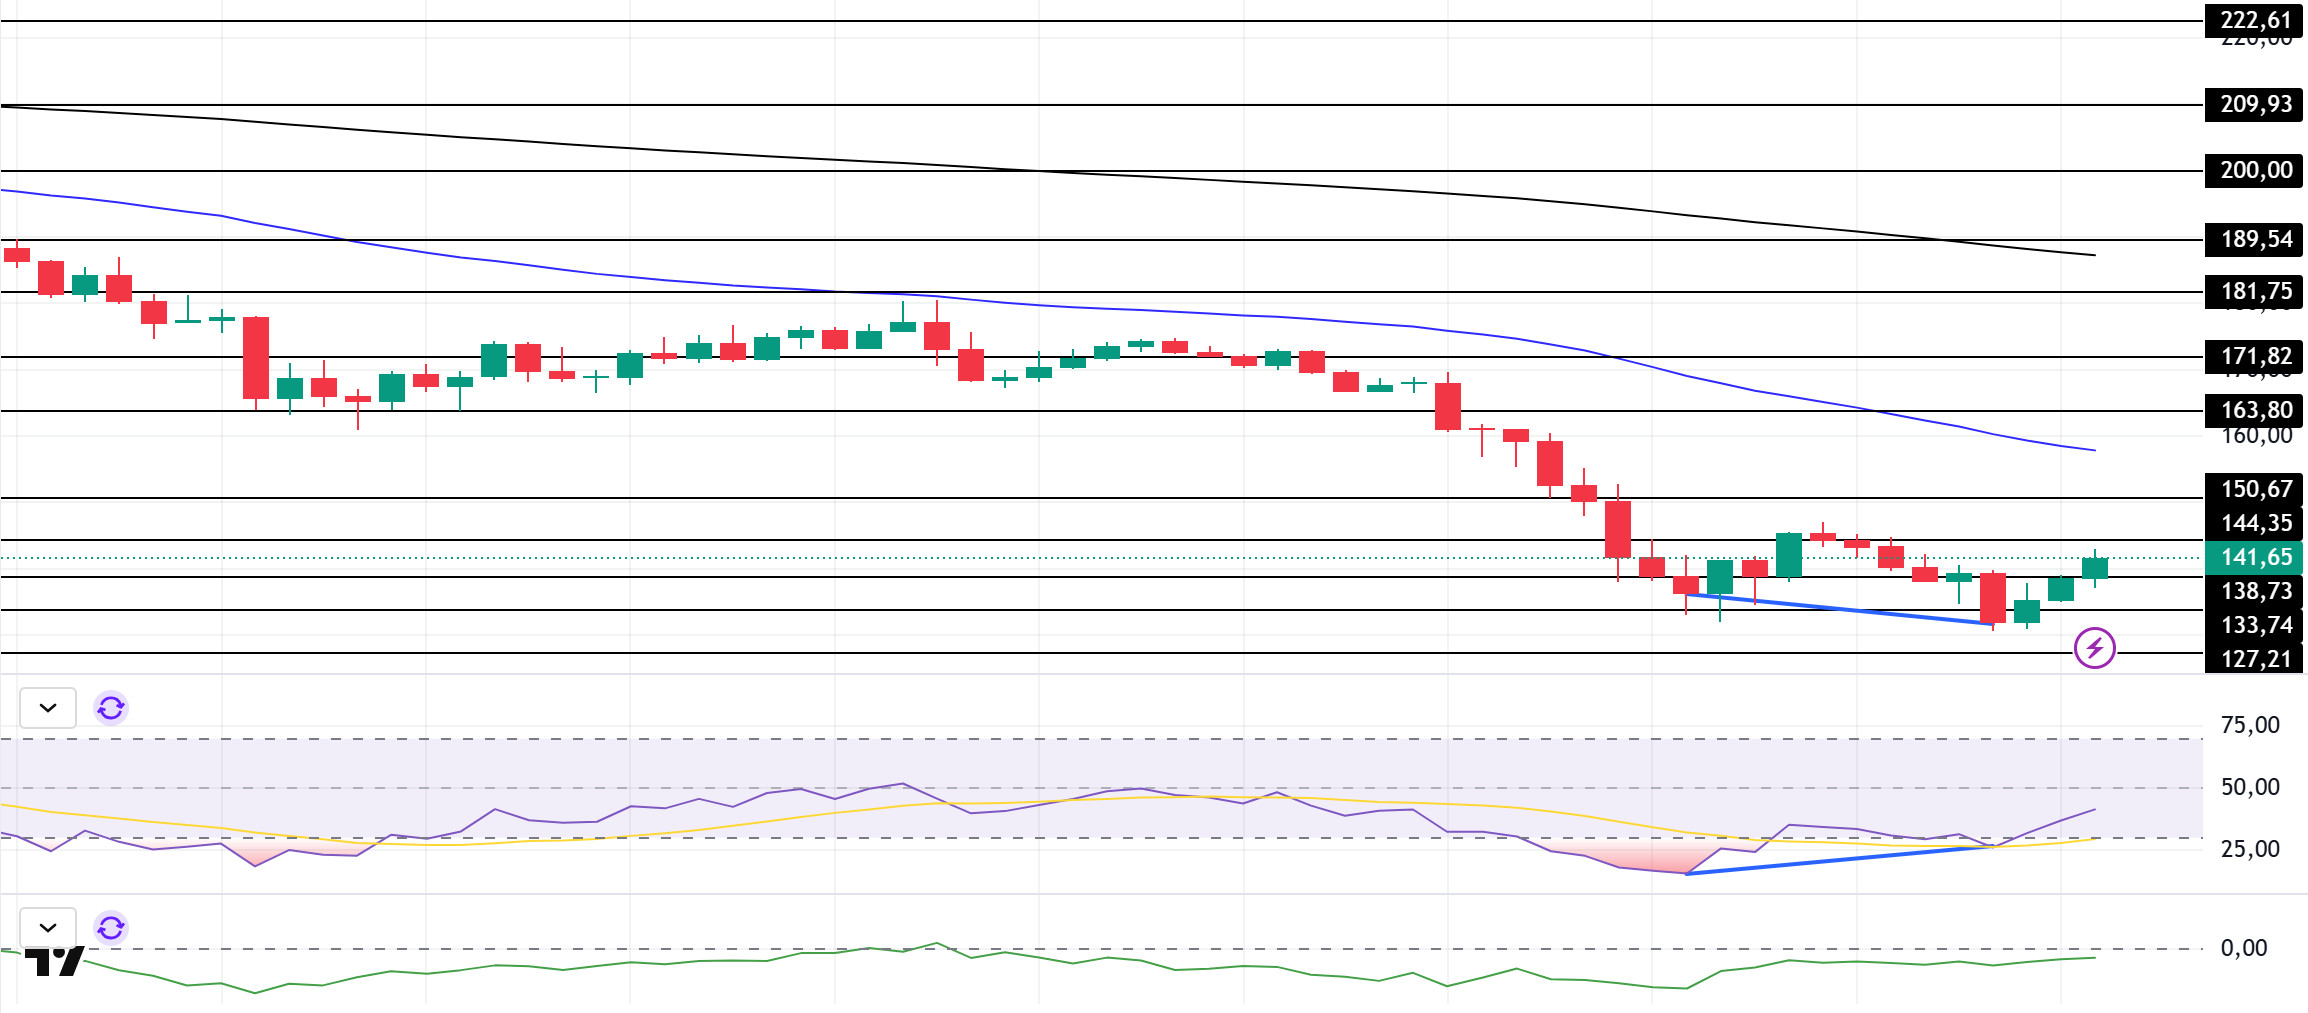
SOL has shown signs of recovery since our analysis yesterday. On the 4-hour timeframe, the 50 EMA (Blue Line) continues to be below the 200 EMA (Black Line). This could deepen the decline further in the medium term. At the same time, the price remained below both moving averages. However, the higher level between the two moving averages could push the asset higher. When we examine the Chaikin Money Flow (CMF)20 indicator, it is in the negative zone, close to the neutral level, but the decline in volume may make money outflows much more dominant. However, the Relative Strength Index (RSI)14 indicator has moved from the oversold zone to the mid-level of the negative zone. There is also a bullish mismatch. This could be a bullish start. The $ 163.80 level is a very strong resistance point in the rises driven by both the upcoming macroeconomic data and the news in the Solana ecosystem. If it breaks here, the rise may continue. In case of retracements for the opposite reasons or due to profit sales, the support level of $ 127.21 can be triggered again. If the price comes to these support levels, a potential bullish opportunity may arise if momentum increases.
Supports 138.73 – 133.74 – 127.21
Resistances 144.35 – 150.67 – 163.80
DOGE/USDT
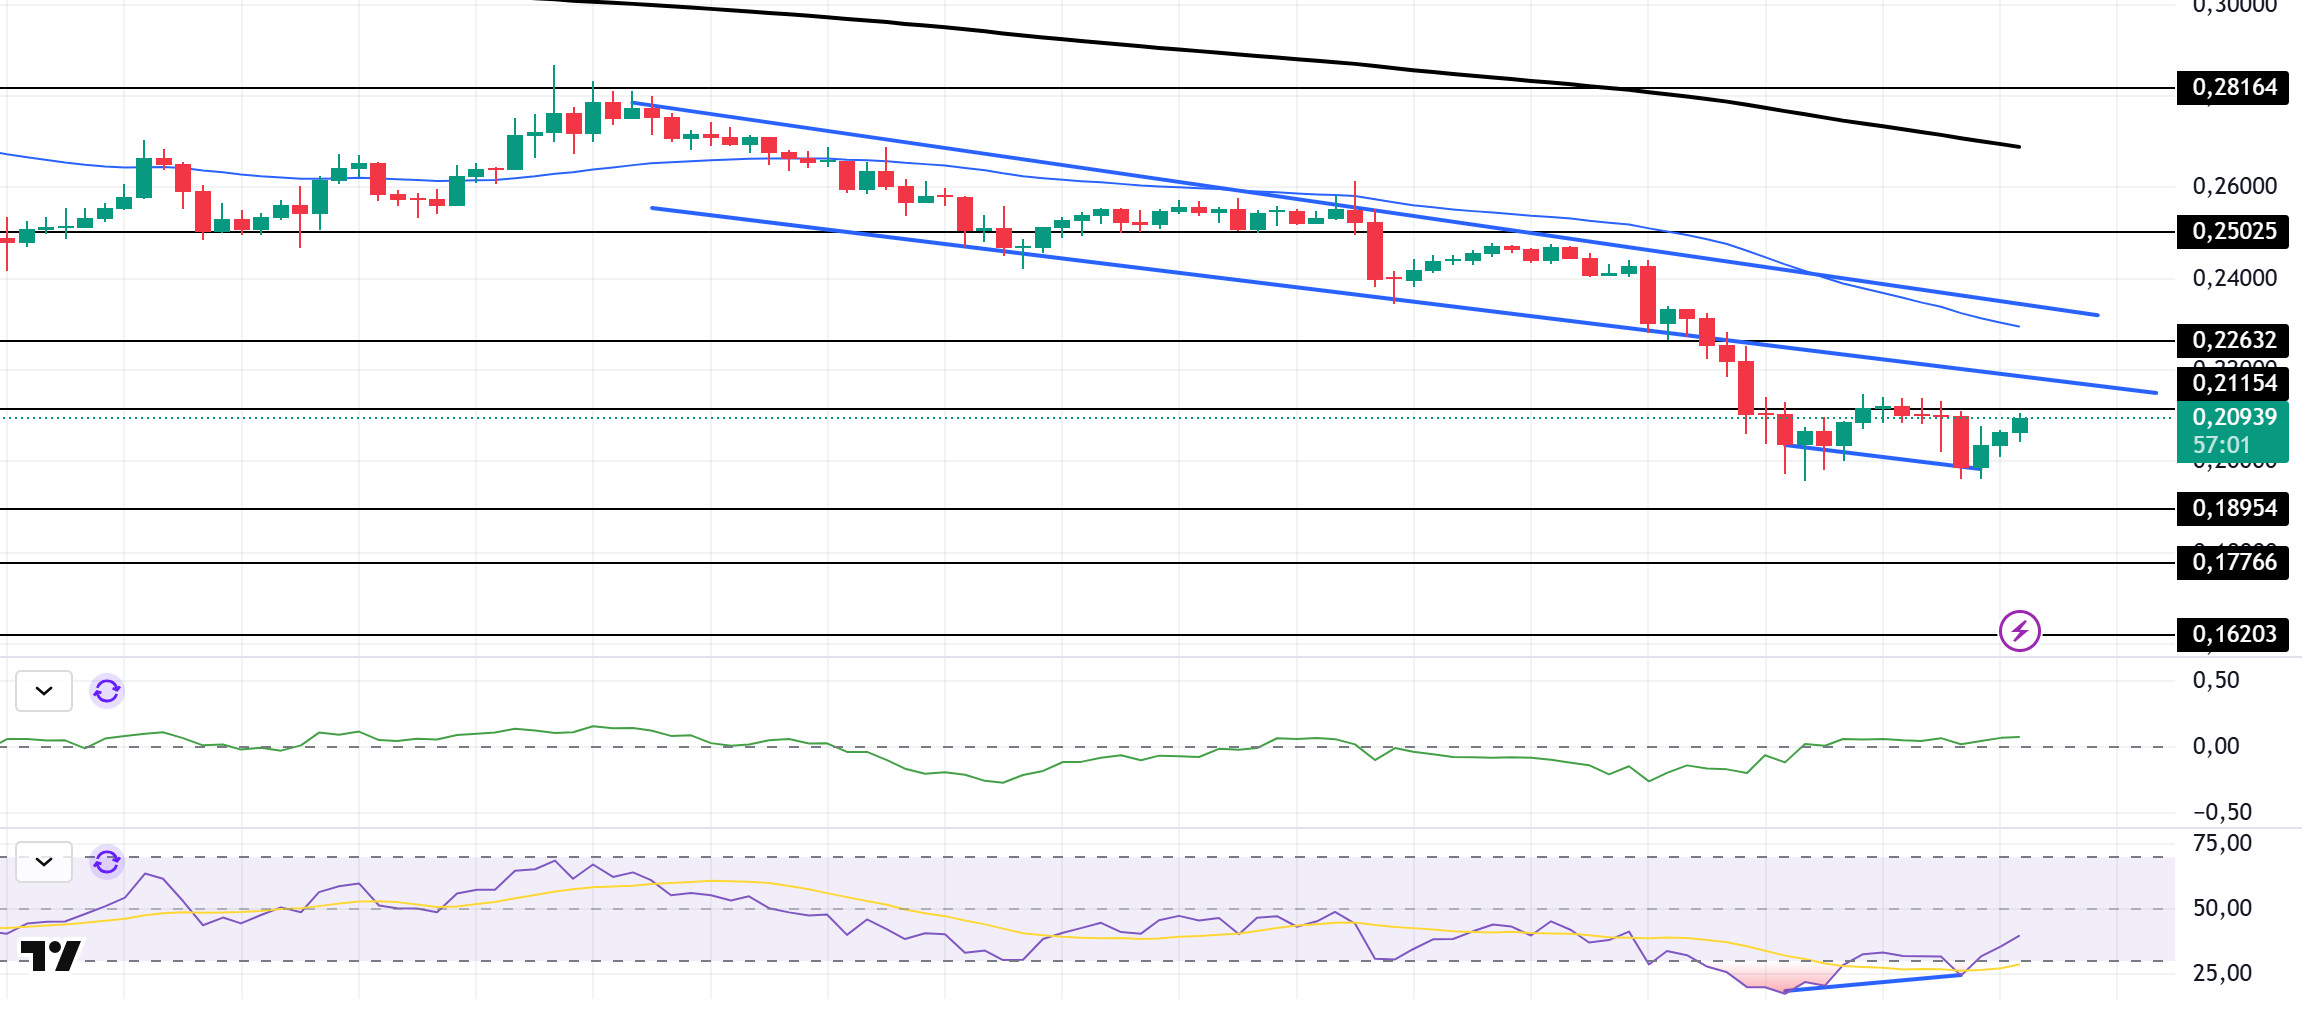
DOGE has shown signs of recovery since our analysis yesterday and may test the support level of the downtrend that started to form on February 15 as a resistance. On the 4-hour timeframe, the 50 EMA (Blue Line) is below the 200 EMA (Black Line). This could mean that the decline could deepen further in the medium term. However, the price is below two moving averages. However, the difference between the two moving averages as well as the difference between the price and the 50 EMA increases the probability that DOGE will rise. When we examine the Chaikin Money Flow (CMF)20 indicator, it is in the positive zone close to the neutral level, but the low volume shows us that there is not much money inflows. At the same time, the Relative Strength Index (RSI)14 is at the mid-level of the negative zone, but the bullish mismatch should be taken into account. These may lead to a rebound. The $0.22632 level stands out as a very strong resistance point in the rises due to political reasons, macroeconomic data and innovations in the DOGE coin. In case of possible pullbacks due to political, macroeconomic reasons or negativities in the ecosystem, the $0.18954 level, which is the base level of the trend, is an important support. If the price reaches these support levels, a potential bullish opportunity may arise if momentum increases.
Supports 0.18954 – 0.17766 – 0.16203
Resistances 0.21154 – 0.22632 – 0.25025
LEGAL NOTICE
The investment information, comments and recommendations contained herein do not constitute investment advice. Investment advisory services are provided individually by authorized institutions taking into account the risk and return preferences of individuals. The comments and recommendations contained herein are of a general nature. These recommendations may not be suitable for your financial situation and risk and return preferences. Therefore, making an investment decision based solely on the information contained herein may not produce results in line with your expectations.

