
TECHNICAL ANALYSIS
BTC/USDT
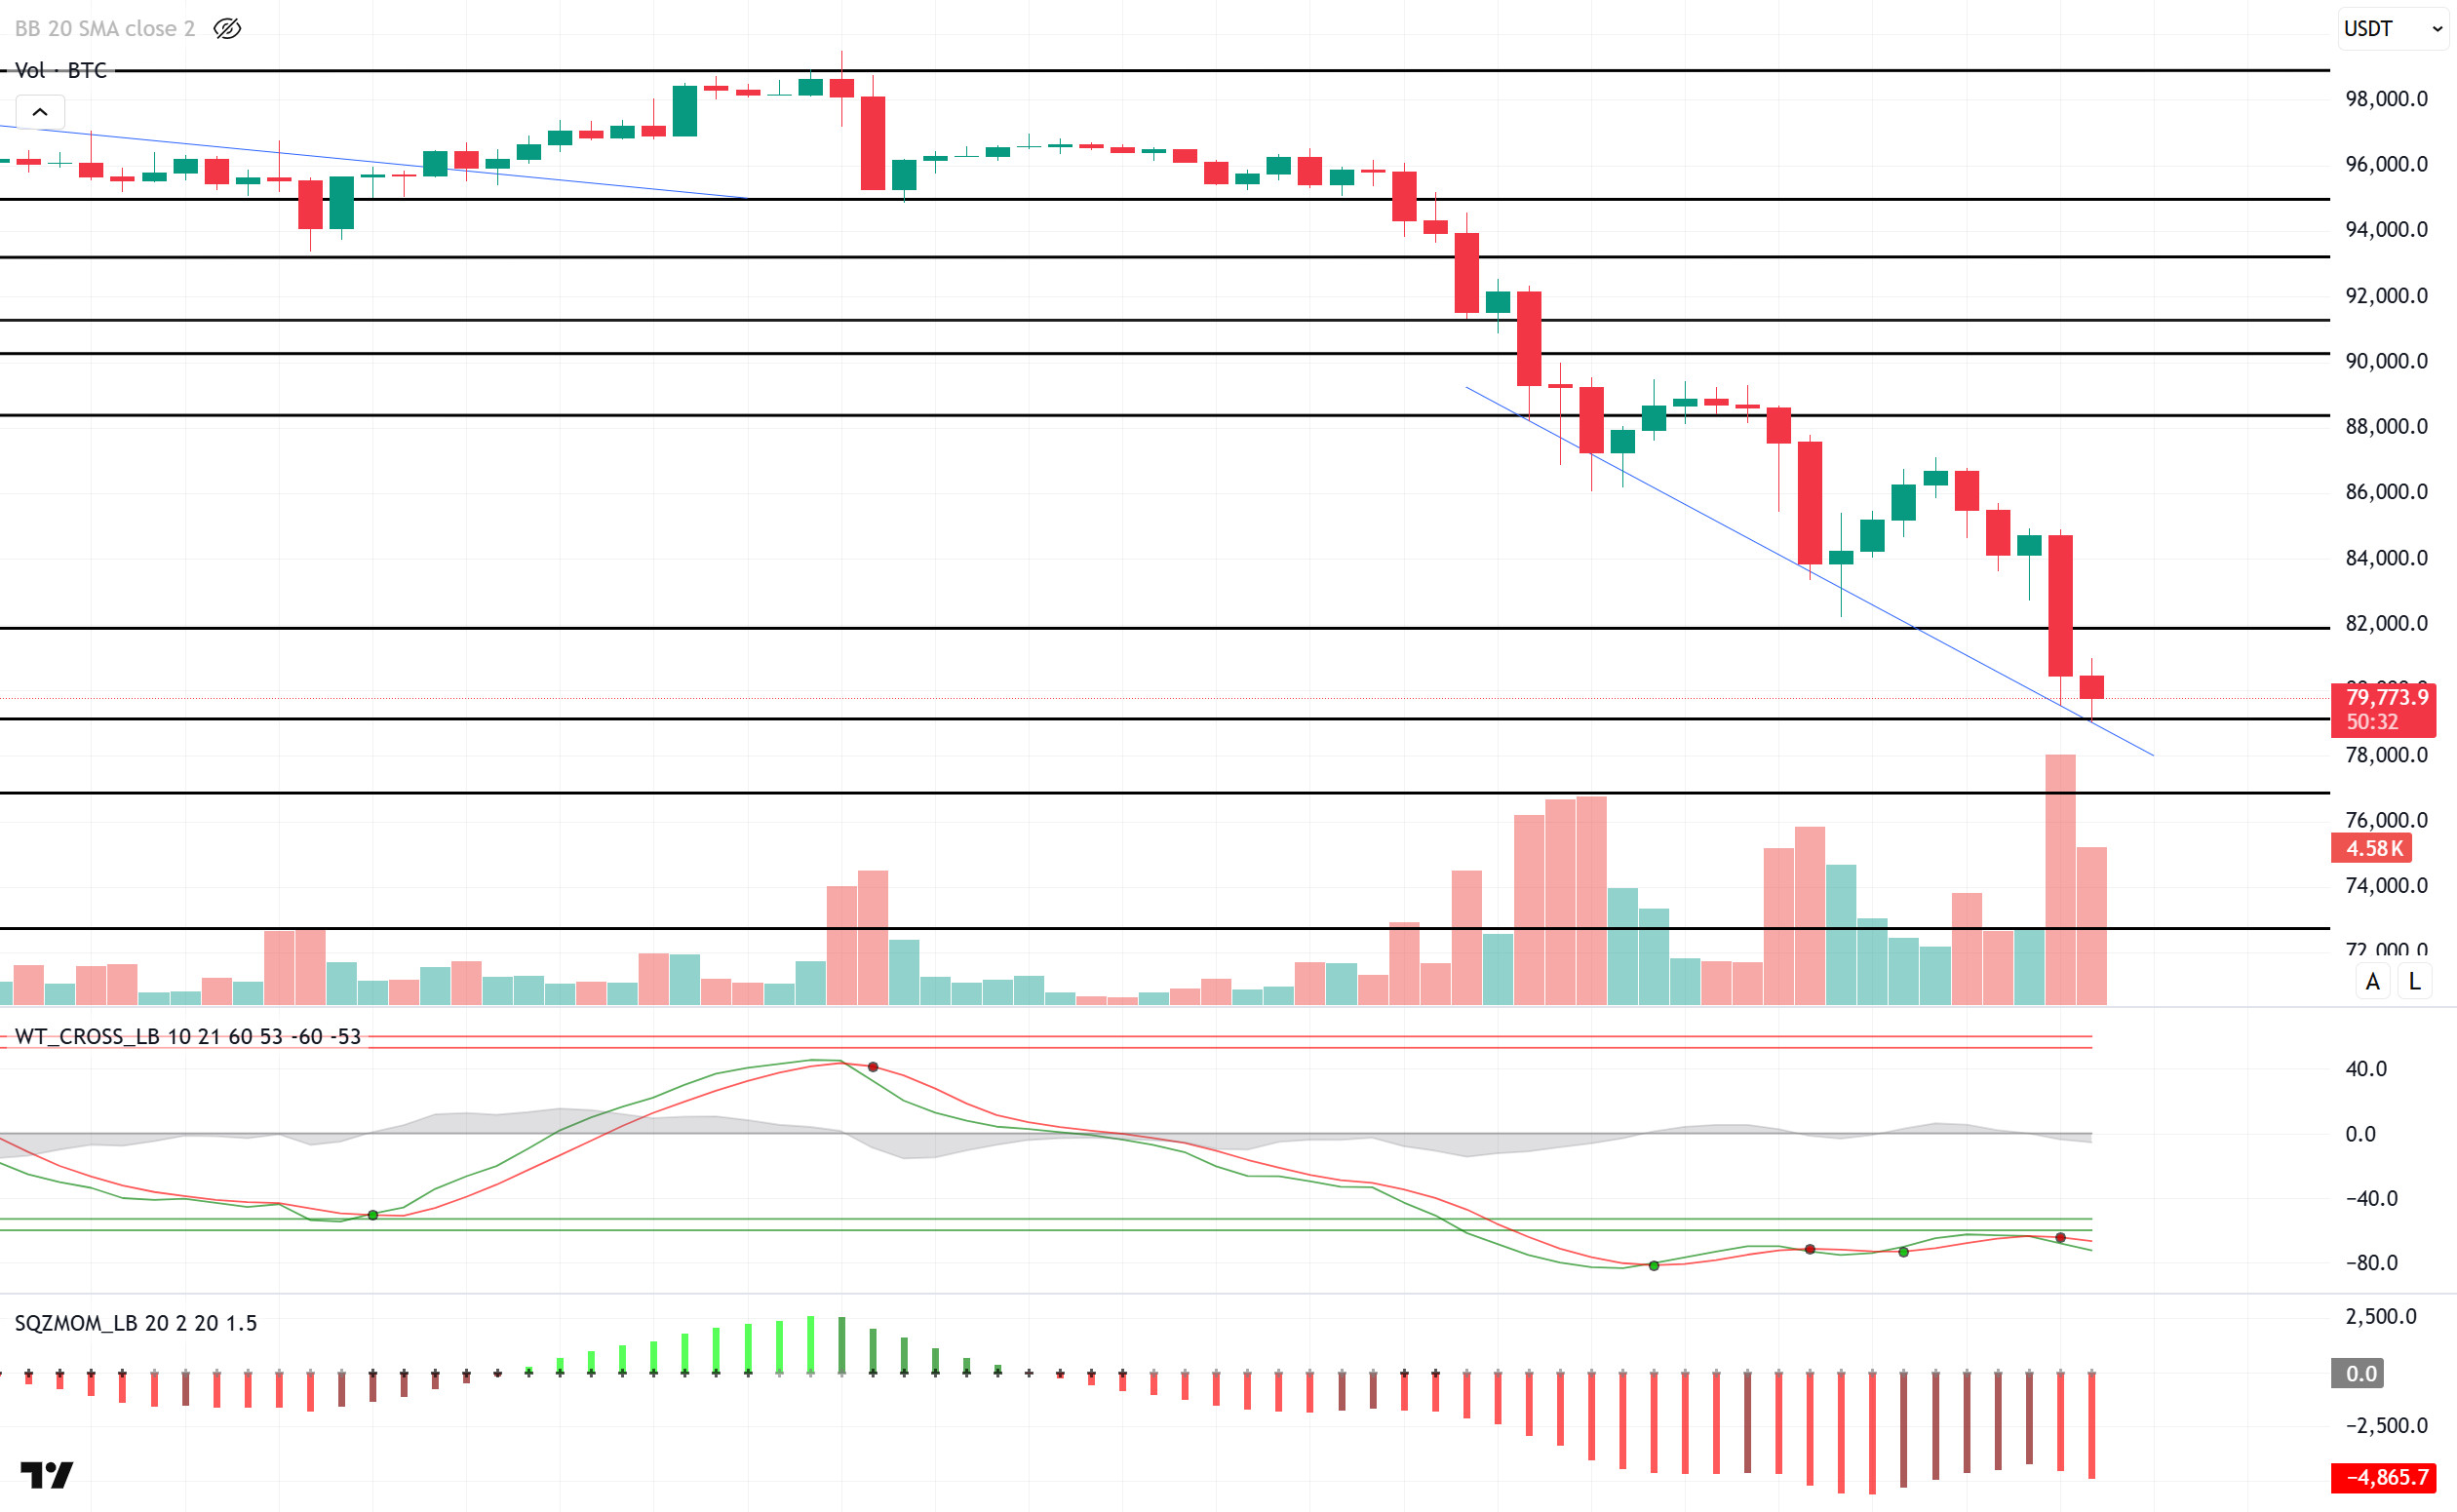
The rally that began after US President Donald Trump’s election victory on November 8 took Bitcoin as high as $109,071 on January 20. However, since this peak, Bitcoin has retreated by up to 27%. Increasing uncertainties in the market and the lack of a clear roadmap for Trump’s policies triggered a flight from risk assets, causing Bitcoin to fall as low as $79,100 this morning.
Looking at the technical outlook, with the loss of the 85,000-support level, BTC fell into the gap zone and tested the 79,100 level. In BTC, which is currently trading at 79,600, it is noteworthy that selling pressure continues with high volatility. When technical oscillators are analyzed, it is observed that BTC, which continues to remain in the oversold zone, maintains its sell signal and momentum indicators have weakened well. This shows that the market is still not giving a clear recovery signal and the current downtrend is dominant. In case the decline deepens, the 76,800 level stands out as the next important support point. If BTC price falls to this level, the market’s reaction will be critical. On the other hand, if the bearish move moves into the correction phase, the 82,000 level, which previously worked as support, will be followed as the first target.
Supports 79,000 – 76,800 – 74,000
Resistances 82,000 – 85,000 – 87,000
ETH/USDT
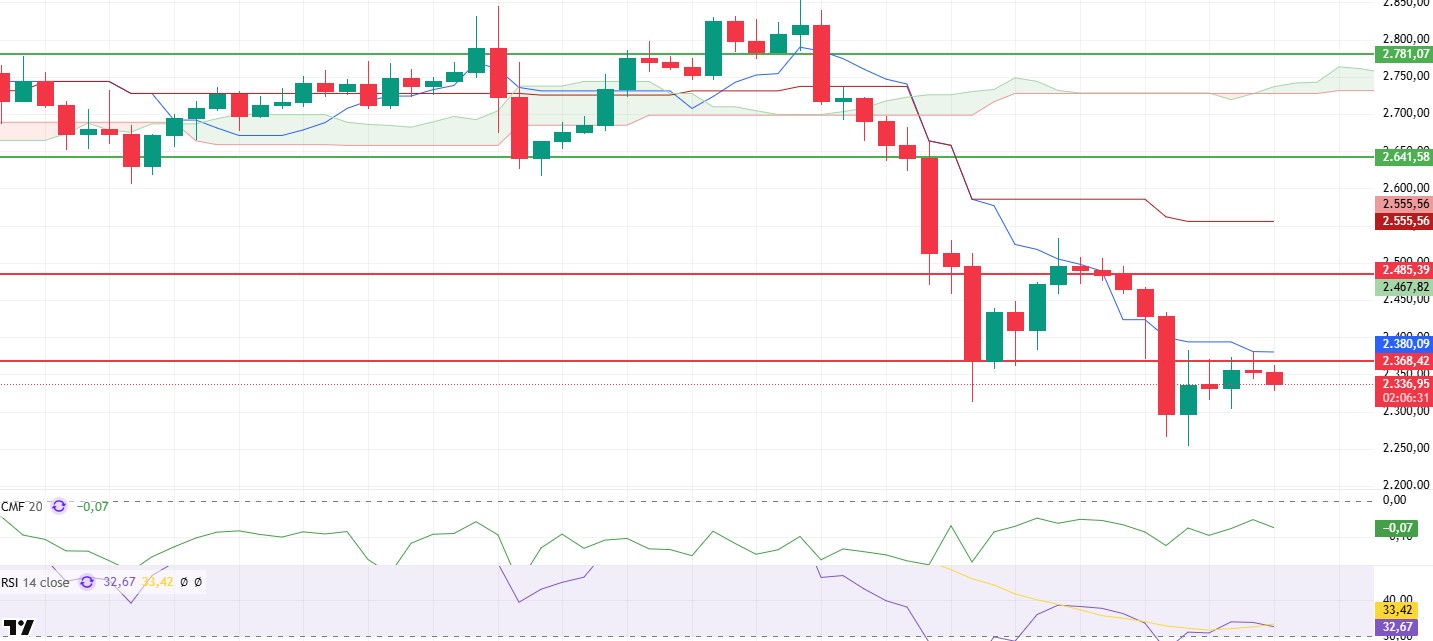
As mentioned in last night’s analysis, ETH continued its decline by facing selling pressure after failing to break the $2,380 level and fell below the $2,131 support level. With this price action, it filled the needle it created on February 3 by falling to the level of $ 2,125. The price reaction in this region will be a decisive factor in terms of the direction of the current trend.
Technical indicators point to weakening market dynamics. The Relative Strength Index (RSI) continues its downward movement, moving sharply into oversold territory, indicating that selling pressure continues. Momentum indicator also supports that the market remains weak. On the other hand, the Chaikin Money Flow (CMF) indicator is showing a strong outlook, hovering around -0.11. A positive divergence is observed in the CMF indicator, which could trigger a short-term rebound if Ethereum regains above the $2,131 level.
Currently, ETH is trading at one of the most critical support levels and is likely to see a reaction from this area. However, the risk of deepening the downtrend will increase if it persists below the $2,131 level. Whether the price can regain this level will be a decisive factor for the short-term direction.
Supports 2,131 – 1,907 – 1,755
Resistances 2,368 – 2,485 – 2,641
XRP/USDT
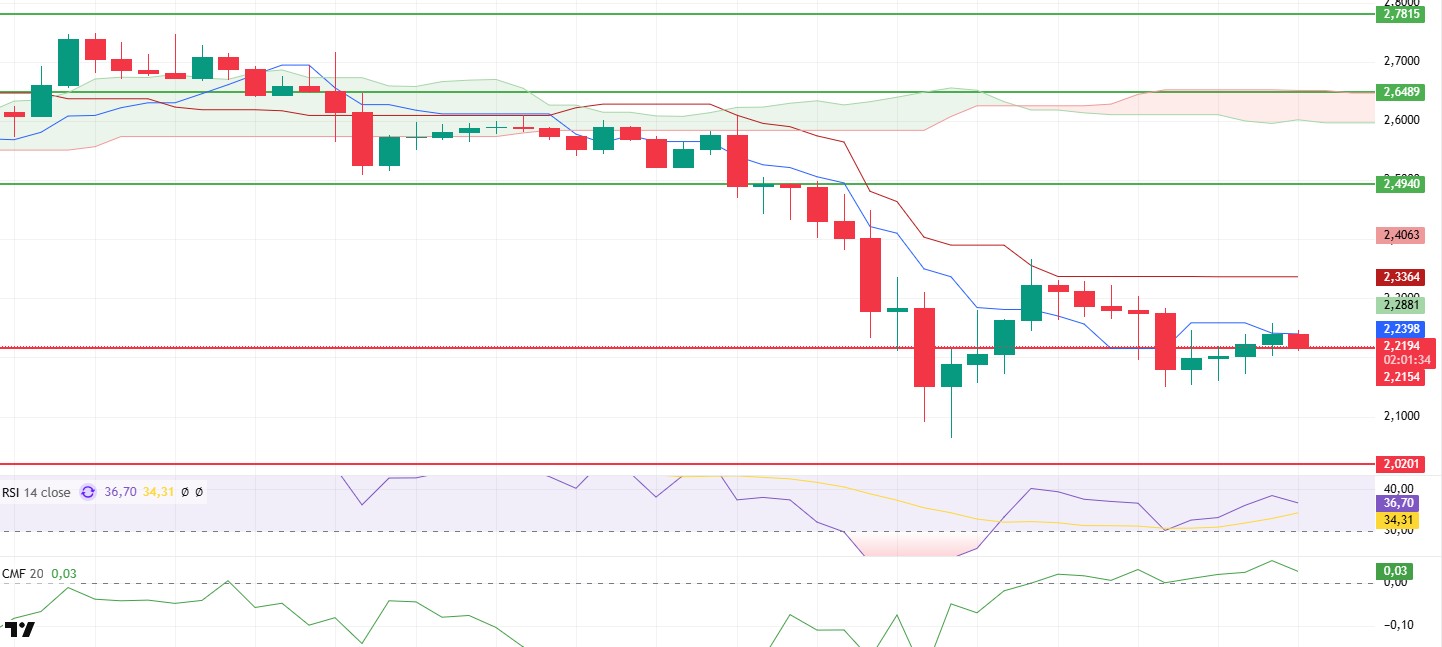
XRP continued its weakening trend with closures below the $2.21 level and fell sharply to the $2.02 support level with increasing selling pressure during the night hours. As of now, XRP’s technical indicators, which are trying to hold on to this critical level, have started to signal a possible change in price movement.
The Relative Strength Index (RSI) indicator is showing a positive divergence with price action, even though it has fallen back to oversold territory. This, coupled with the fact that XRP is at a strong support level, suggests that short-term reaction buying could be on the cards. Similarly, the Chaikin Money Flow (CMF) indicator, which measures the market’s liquidity and capital flows, remains in positive territory, indicating that capital inflows are still strong.
Overall, the fact that XRP’s current level is a strong support point and technical indicators give positive signals increases the possibility of a short-term recovery. However, persistent closes below the $2.02 level may cause the weakness to deepen and the price to continue its downward movement. Therefore, XRP’s price reaction at this critical support level will be decisive for its direction in the coming period.
Supports 2.0201 – 1.8303 – 1.6309
Resistances 2.2154 – 2.4940 – 2.6489
SOL/USDT
Solana’s TVL is down to $6.85 billion at the time of this writing. On the other hand, PumpFun, the meme launchpad of the ecosystem, has stopped meme coin production due to extreme volatility in the market.
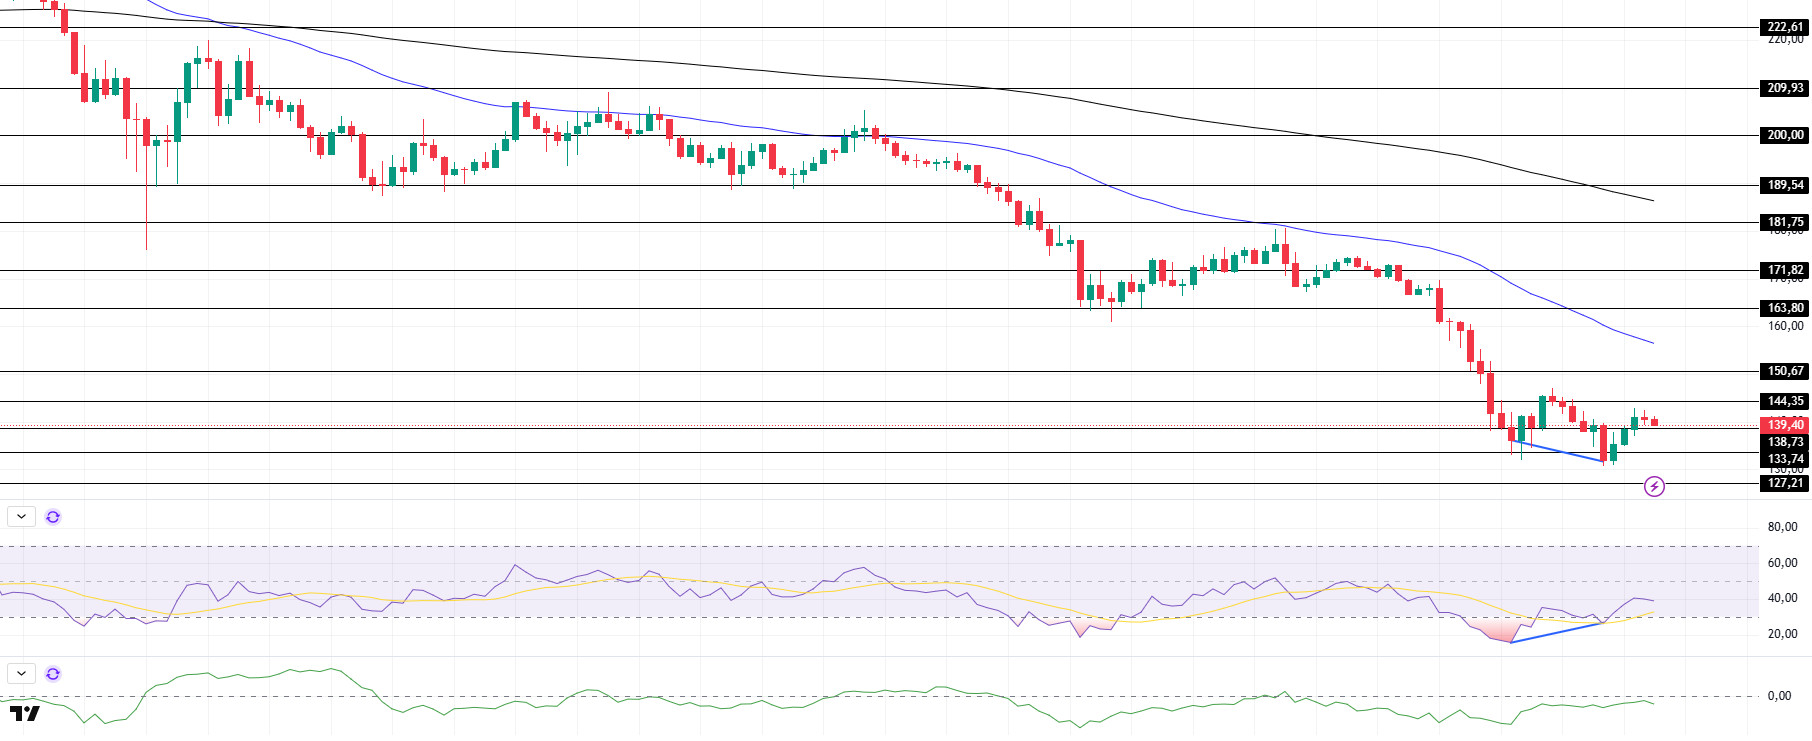
SOL continued to fall in step with the market, continuing the downtrend that started on February 14th. On the 4-hour timeframe, the 50 EMA (Blue Line) continues to be below the 200 EMA (Black Line). This could deepen the decline further in the medium term. At the same time, the price remained below both moving averages. However, the larger difference between the two moving averages could push the asset higher. When we analyze the Chaikin Money Flow (CMF)20 indicator, it is in the negative zone, which is close to the neutral level, but the decline in volume may further increase money outflows. However, the Relative Strength Index (RSI)14 indicator is retesting the oversold zone. There is also a bullish mismatch. This could be a bullish start. The $ 163.80 level is a very strong resistance point in the rises driven by both the upcoming macroeconomic data and the news in the Solana ecosystem. If it breaks here, the rise may continue. In case of retracements for the opposite reasons or due to profit sales, the support level of $ 120.24 can be triggered again. If the price comes to these support levels, a potential bullish opportunity may arise if momentum increases.
Supports 127.21 – 120.24 – 110.59
Resistances 133.74 – 138.73 – 144.35
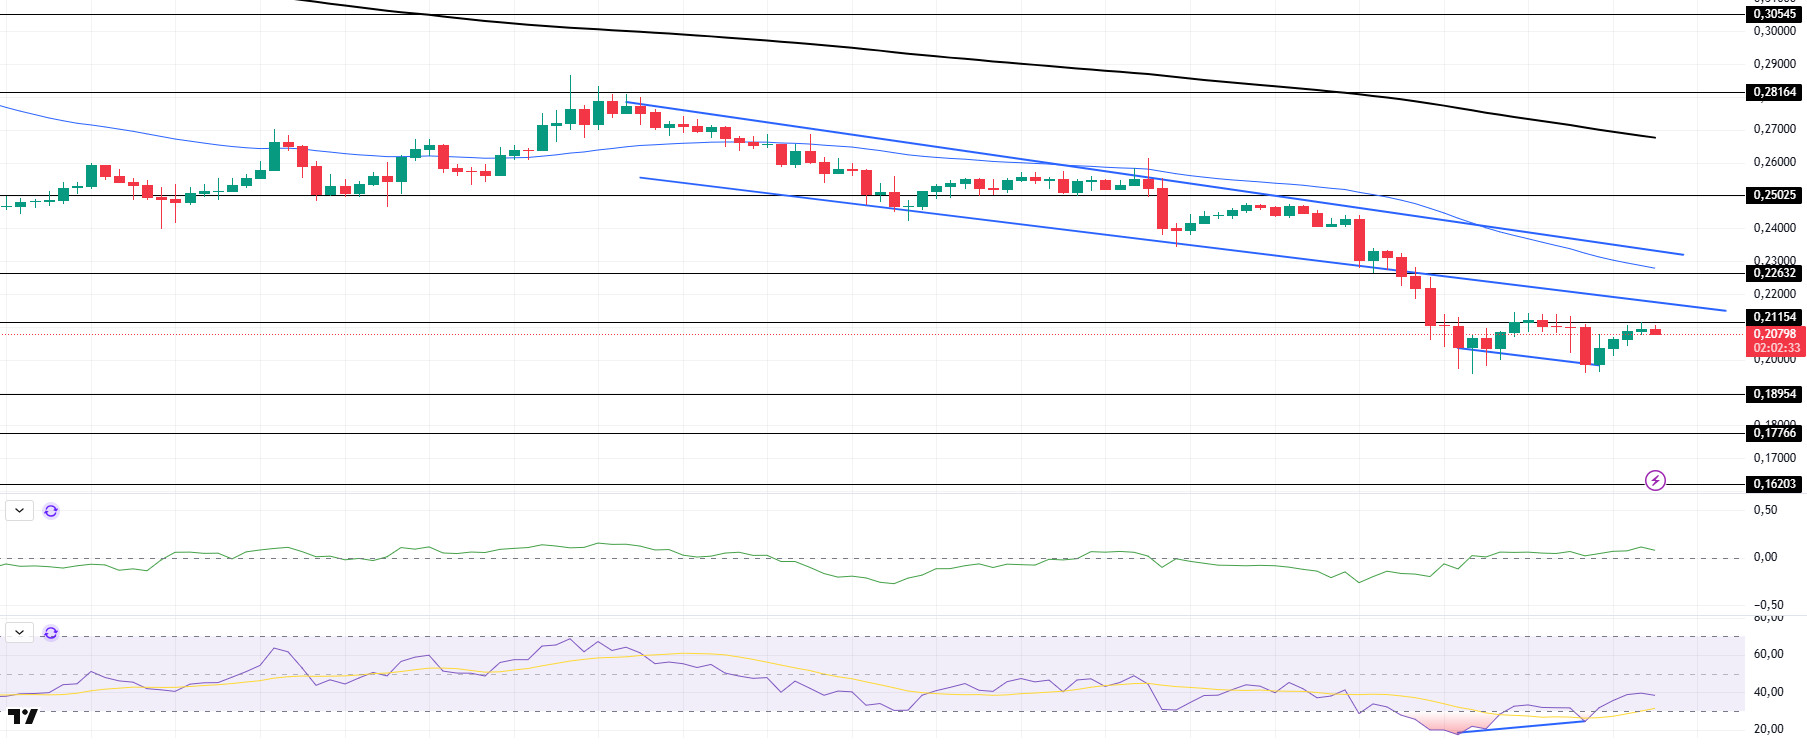
DOGE/USDT
DOGE’s total futures volume fell to $992 million from $58.2 billion in November. Dogecoin’s network activity decreased significantly. Open Interest data fell from $5.25 billion to $1.79 billion.
DOGE has experienced deep retracements since our analysis yesterday and tested the 0.21154 resistance level twice. However, it failed to break it and continued its decline. On the 4-hour timeframe, the 50 EMA (Blue Line) is below the 200 EMA (Black Line). This could mean that the decline could deepen further in the medium term. However, the price is hovering below two moving averages. However, the difference between the two moving averages as well as the difference between the price and the 50 EMA increases the probability that DOGE will rise. When we analyze the Chaikin Money Flow (CMF)20 indicator, it is in the positive zone near the neutral level. However, the fact that the volume is negative shows us the possibility that money inflows may decrease. On the other hand, the Relative Strength Index (RSI)14 is again at the oversold level, but the bullish mismatch should be taken into account. These may lead to a recovery. The $0.22632 level stands out as a very strong resistance point in the rises due to political reasons, macroeconomic data and innovations in the DOGE coin. In case of possible pullbacks due to political, macroeconomic reasons or negativities in the ecosystem, the $0.16203 level, which is the base level of the trend, is an important support. If the price reaches these support levels, a potential bullish opportunity may arise if momentum increases.
Supports 0.17766 – 0.16203 – 0.14952
Resistances 0.18954 – 0.21154 – 0.22632
Legal Notice
The investment information, comments and recommendations contained herein do not constitute investment advice. Investment advisory services are provided individually by authorized institutions taking into account the risk and return preferences of individuals. The comments and recommendations contained herein are of a general nature. These recommendations may not be suitable for your financial situation and risk and return preferences. Therefore, making an investment decision based solely on the information contained herein may not produce results in line with your expectations.

