
Fear & Greed Index
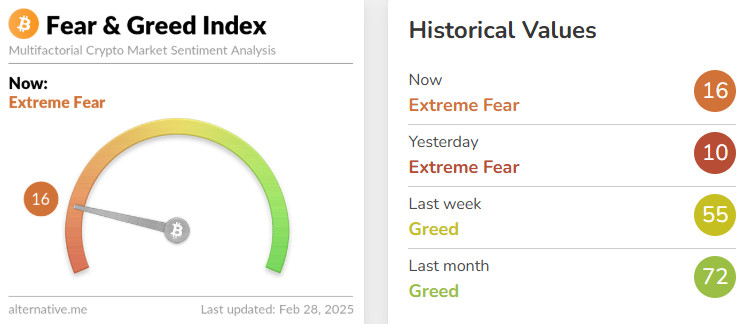
Source: Alternative
This week, the Fear & Greed Index fell sharply from last week’s moderate optimism to extreme fear. US President Donald Trump’s announcement that he will impose 25% tariffs on imports from Mexico and Canada and 10% tariffs on goods from China on March 4 increased uncertainty in global trade and negatively affected investors’ risk perception. Although the US GDP growth of 2.3% was in line with expectations, the unexpected increase in jobless claims points to economic fragility. Moreover, the crypto market saw significant outflows from Bitcoin and Ethereum ETFs. This shows that investors tend to be risk averse in the current uncertain environment. These developments have shaken investors’ confidence in the markets, causing the Fear & Greed Index to fall to the extreme fear level.
Fund Flow
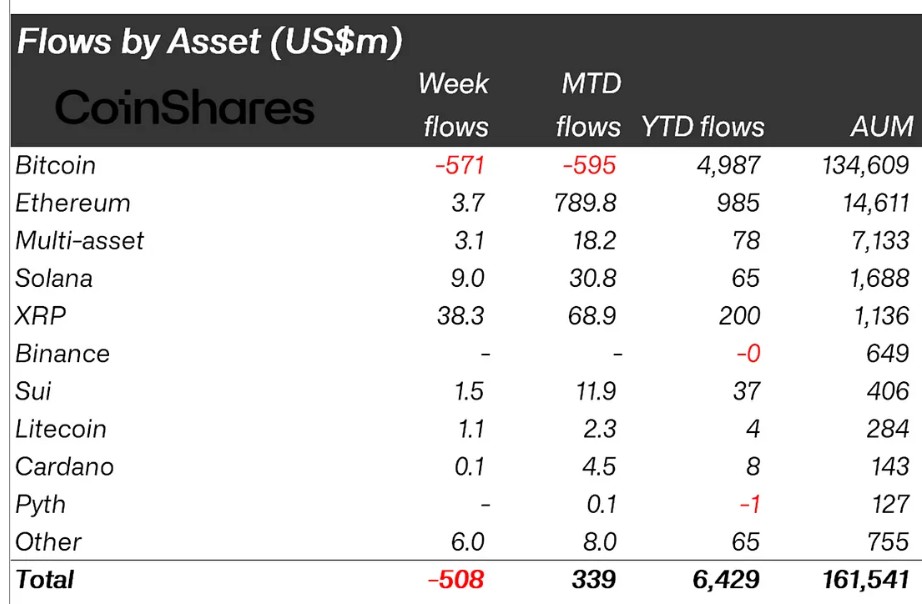
Source: CoinShares
Overview: Digital asset investment products saw outflows totaling $508 million as investors remained cautious following the inauguration of the US President and the resulting uncertainty over trade tariffs, inflation and monetary policy.
Fund Inputs:
- Ethereum (ETH): Ethereum inflows declined amid the negative sentiment created by the $1.5 billion ETH attack on the Bybit exchange. This week saw 3.7 million $ inflows.
- Multi-asset: Digital mutual funds saw very few inflows this week, with outflows outpacing outflows from Blackrock ETFs. There were 3.1 million$ inflows this week.
- Ripple (XRP): Investors reflected their hopes that the SEC will drop its case in prices. Ripple saw an entry of $38.3 million.
- Solana (SOL): PumpFun, the meme launchpad of the ecosystem, has also stopped meme coin production due to extreme volatility in the market. Solana saw a total inflow of $9.0 million with this news.
- SUI: Sui saw a $772.5B increase in Market Cap compared to other altcoins. It saw $1.5 million inflows. Fund inflows this week were $1.5 million.
- Litecoin (LTC): Litecoin has made a grand entrance into the Web3 space. LTC domains are making a new platform for convenient crypto payments. With this news, there was an entry of $ 1.1 million.
- Cardano (ADA): Grayscale filed for an exchange-traded fund (ETF) focused on Cardano (ADA). This application accelerated ADA’s inflows. It saw an inflow of $0.1 million in the process.
- Other: The SEC plans to withdraw its enforcement action against MetaMask, a wallet tool owned by ConsenSys. If the case is approved, inflows to altcoins may increase. It saw $6.0 million in inflows.
Fund Outflows
Bitcoin (BTC): Bitcoin saw outflows of $571 million this week amid uncertainty over the Trump administration’s tariffs and crypto regulations, as well as a decline in global investor confidence.
Total MarketCap
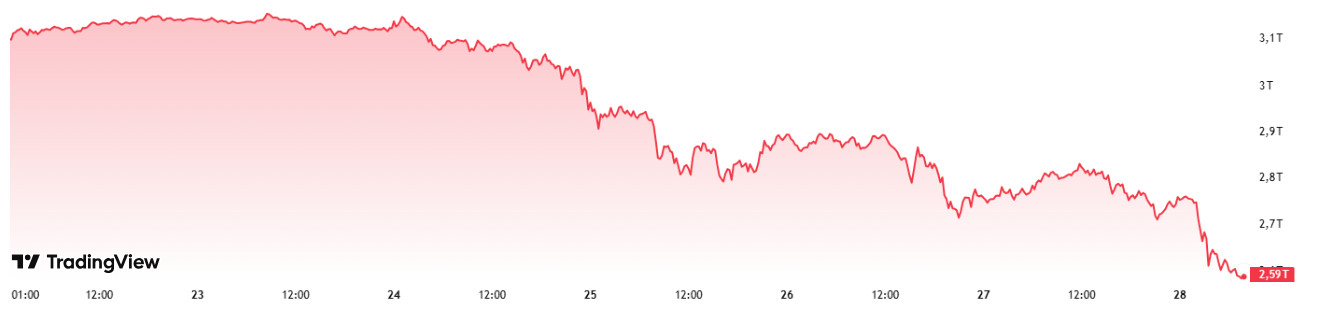
Source: Tradingview
Last Week Market Capitalization : 3.14 Trillion Dollars
Market Capitalization This Week: 2.59 Trillion Dollars
After closing at $3.14 trillion last week, the cryptocurrency market fell by 17.22% this week to $2.59 trillion. In the process, about $540.78 billion was wiped off the market capitalization, returning to the levels found in March 2024. This level also coincides with the last 50-week moving average. In addition, this week was the biggest one-week decline since November 7, 2022.
Total 2
While Total 2 started the week with a market capitalization of $ 1.23 trillion, it continues its course at the level of $ 1 trillion, showing a decrease of 16.92% with an outflow of approximately $ 208.22 billion during the week. Thus, altcoins, which make up 39.22% of the cryptocurrency market, accounted for 38.5% of the total loss this week.
Total 3
Total 3 experienced a 13.94% decline with a loss of $123.85 billion. Total 3, which accounts for 29.41% of the crypto market, only accounts for 22.90% of the market loss this week. This shows that the decline in Bitcoin and Ethereum was more severe than in altcoins.
The bearish movements in Bitcoin have severely affected all altcoins, especially Ethereum. The crypto market continues its downward movement, especially with consecutive record outflows in Spot Bitcoin and Ethereum ETFs.
Bitcoin Dominance
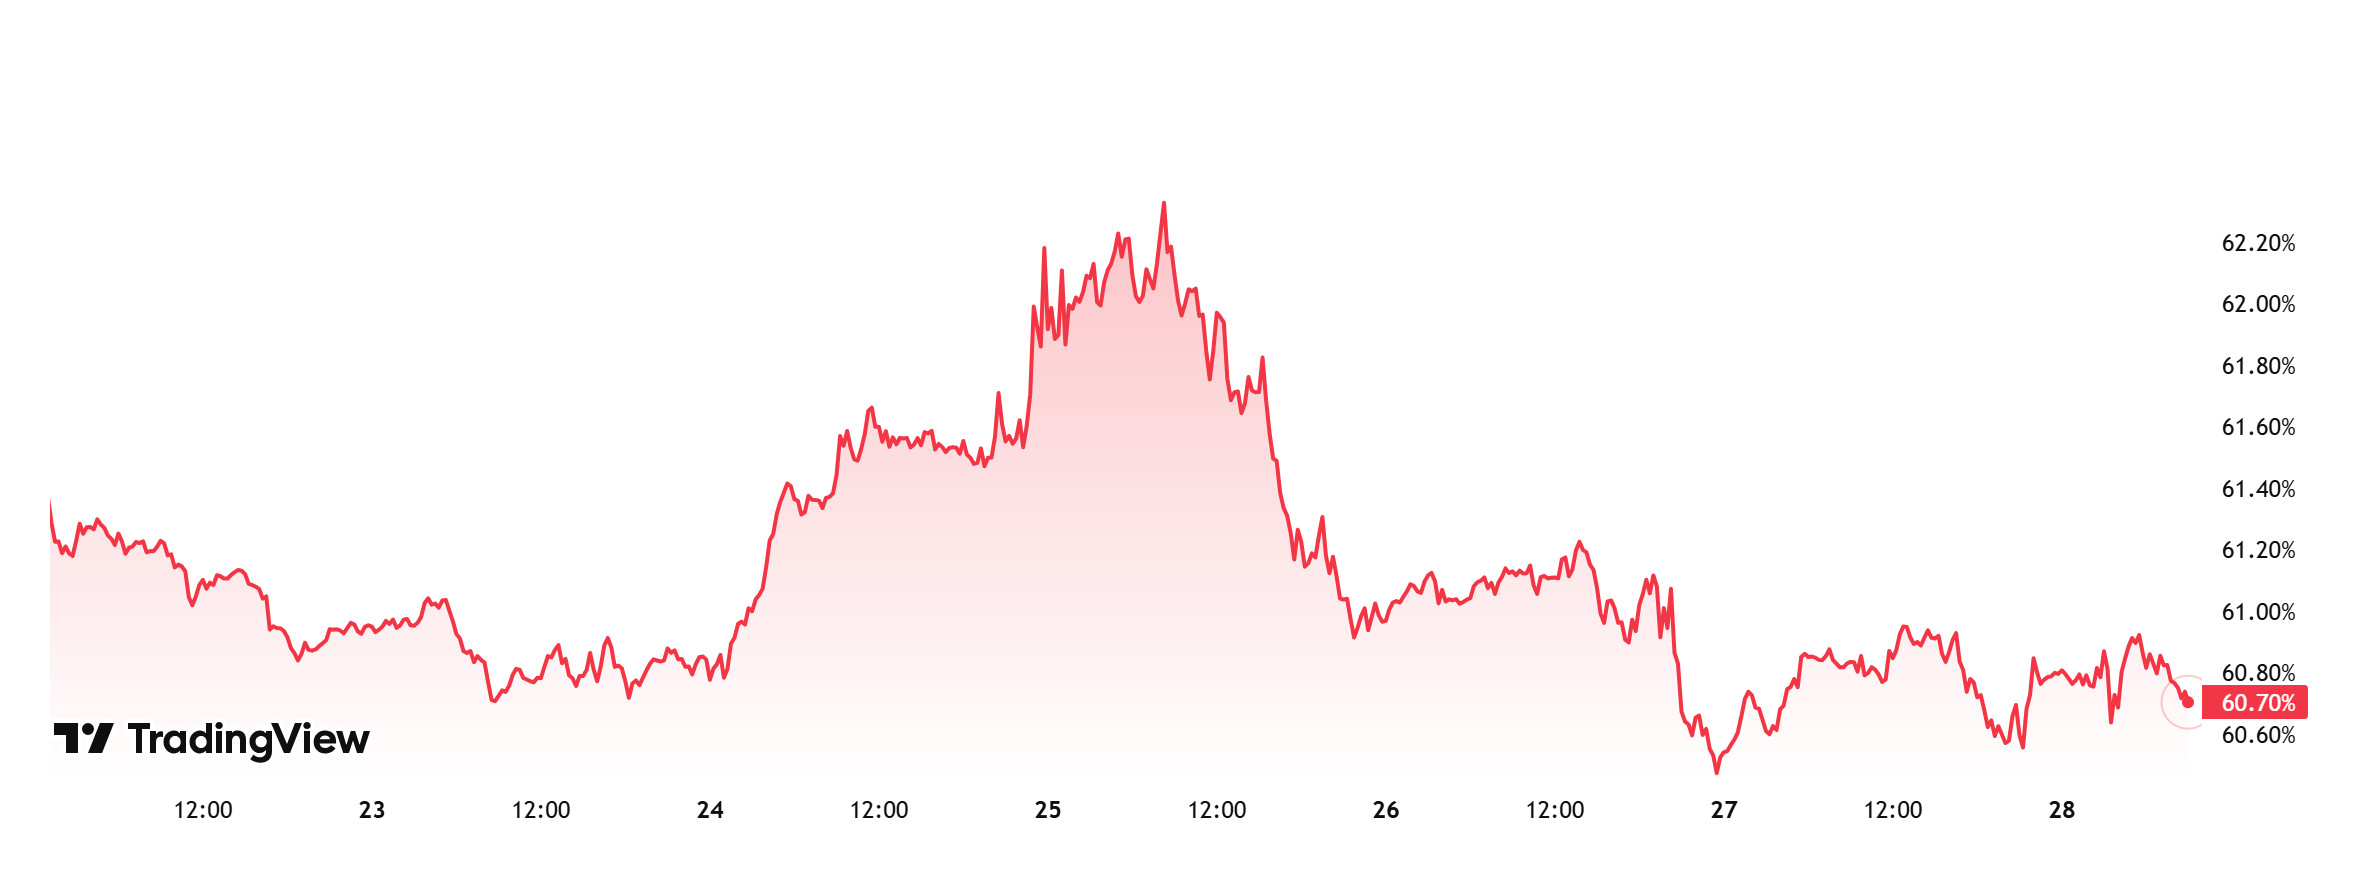
Source: Tradingview
Bitcoin Dominance
BTC dominance, which started the week at 60.85%, rose to 62.14% and is currently at 60.70%.
Applications for unemployment benefits, non-farm payrolls and unemployment rate data will be released in the US next week. In particular, if the non-farm payrolls data is announced in line with or slightly below expectations, it may be welcomed by the market. In this process, US President Trump’s positive statements about tariffs or Bitcoin may be positive for the market and may greatly increase the interest of institutional and ETF investors. Otherwise, the selling pressure in the market may continue. Either way, we can expect BTC dominance to rise to 62% – 63% in the new week.
Ethereum Dominance
Source: Tradingview
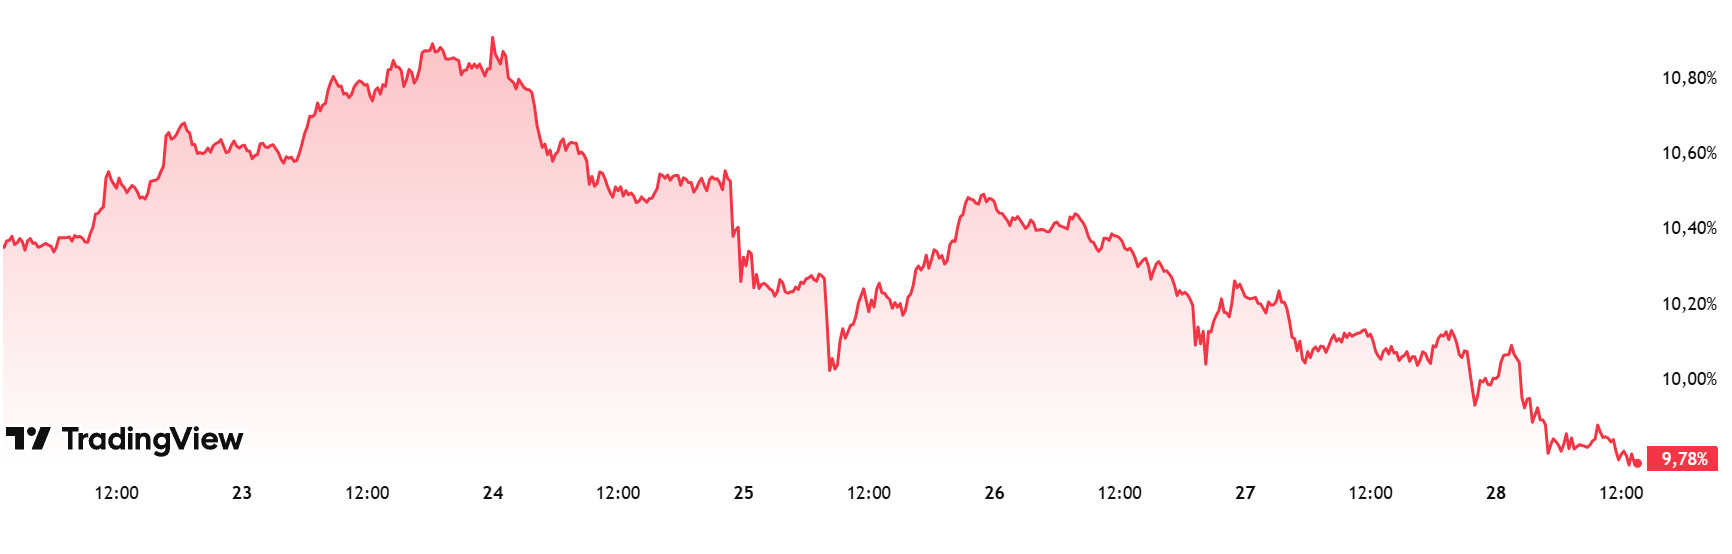
Last Week’s Level: 10.84%
This Week’s Level: 9.78%
Ethereum dominance continued its retreat from 12.90% in January 2025 until the first week of February, and the negative trend that maintained its effect during this period caused the dominance to decline to 9.23%. These levels are of particular importance as they were last seen in May 2020. Ethereum dominance, which has been recovering from these levels, has gained positive momentum in the last two weeks, rising to 10.88%. However, the dominance, which was suppressed at these levels, continued its negative outlook on a weekly basis, with a total net outflow of -302.5 million dollars from Spot Ethereum ETFs between February 21-27, 2025.
On the other hand, in the same period, Bitcoin dominance showed a reverse trend, while Ethereum dominance showed a positive trend.
Accordingly, Ethereum dominance ended last week at 10.84%, while it is hovering at 9.78% as of the current week.
Bitcoin Spot ETF
Source: SosoValue
Featured Developments:
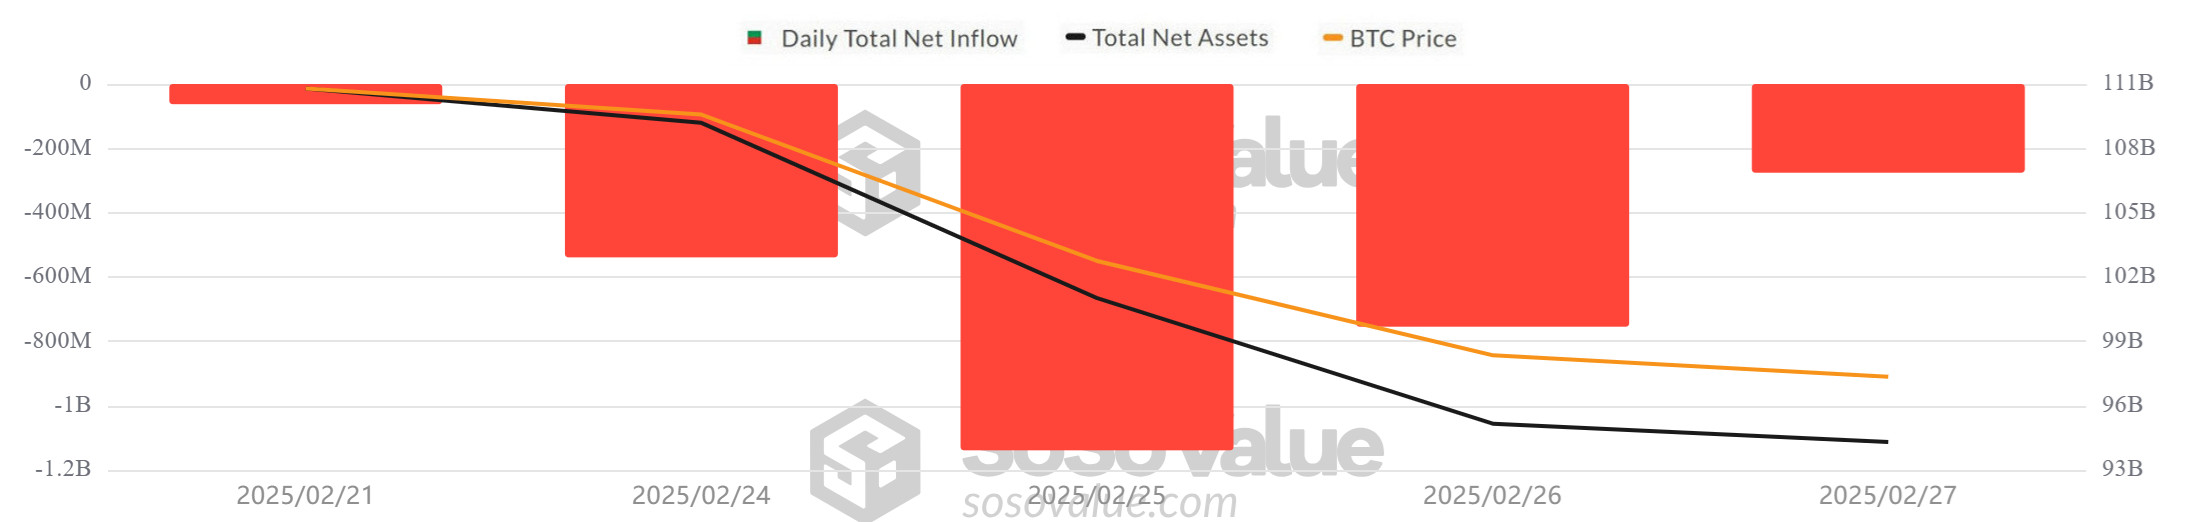
- Negative Net Inflow Series Continued: Between February 21-27, 2025, the negative net inflow streak extended to 8 days. Spot Bitcoin ETFs saw net outflows totaling $2.771 billion. BlackRock IBIT ETF saw net outflows of $908.5 million and Fidelity FBTC ETF saw net outflows of $757.2 million. All spot BTC ETFs saw net outflows.
- Bitcoin Price: Opening at $98,252 on February 21, 2025, Bitcoin fell 13.83% on the week to close at $84,668 on February 27. On February 26, it fell 5.00% to $84,208 and remained under pressure with ETF outflows.
- Cumulative Net Inflows: Spot Bitcoin ETFs saw a total net outflow of $2.771 billion between February 21-27, 2025, while cumulative net inflows fell to $36.86 billion by the end of the 283rd trading day.
| DATE | COIN | PRICE OPEN | PRICE CLOSE | CHANGE % | ETF Flow (mil$) |
|---|---|---|---|---|---|
| 21-Feb-25 | BTC | 98,252 | 96,127 | -2.16% | -62.9 |
| 24-Feb-25 | BTC | 96,218 | 91,514 | -4.89% | -539 |
| 25-Feb-25 | BTC | 91,514 | 88,639 | -3.14% | -1138.9 |
| 26-Feb-25 | BTC | 88,639 | 84,208 | -5.00% | -754.6 |
| 27-Feb-25 | BTC | 84,208 | 84,668 | 0.55% | -275.9 |
| Total for 21 – 27 Feb 25 | -13.83% | -2771.3 | |||
General Evaluation:
Between February 21 and 27, 2025, the price of Bitcoin fell sharply, while Bitcoin ETFs also saw record outflows. US Spot Bitcoin ETFs recorded the largest daily net outflows since their launch, with net outflows of $1.138 billion and $754.6 million on February 25-26, respectively. The BlackRock IBIT ETF experienced one of the largest outflows in its history, adding to the selling pressure on Bitcoin.
Uncertainties in global markets continue to negatively affect the cryptocurrency market. The intensification of global trade wars has negatively affected investor confidence. The continuation of outflows from Bitcoin ETFs, especially with the increase in sales on risky assets, indicates that ETF-driven selling pressure on the market will continue. Due to the uncertainty caused by customs tariffs, price movements started to follow a fluctuating course.
Ethereum spot ETF
Source: SosoValue
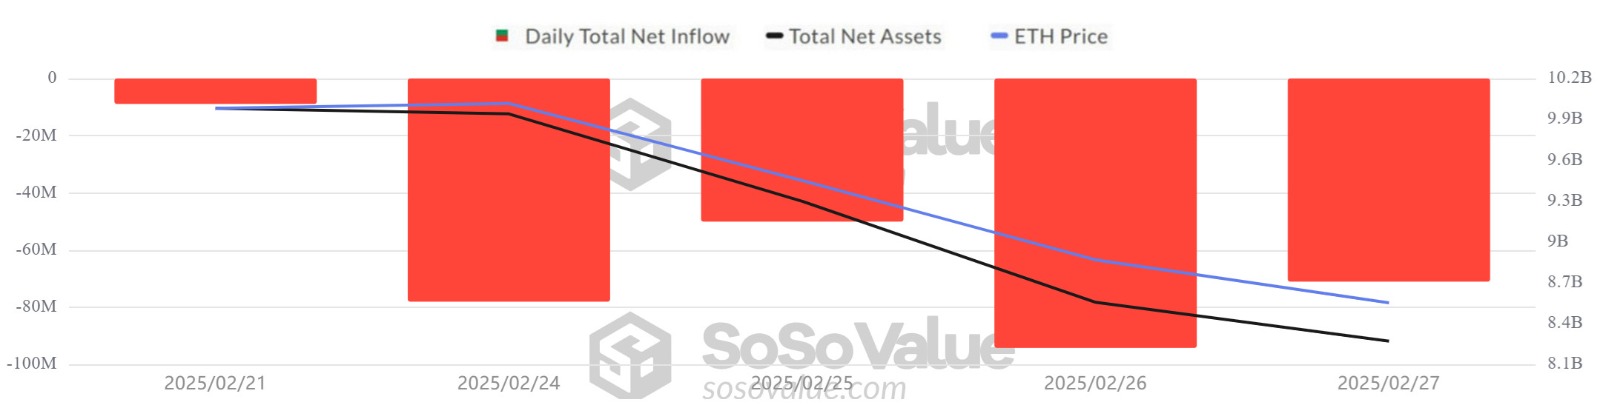
Between February 21-27, 2025, Spot Ethereum ETFs saw a total net outflow of -$302.5 million. Particularly noteworthy were outflows of -$144.1 million from BlackRock ETHA ETF, -$56.4 million from Fidelity FETH ETF and -$65.4 million from Grayscale ETHE ETF. The series of negative net inflows reached 6 days and the cumulative net inflow to Spot Ethereum ETFs fell to $2.86 billion at the end of the 151st trading day. Ethereum opened the day at $2,736 on February 21, 2025, and continued to decline throughout the week, closing at $2,306 on February 27. On a weekly basis, Ethereum price declined by 15.72%.
| DATE | COIN | PRICE OPEN | PRICE CLOSE | CHANGE % | ETF Flow (mil$) |
|---|---|---|---|---|---|
| 21-Feb-25 | ETH | 2,736 | 2,660 | -2.78% | -8.9 |
| 24-Feb-25 | ETH | 2,818 | 2,512 | -10.86% | -78 |
| 25-Feb-25 | ETH | 2,512 | 2,494 | -0.72% | -50.1 |
| 26-Feb-25 | ETH | 2,494 | 2,335 | -6.38% | -94.3 |
| 27-Feb-25 | ETH | 2,335 | 2,306 | -1.24% | -71.2 |
| Total for 21 – 27 Feb 25 | -15.72% | -302.5 | |||
US President Donald Trump’s statements on tariffs and the announcement that other countries would respond to the new sanctions after the US President Donald Trump’s statements on tariffs and new sanctions caused an increase in uncertainty in the crypto markets. This reduced investors’ risk appetite, leading them to exit ETFs. On the other hand, the hacking of the Bybit exchange accelerated the decline in the Ethereum price and led to continued outflows from ETFs. The loss of confidence in the market forced investors to cash out and increased the selling pressure on Ethereum. If market uncertainty persists next week, ETF outflows may continue. In particular, global economic developments and regulatory uncertainties may negatively affect investor sentiment. Continued net outflows from ETFs could continue to put pressure on the Ethereum price and deepen the downtrend.
Bitcoin Options Breakdown
Source: Laevitas
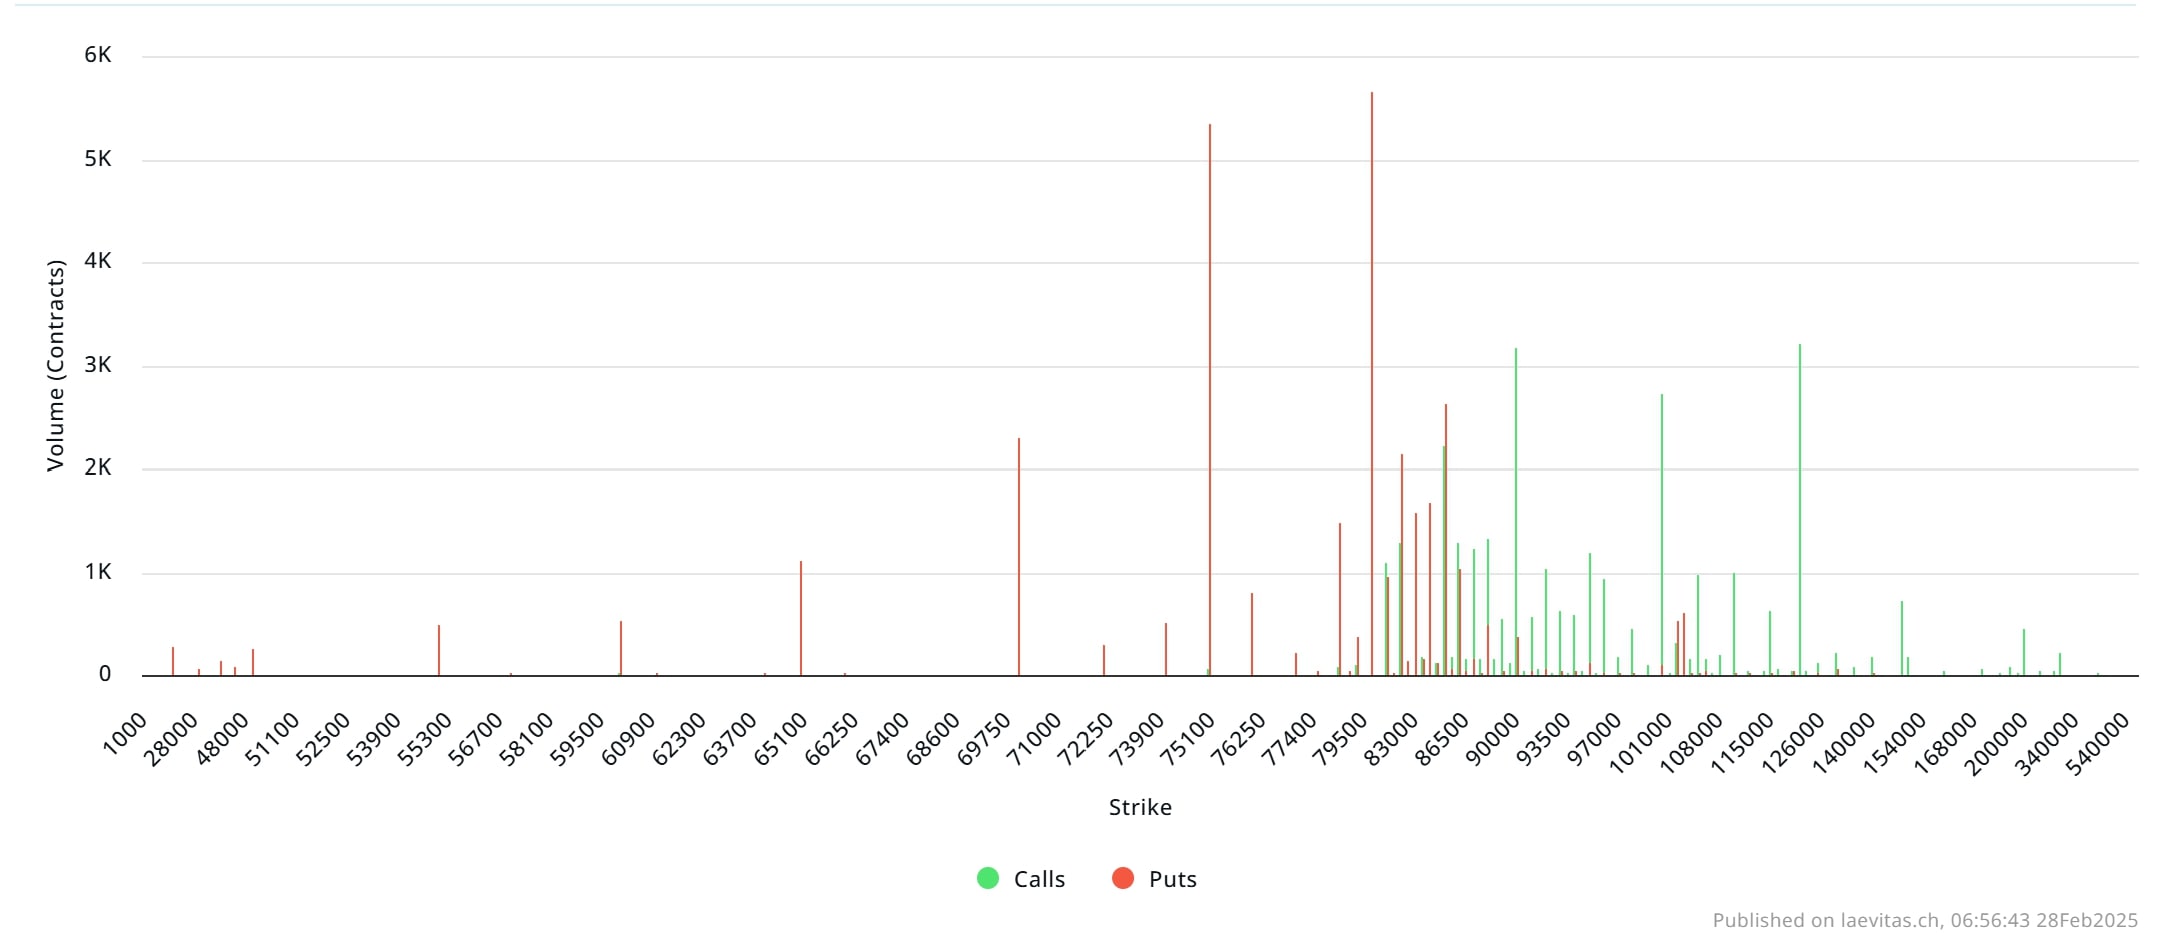
Deribit Data: BTC options contracts with a notional value of about $4.94 billion expire today, Deribit data shows. According to data from Deribit, the largest crypto options exchange, the number of open interest or outstanding contracts for put options with a strike price of $70,000 was the second highest among all contracts expiring on February 28. Meanwhile, CME Group, the world’s leading derivatives market, announced that its new financial-settled options on Bitcoin Friday futures are now available for trading. The first trade, consisting of one block, took place on Sunday, February 23 between Cumberland DRW and Galaxy and was cleared by Marex. “We are pleased to see such early and strong support for these new options products,” said Giovanni Vicioso, Global Head of Cryptocurrency Products at CME Group. “These smaller, cash-settled contracts, with maturities available every day of the business week, will provide investors with even more precision to manage short-term bitcoin price risk.” With Trump’s shock to the markets fading, Bitcoin options show that investors and traders are hedging against the cryptocurrency’s decline to levels last seen just after election day.
Laevitas Data: When we examine the chart, we see that put options are concentrated in the $ 75,000 – $ 85,000 band. Call options are concentrated between $ 81,000 – 101,500 and the concentration decreases towards the upper levels. At the same time, resistance has formed in the $ 81,000 – $ 86,000 band. On the other hand, there are 5.65K put options at the $ 80,000 level, where there is a peak and there is a decrease in volume after this level. However, at the $120,000 level, call options peaked at 3.2K units. When we look at the options market, we see that the market is in the decision-making process. Although there is a slight bear dominance, the increase in open interest data in the coming period also shows that the bull may be strong.
Option Expiration
Put/Call Ratio and Maximum Pain Point: In the last 7 days of data from Laevitas, the number of call options increased by 59% compared to last week to 94.51K. In contrast, the number of put options increased by 260% to 101.77K. The put/call ratio for options was set at 1.14. A put/call ratio of 1.14 indicates that there is a strong preference for put options over calls among investors, indicating a possible market decline. Bitcoin’s maximum pain point is set at $96,000. In the next 7 days, there are 4.73K call and 4.43K put options at the time of writing.
Ethereum Options Distribution
Source: Laevitas
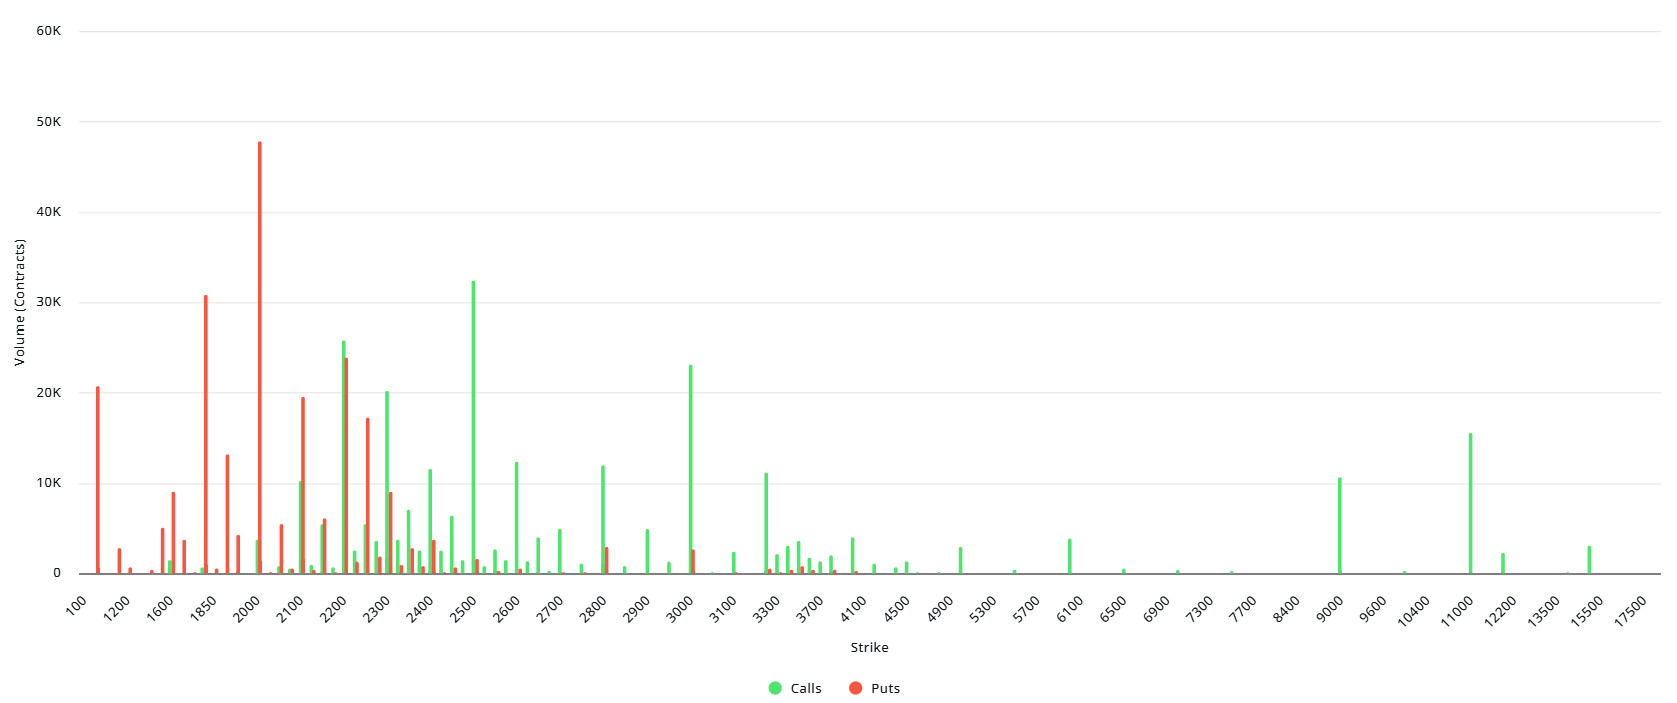
Laevitas Data: When we analyze the chart, we see that Call options are concentrated at certain levels, reflecting the market’s bullish expectation. In the $2,500-$3,000 range, the volume of Call options has increased, suggesting that investors expect the price to rise at these levels. Around $3,000 there is a significant accumulation of Call options, this level can be considered as a resistance point. On the other hand, there is a significant concentration of Put options in the $2,000-2,200 range. This suggests that investors are trying to hedge against a price decline at these levels and this area could be a support level.
Deribit Data: 527,277 Ethereum options contracts also expired today. The notional value of these options is $1.109 billion.
Maximum Pain Point: $3,000.
Put/Call Ratio: 0.52. This shows that investors in the market are in a strong position to expect the price to rise.
LEGAL NOTICE
The investment information, comments and recommendations contained in this document do not constitute investment advisory services. Investment advisory services are provided by authorized institutions on a personal basis, taking into account the risk and return preferences of individuals. The comments and recommendations contained in this document are of a general type. These recommendations may not be suitable for your financial situation and risk and return preferences. Therefore, making an investment decision based solely on the information contained in this document may not result in results that are in line with your expectations.
