
TECHNICAL ANALYSIS
BTC/USDT
Crypto markets are going through a remarkable period with new US moves towards a Bitcoin reserve strategy. US Secretary of Commerce Howard Lutnick reannounced that President Trump will announce the Bitcoin strategic reserve plan at the White House Crypto Summit. While it is stated that assets such as XRP, SOL and ADA will also be evaluated within the scope of the plan, it is suggested that Bitcoin may receive a special status. On the other hand, Texas, one of the crypto-friendly states of the US, has advanced to the next stage in the legislative process by considering a bill to create a strategic Bitcoin reserve. If approved, Texas could become one of the first states in the US to legalize the creation of official Bitcoin reserves.
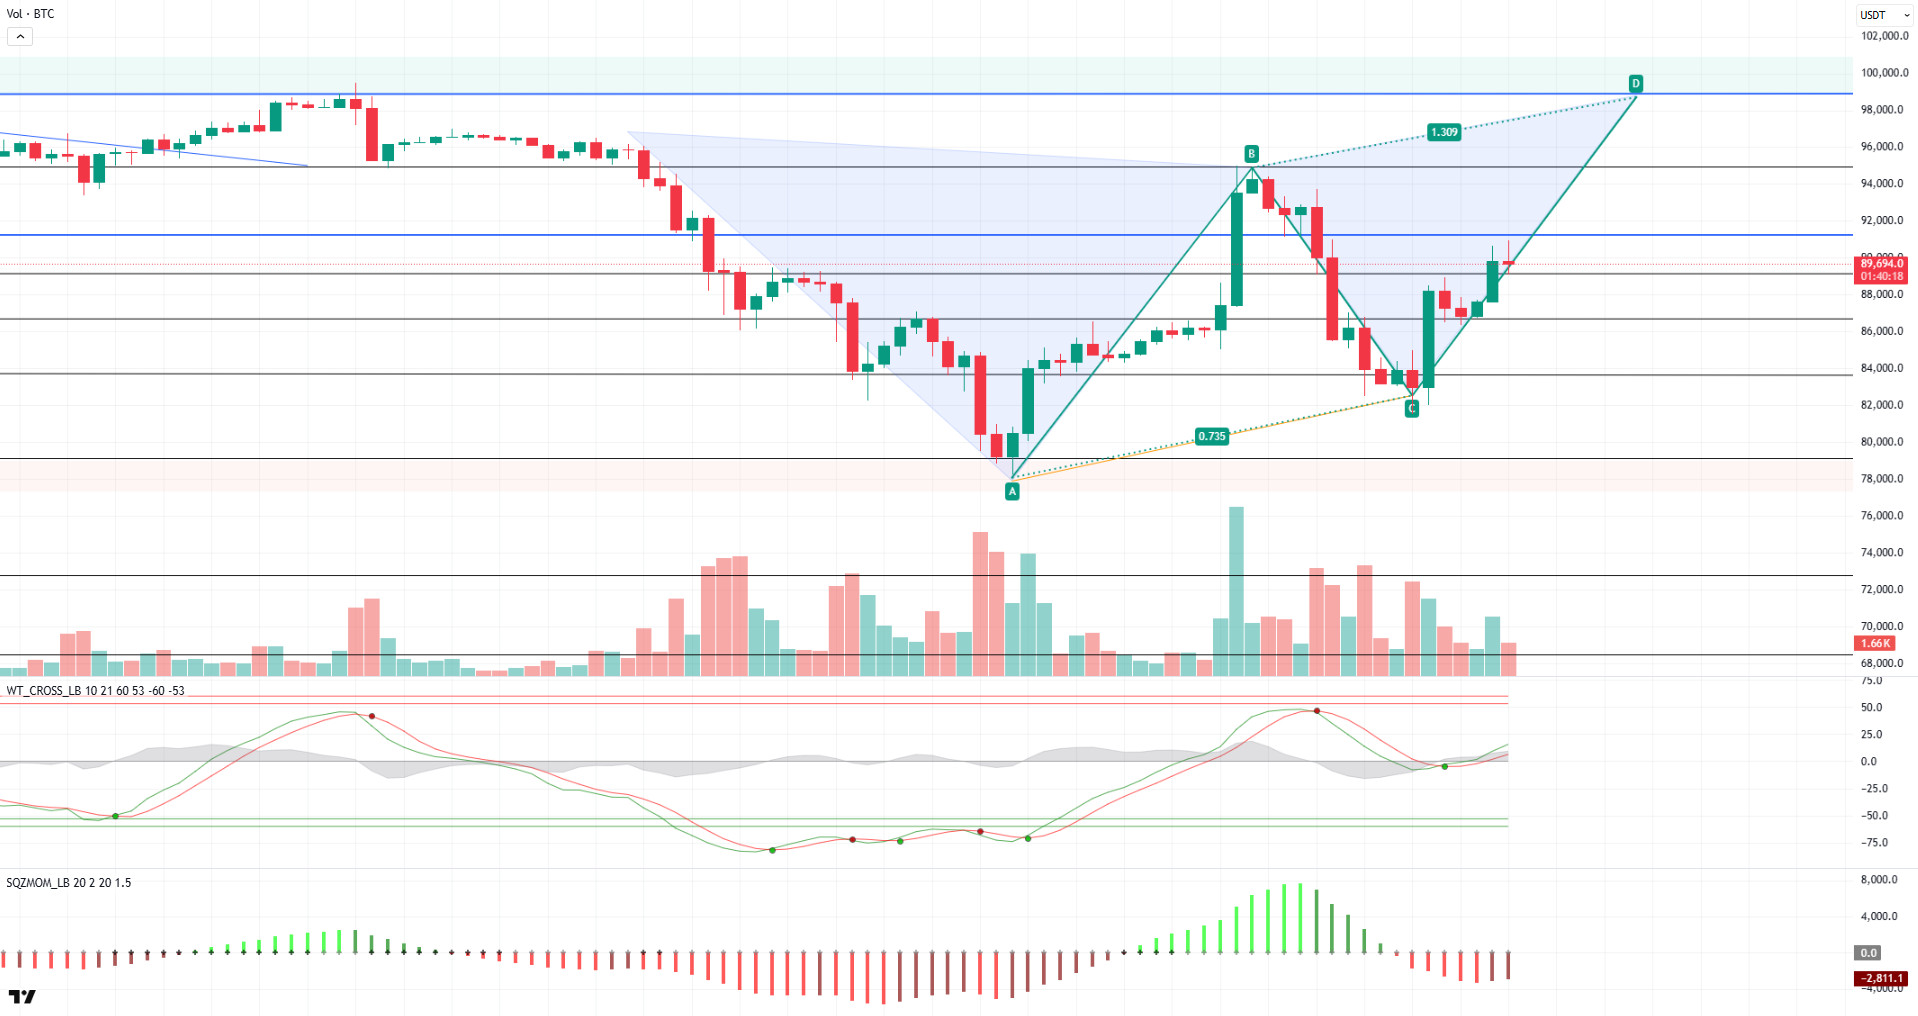
When we look at the technical outlook, it is seen that BTC displayed a strong movement by hovering above the 87,000 level during the day and tested the 90,500 level on the 4-hour candle. However, BTC, which faced selling pressure at this level, continues to trade at the 89,300 level with some retracement. It is noteworthy that BTC has so far exhibited price movements in line with the pattern and has caught a short-term uptrend. The ABC leg of the pattern has been completed and the movement towards the D leg is currently in progress. At this stage, it is important to note that as the price reaches point D, the possibility of facing selling pressure increases. When technical oscillators are analyzed, it is observed that BTC maintains its buy signal, but momentum indicators have not yet followed this movement. If momentum indicators cross into positive territory, it could play a critical role in further strengthening the uptrend and breaking through major resistance levels. If the uptrend continues, the 90,400 level will be followed as resistance first. If this level is broken, the 92,800 level could be BTC’s new target point. In a possible pullback scenario, the 86,500 level will be monitored as a support point.
Supports 86,500 – 83,500 – 80,000
Resistances 89,000 – 90,400 – 92,800
ETH/USDT
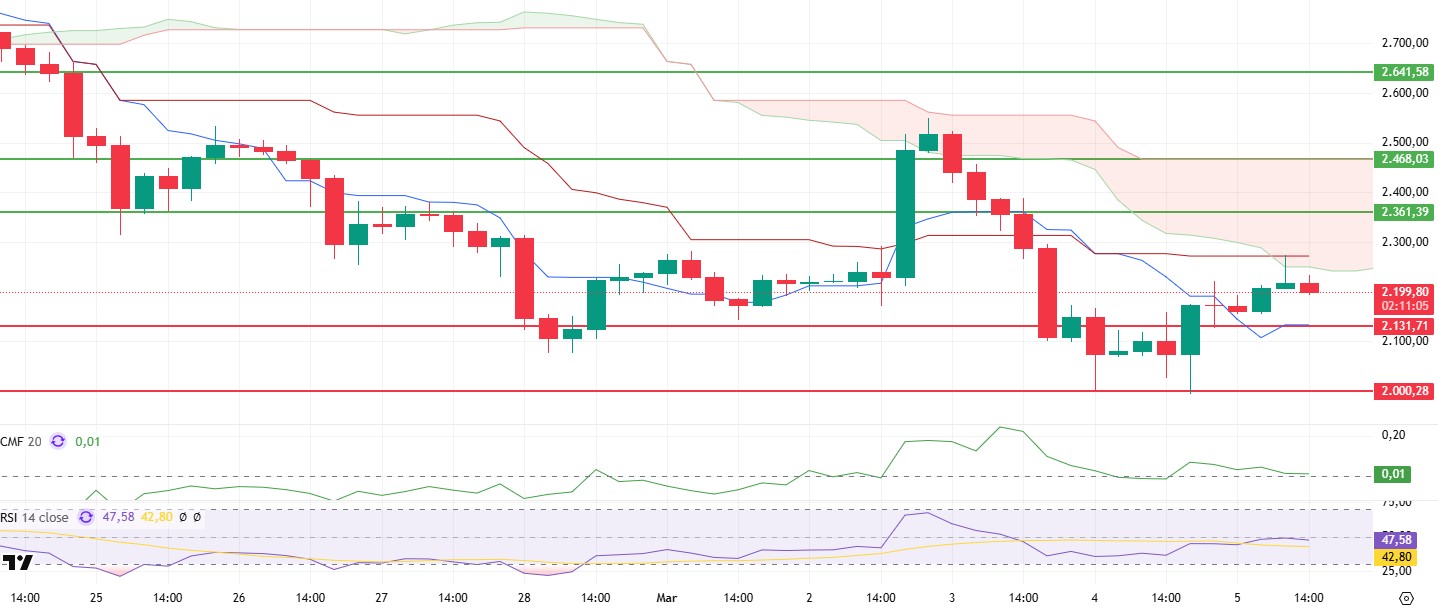
After rising as high as $2,271 during the day, ETH fell back below the kumo cloud with selling pressure from this region. While there is no significant change in technical indicators, it is seen that the market continues its horizontal course.
The Chaikin Money Flow (CMF) indicator continues to retreat towards the zero line, showing an inverse relationship with the price action. This weakening in CMF signals that liquidity outflows from the market are increasing and sellers are gaining strength. This move in CMF, coupled with ETH’s inability to hold above the $2,270 level, is a signal that the price may retreat further. On the other hand, the Relative Strength Index (RSI) continues to remain positive by staying above the based MA line. Although the current state of the RSI indicates the potential for the price to maintain an upward momentum, it does not provide sufficient confirmation for the overall direction of the market.
The retracement of the price from the kijun level and the kumo cloud could be considered a bearish signal. However, with the opening of the US markets, the possibility of ETH testing this zone once again should not be ruled out. Permanent closes above the $2,271 level could allow the bullish movement to continue. However, if this level works as resistance again and the price is rejected from here, it could trigger bearish movements.
Supports 2,131 – 2,000 – 1,907
Resistances 2,361 – 2,468 – 2,641
XRP/USDT
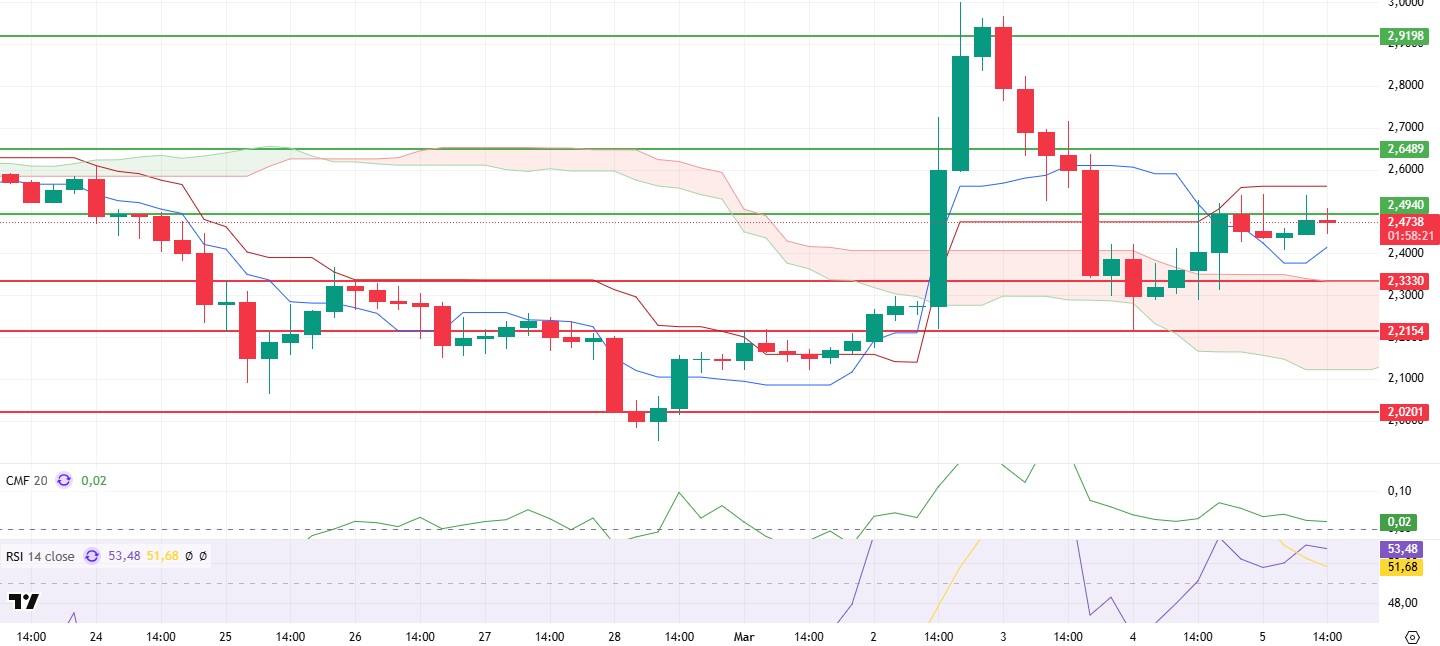
XRP tried to break through the resistance at $2.49 overnight after a rally last night but was pulled back by strong selling from this area. The failure of the price to hold at this level suggests that buyers are not strong enough and selling pressure is still effective.
In line with the price action, the decline in the Chaikin Money Flow (CMF) indicator signals increased liquidity outflows from the market, indicating that sellers are gaining strength and buyers are weakening. On the other hand, the Relative Strength Index (RSI) remains above 50, maintaining a positive stance. While this does not give a clear signal about the direction of the price, it shows that there is still some interest on the buying side. Technically, the fact that XRP is moving between the Tenkan and Kijun levels again after a long break suggests that there is uncertainty in the market. The price stuck between these levels may be waiting for a strong breakout to set a clear direction.
In a nutshell, XRP’s break above the $2.49 resistance and especially above the Kijun line at $2.56 could support the price’s rise towards $2.65. However, if it continues to stay below these levels, selling pressure is likely to increase and the price is likely to move downwards.
Supports 2.3307 – 2.2154 – 2.0201
Resistances 2.4940 – 2.6489 – 2.9198
SOL/USDT
Whale Alert reported that a SOL whale transported 494,153 SOLs worth approximately $71.95 million to Coinbase Institutional.
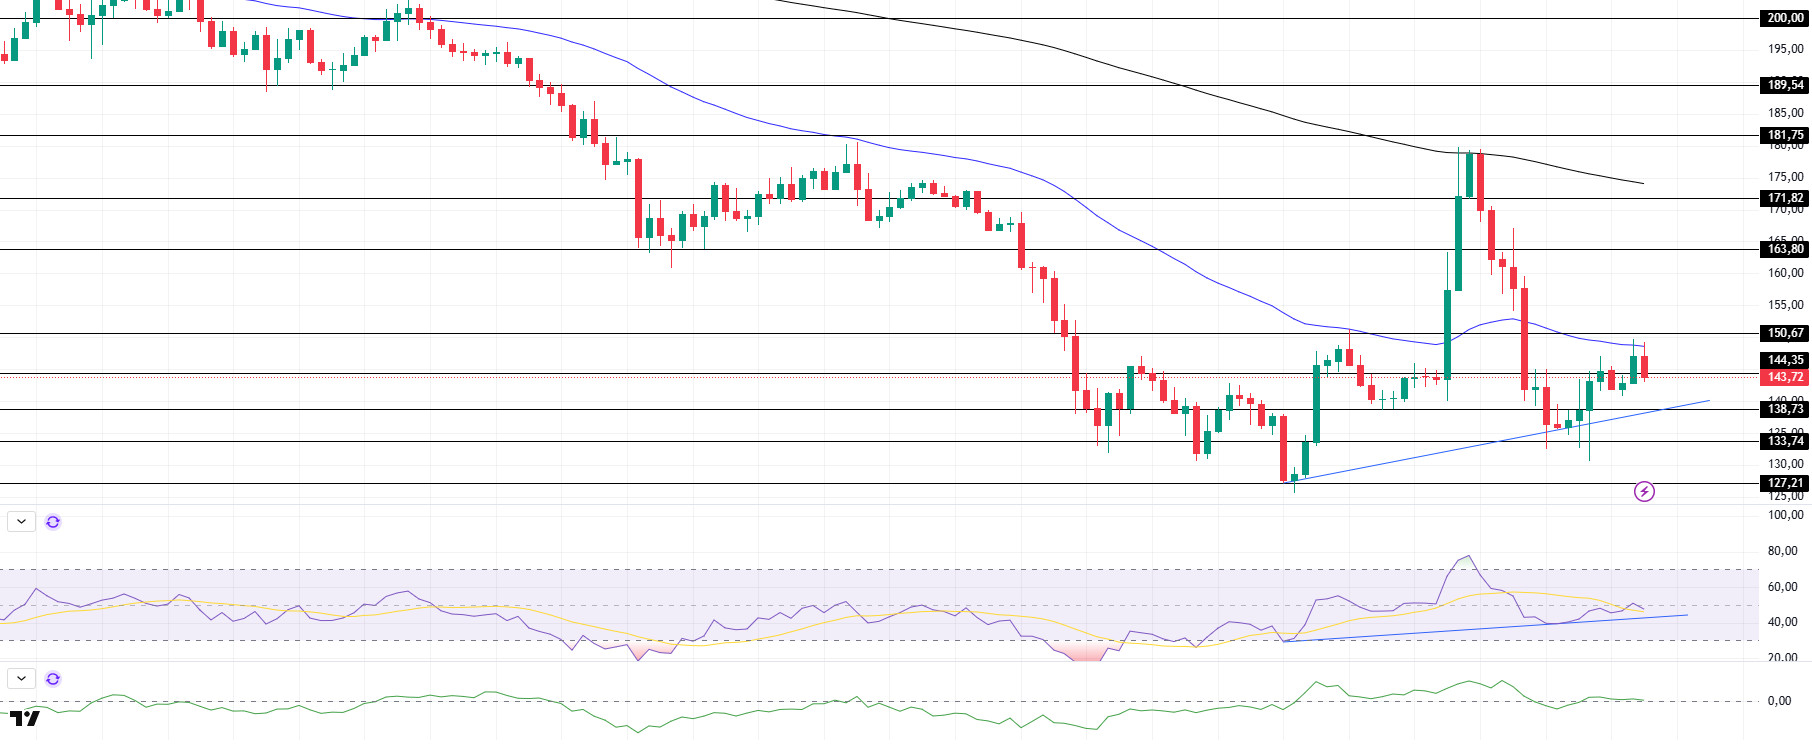
SOL rallied slightly on the optimism in the market but retreated back to resistance at the 50 EMA (Blue Line). On the 4-hour timeframe, the 50 EMA (Blue Line) continues to be below the 200 EMA (Black Line). This could deepen the decline further in the medium term. At the same time, the price started moving below the two moving averages again. The Chaikin Money Flow (CMF)20 indicator moved into positive territory. However, the decline in volume may increase money outflows. However, the Relative Strength Index (RSI)14 indicator rose and accelerated from the mid-level of the negative zone to the neutral zone. At the same time, RSI maintains its uptrend from February 28. The $150.67 level stands out as a very strong resistance point in the rises driven by both the upcoming macroeconomic data and the news in the Solana ecosystem. If it breaks here , the rise may continue. In case of retracements for the opposite reasons or due to profit sales, the support level of $ 133.74 can be triggered. If the price hits these support levels, a potential bullish opportunity may arise if momentum increases.
Supports 144.35 – 138.73 – 133.74
Resistances 150.67 – 163.80 – 171.82
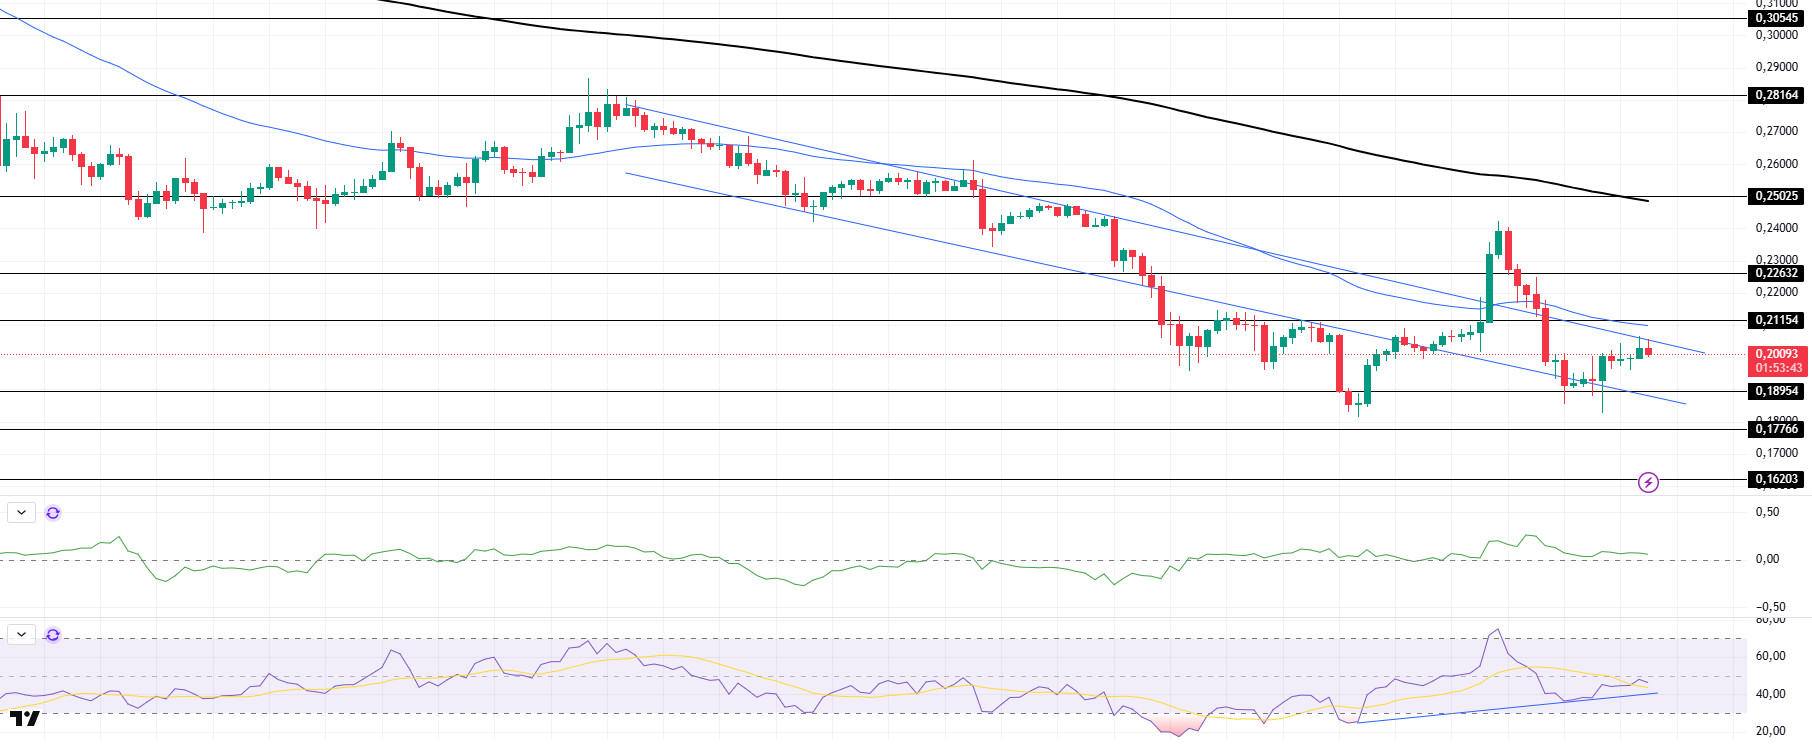
DOGE/USDT
DOGE has moved sideways since our morning analysis. The price is testing the ceiling of the downtrend at the time of writing. On the 4-hour timeframe, the 50 EMA (Blue Line) is below the 200 EMA (Black Line). This could mean that the decline could deepen in the medium term. However, the price is below two moving averages. However, the difference between the two moving averages is large, which increases the probability that DOGE will rise. The Chaikin Money Flow (CMF)20 indicator is in positive territory. However, the negative daily volume may reduce money inflows. On the other hand, Relative Strength Index (RSI)14 is at the upper level of the negative zone. At the same time, the uptrend in RSI, which started on February 28, continues. The $0.21154 level stands out as a very strong resistance point in the rises due to political reasons, macroeconomic data and innovations in the DOGE coin. In case of possible pullbacks due to political, macroeconomic reasons or negativities in the ecosystem, the base level of the trend, the $ 0.18954 level, is an important support. If the price reaches these support levels, a potential bullish opportunity may arise if momentum increases.
Supports 0.18954 – 0.17766 – 0.16203
Resistances 0.21154 – 0.22632 – 0.25025
LEGAL NOTICE
The investment information, comments and recommendations contained herein do not constitute investment advice. Investment advisory services are provided individually by authorized institutions taking into account the risk and return preferences of individuals. The comments and recommendations contained herein are of a general nature. These recommendations may not be suitable for your financial situation and risk and return preferences. Therefore, making an investment decision based solely on the information contained herein may not produce results in line with your expectations.

