
TECHNICAL ANALYSIS
BTC/USDT
US Treasury Secretary Scott Bessant stated that he did not completely rule out the possibility of the US entering a recession, arguing that the economy should move away from large government spending. The Central Bank of South Korea announced that they have never considered adding Bitcoin to their foreign exchange reserves, stating that Bitcoin is not suitable as a reserve asset due to high volatility and non-compliance with IMF standards. After the Lazarus Group hacked the Bybit exchange, it was reported that it converted some of the funds it stole into Bitcoin and North Korea became the third country with the most Bitcoin reserves in the world with 13,562 BTC.
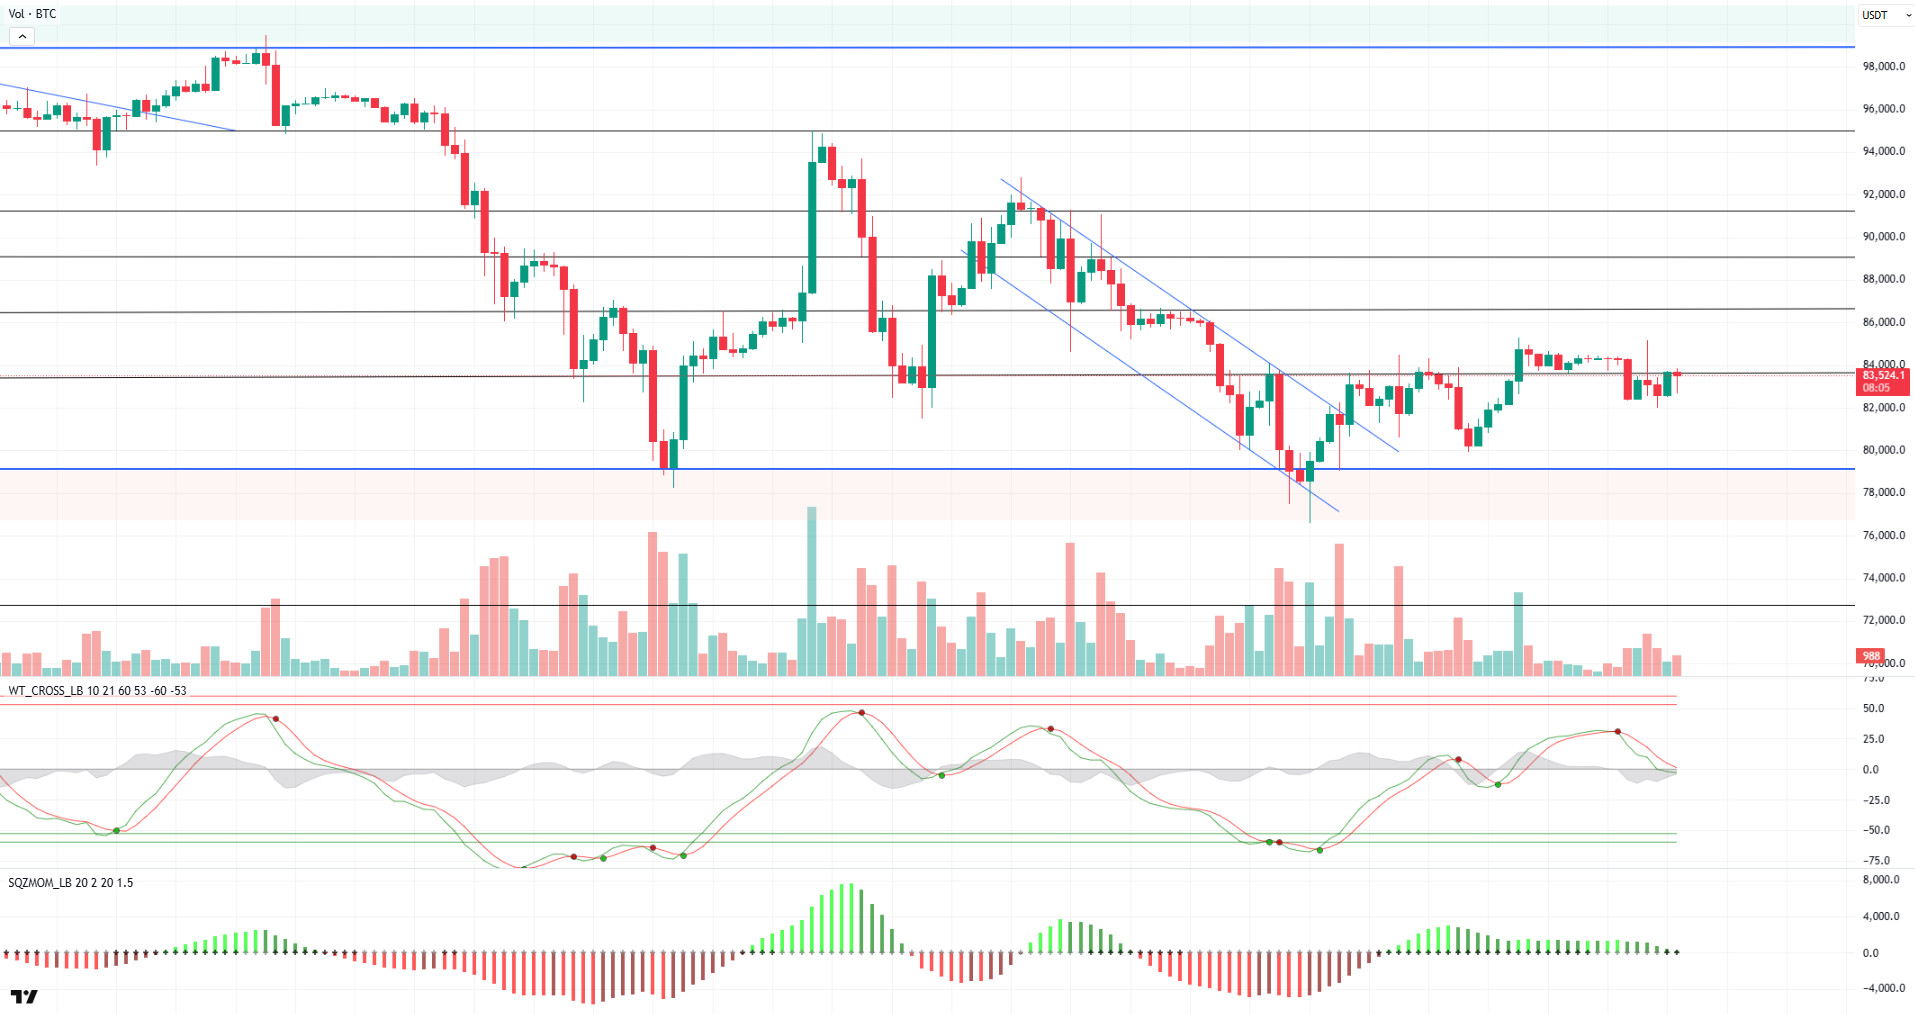
When we look at the technical outlook of BTC, it is seen that it tested the 85,000 levels after settling above the 83,500 level we mentioned in the last analysis of the week. Looking at the weekly liquidation heatmap, it is observed that some of the liquidity in this region has been taken and BTC has turned its direction down again. After breaking the 83,500-resistance level, it is noteworthy that the accumulation of long trades in the 78,000 and 81,000 band increased. BTC is currently trading at 83,500, with technical oscillators generating a sell signal approaching the overbought zone over the weekend and this signal continues to be maintained. Momentum indicators have also lost momentum in the positive zone, confirming this. Periodically, while the buy signal continues on the hourly charts, the sell signal is maintained on the 4-hour and daily charts. Looking at the price movements, it is seen that the uncertainty in the market continues with low volatility and volume. If the upward movement continues, closes above 83,500 may target the 85,000 level again. In a possible new wave of selling, the 80,000 level will be followed as a reference point.
Supports 80,000 – 77,000 – 74,600
Resistances 83,500 – 86,500 – 89,000
ETH/USDT
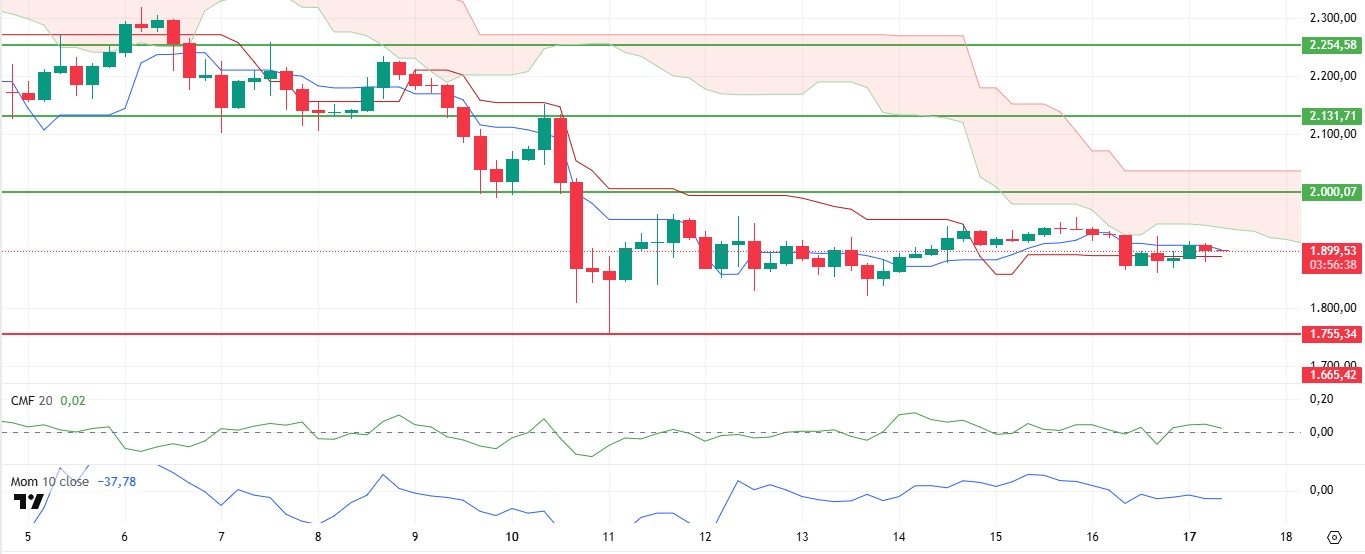
ETH remained flat over the weekend, fluctuating between $1,950-1,850. During this period, significant changes were observed in some technical indicators.
Especially when the Ichimoku indicator is analyzed, it is seen that the positive structure formed by the tenkan level rising above the kijun level on Friday evening did not have the expected effect on the price. After reaching the Kumo cloud boundaries, ETH suffered a sharp rejection from this region and retreated. This suggests that the Kumo cloud has formed a strong resistance and the price is struggling to break through this level. The Chaikin Money Flow (CMF) indicator, on the other hand, has rebounded after falling sharply into the negative territory, indicating that the move is temporary, and liquidity is stabilizing. Since momentum has been flat for a long time, the Kumo cloud resistance stands out as a critical zone and continues to be decisive for price action.
In terms of the current technical structure, the price can be expected to test the kumo cloud boundaries once again during the day. If this zone is exceeded, an attack towards the levels of $ 2,000 and above may occur. On the other hand, $ 1,755 is the main support level in downward movements, and if this level is lost, the possibility of sharp declines will increase.
Supports 1,755 – 1,665 – 1,539
Resistances 2,000- 2,131 – 2,254
XRP/USDT
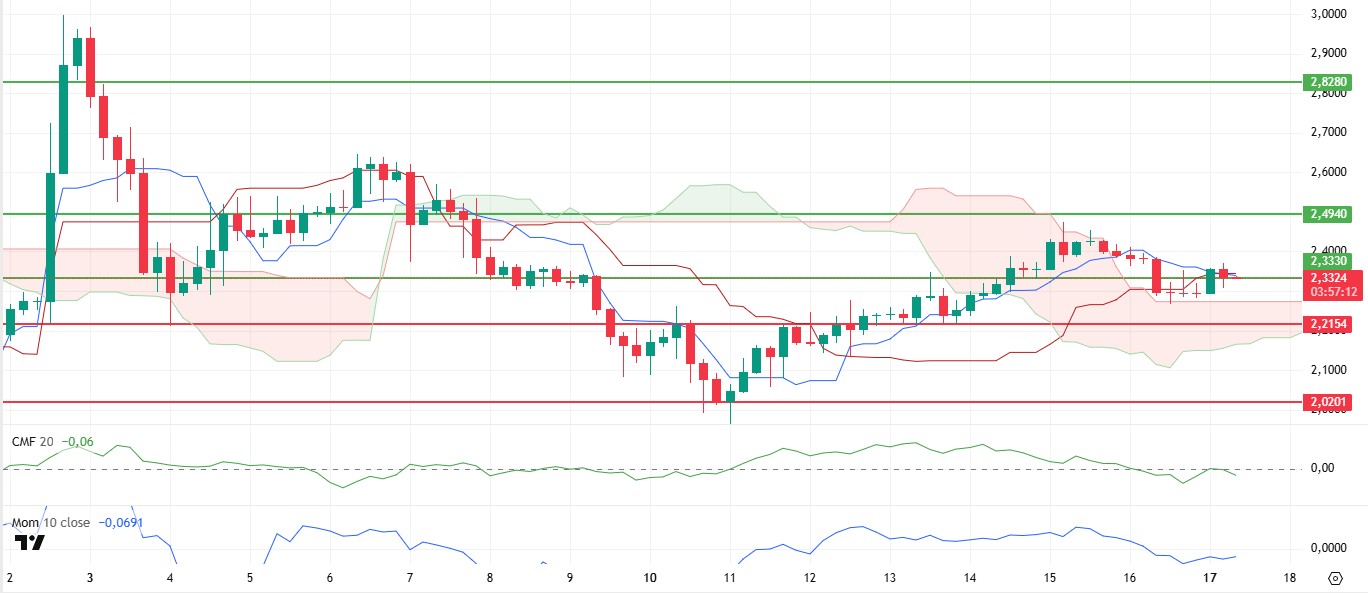
XRP experienced a sharp rise to $2.49, as expected, after exceeding the $2.33 level on Friday. In this region, it fell to the borders of the kumo cloud with strong selling pressure. Although it regained the $ 2.33 level in the morning hours, some weakness began to occur in the indicators.
First of all, Chaikin Money Flow (CMF), which has been rising in the positive area for a long time, has weakened into the negative zone, indicating that liquidity outflows are increasing. Momentum, similar to CMF, continues to weaken, indicating that the pressure on the price may continue for a while. On the Ichimoku indicator, the convergence of the tenkan level to the kijun level can be seen as a signal of weakness.
As a result, it seems likely that the price will fall to the level of $ 2.27 with the loss of the $ 2.33 level and fall to the support level of $ 2.21 with the breakdown of this level. However, if the $2.33 level can be maintained, with the improvements in indicators, rises up to the $2.49 level can be seen again.
Supports 2.3330 – 2.2154 – 2.0201
Resistances 2.4940 – 2.8280 – 3.2125
SOL/USDT
On March 12, after Templeton’s ETF application proposal, the SEC must make a decision no later than 90 days after the proposal. On the other hand, Ghanaian President John Dramani Mahama described Solana as the eye of fintech growth in Africa. FalconX executed the first block trade for CME Solana futures. On the Onchainde side, DEX trading volumes hit Solana the hardest, falling 60% from January highs. In January, DEX trading volumes peaked at $457.5 billion. By the end of February, DEX volumes fell below $300 billion. By mid-March, monthly volumes were down to around $100 billion, according to The Block.
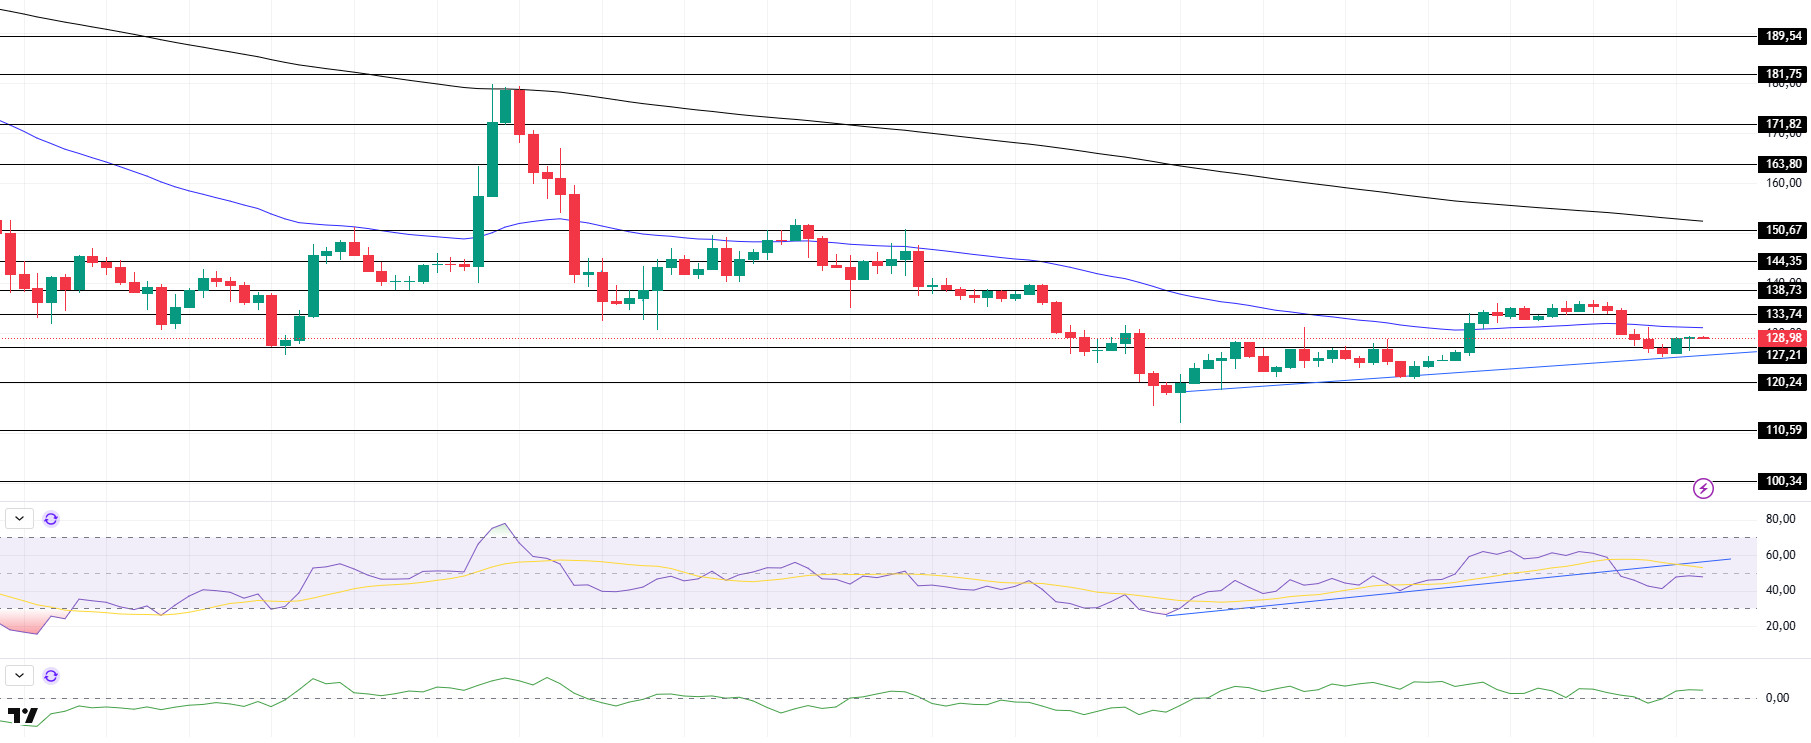
SOL continued the uptrend that it crossed on March 11. It is currently preparing to test the 50 EMA (Blue Line) as resistance after testing the trend as support and turning bullish again. On the 4-hour timeframe, the 50 EMA (Blue Line) continues to be below the 200 EMA (Black Line). This could deepen the decline further in the medium term. At the same time, the price is moving below the two moving averages. However, a large difference between the two moving averages may cause the asset to rise. The Chaikin Money Flow (CMF)20 indicator remained in positive territory. In addition, high volume may further increase money inflows and cause the asset to rise. However, the Relative Strength Index (RSI)14 indicator is close to the neutral zone of the negative zone but broke the uptrend that started on March 11 to the downside. This may cause the asset to fall. The $ 133.74 level stands out as a very strong resistance point in rises due to both the upcoming macroeconomic data and the news in the Solana ecosystem. If it breaks here, the rise may continue. In case of retracements for the opposite reasons or due to profit sales, the support level of 120.24 dollars can be triggered. If the price comes to these support levels, a potential bullish opportunity may arise if momentum increases.
Supports 127.21 – 120.24 – 110.59
Resistances 133.74 – 138.73 – 144.35
DOGE/USDT
On-chain data from Santiment shows a 400% increase in active Dogecoin addresses, reaching nearly 395,000. However, miners are losing momentum, having recently disposed of more than 65 million DOGE.
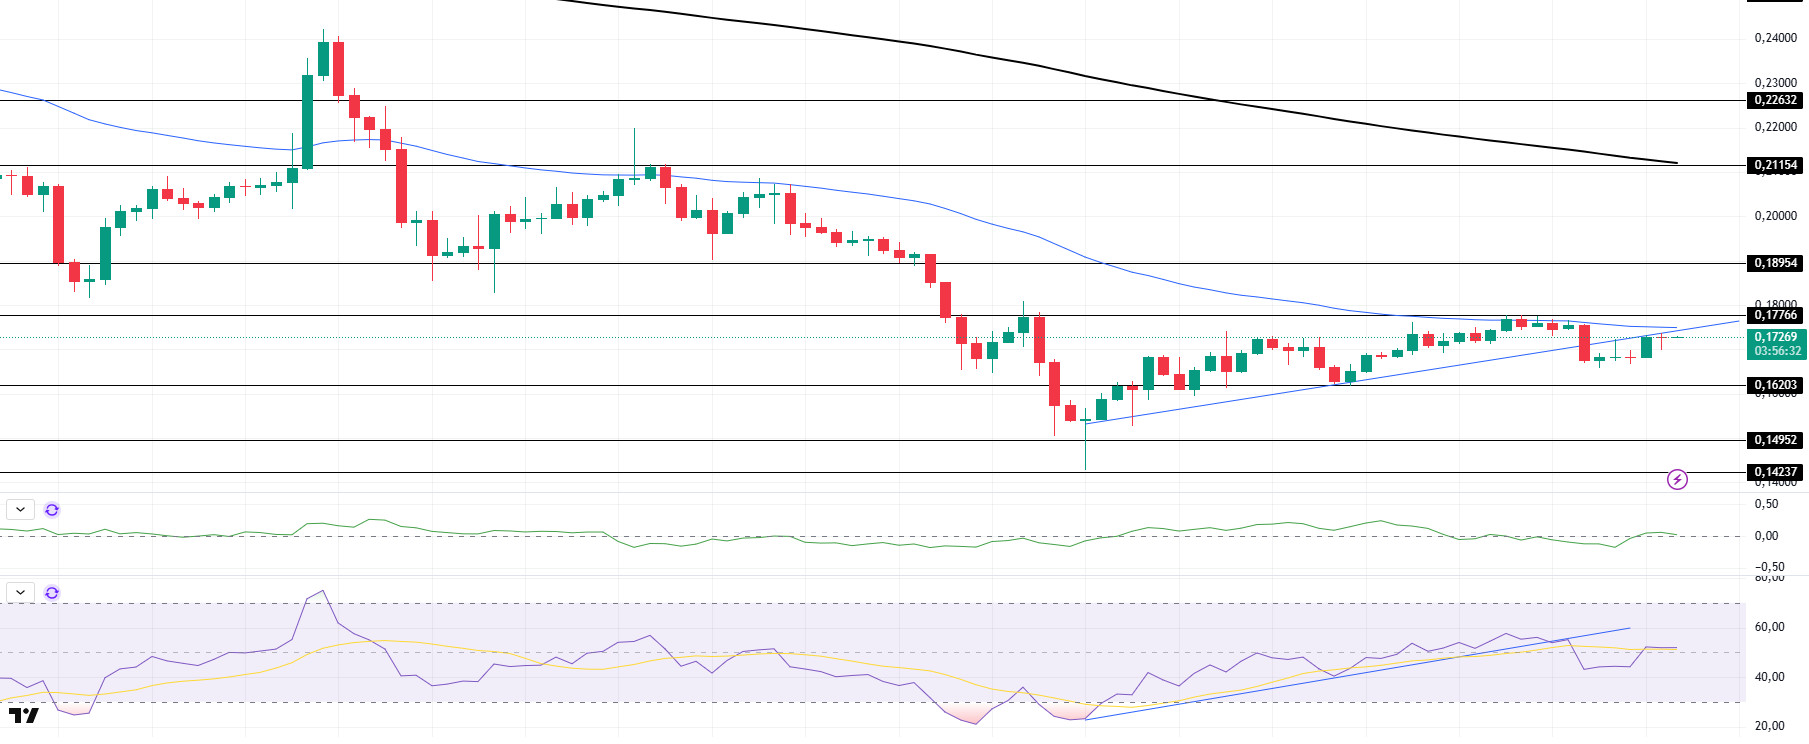
DOGE was slightly bullish over the past weekend. The asset broke its uptrend since March 11th to the downside and is currently testing the broken trend as resistance and at the same time the trend crossed the 50 EMA (Blue Line). This makes it a very strong resistance spot. On the 4-hour timeframe, the 50 EMA (Blue Line) is below the 200 EMA (Black Line). This could mean that the decline could deepen in the medium term. However, the price is pricing below two moving averages. The larger gap between the two moving averages increases the probability that DOGE will rise. When we analyze the Chaikin Money Flow (CMF)20 indicator, it is in positive territory. In addition, the fact that the daily volume is on the plus may further increase the money inflows and increase the asset. On the other hand, Relative Strength Index (RSI)14 is close to the neutral level of the positive zone, but it has broken the trend downwards by failing to be above the uptrend on March 11. The $0.18954 level stands out as a very strong resistance point in the uptrend due to political reasons, macroeconomic data and innovations in the DOGE coin. In case of possible pullbacks due to political, macroeconomic reasons or negativities in the ecosystem, the $0.14952 level, which is the base level of the trend, is an important support. If the price reaches these support levels, a potential bullish opportunity may arise if momentum increases.
Supports 0.16203 – 0.14952 – 0.14237
Resistances 0.17766 – 0.18954 – 0.21154
LEGAL NOTICE
The investment information, comments and recommendations contained herein do not constitute investment advice. Investment advisory services are provided individually by authorized institutions taking into account the risk and return preferences of individuals. The comments and recommendations contained herein are of a general nature. These recommendations may not be suitable for your financial situation and risk and return preferences. Therefore, making an investment decision based solely on the information contained herein may not produce results in line with your expectations.

