
TECHNICAL ANALYSIS
BTC/USDT
BlackRock’s head of digital assets stated that the institutional adoption of Bitcoin is not yet fully reflected in prices. Russia and Bolivia reportedly use Bitcoin and cryptocurrencies as payment methods in international oil transactions. On the other hand, the SEC announced that the cryptocurrency working group will hold its first roundtable meeting on March 21. Today, eyes will be on the critical Fed meeting and will carefully monitor the effects of Powell’s messages on the market.
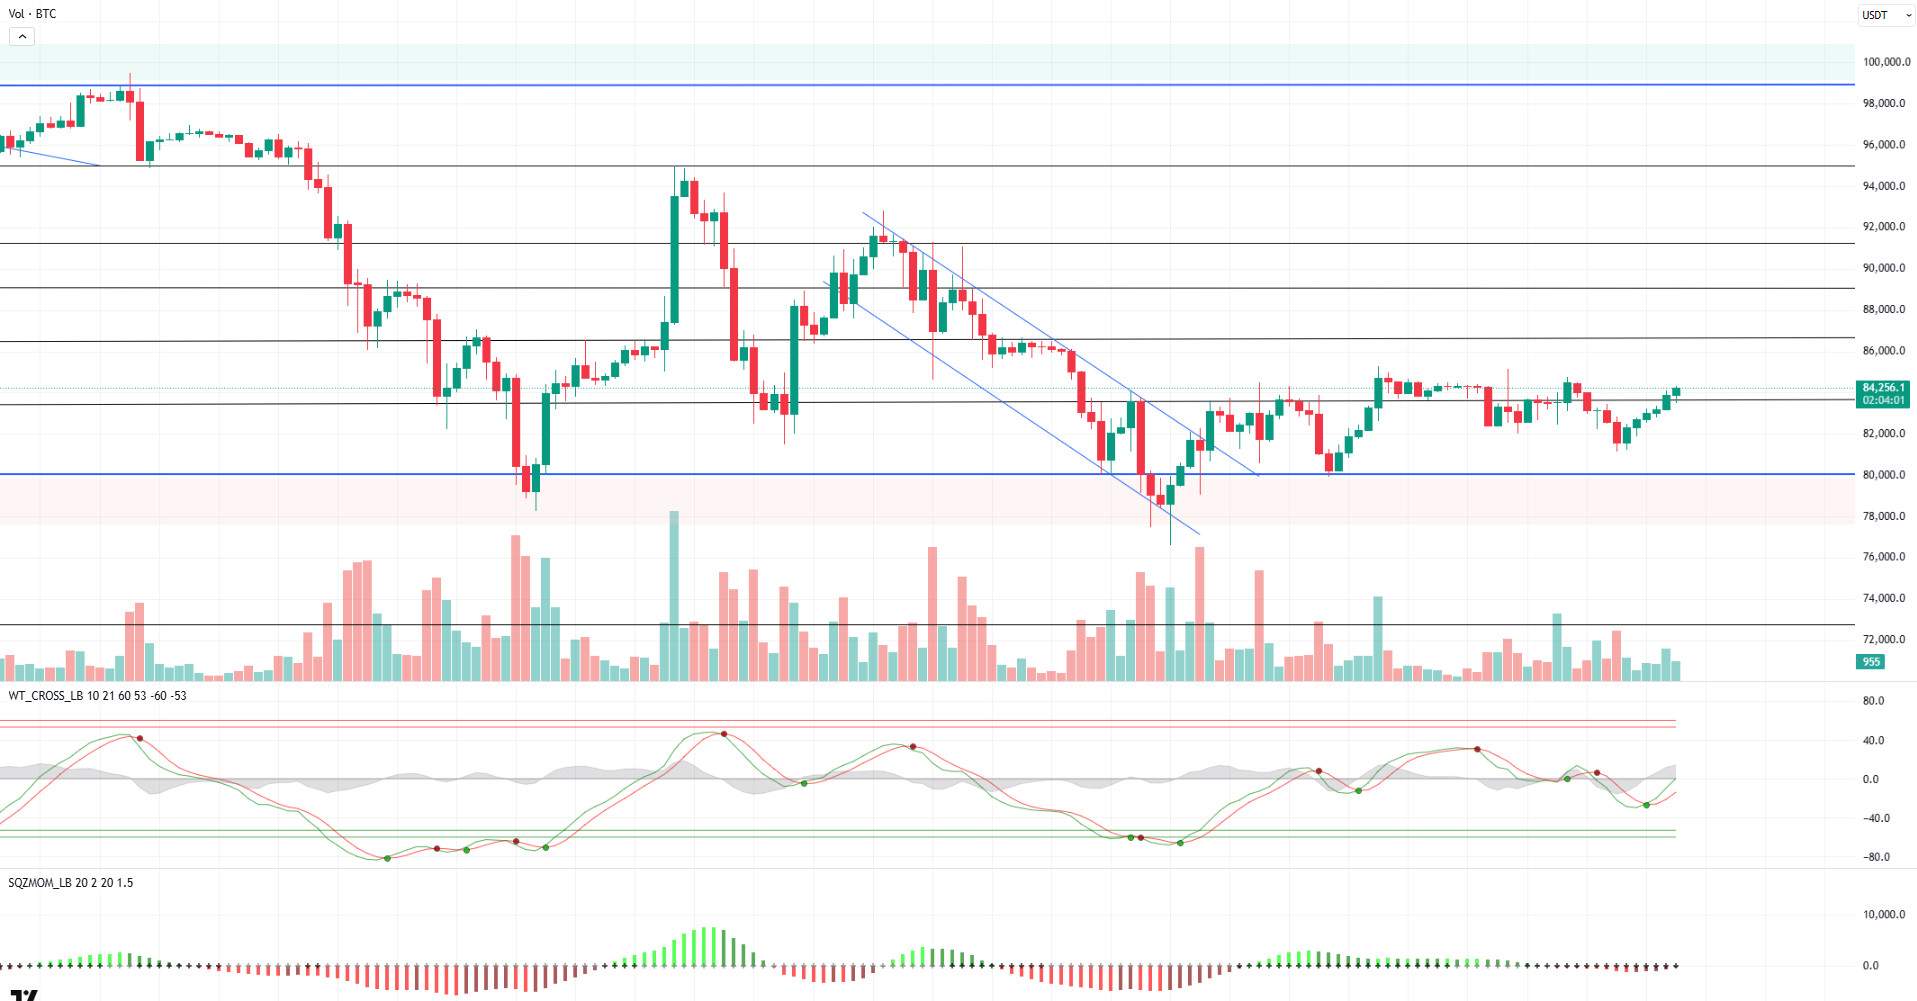
When we look at the technical outlook of BTC, it is seen that it recorded a limited rise during the day and managed to remain positive on the sixth 4-hour candle. BTC, which has currently surpassed the 83,500-resistance level, continues to maintain the buy signals mentioned in the previous analysis, but momentum indicators have not yet recorded a significant acceleration. While the price is expected to exhibit sharp movements in the evening hours with increasing volatility, MACD (12.26) and RSI (14) maintain their buy signals on the hourly and 4-hour charts periodically. The continuation of the sell signal on daily charts indicates that the uncertainty in the market continues. On the ETF side, positive inflows dominated in the last two days, while short trades above 85,000 stand out as the first target on the liquidation heatmap. In a possible selling wave, the 82,400 level will be followed as intermediate support. If this level is broken, long trades at 80,000 may be liquidated.
Supports 82,400 – 80,000 – 78,000
Resistances 83,500 – 86,500 – 89,000
ETH/USDT
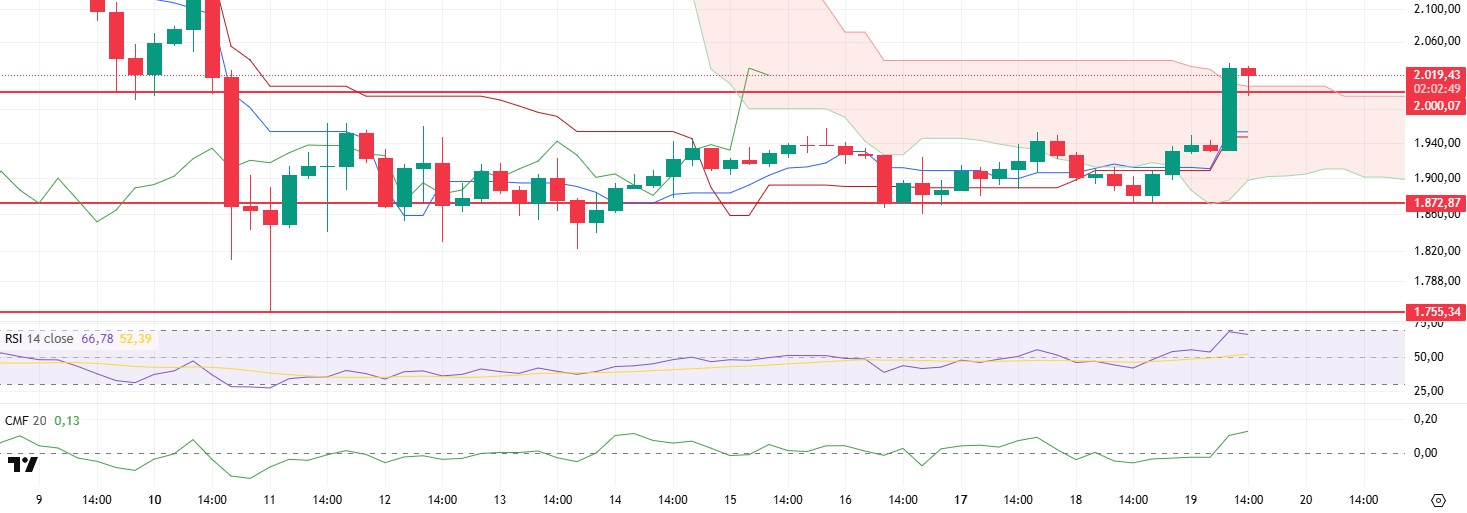
ETH rose to the $2,000 level after exceeding the $1,950 level as expected during the day. In this region, purchases strengthened in this region, breaking the $2,000 level and rising to $2,031. The positive outlook for ETH, which is momentarily pricing above this critical level, remains valid.
When technical indicators are analyzed, the price breaking through the kumo cloud and the rise of the tenkan level appear as a positive signal. Chaikin Money Flow (CMF) has entered the positive area with sharp rises in this process and shows that liquidity inflows are increasing. The fact that it does not create any negative divergence with this movement also contributes to the positive outlook. With this movement, it is seen that the Relative Strength Index (RSI) indicator rises to the overbought zone and rejects from this level. Although the RSI has approached the overbought zone, it has not created a structural negative signal and continues to remain positive.
As a result, ETH’s rise above the most important resistance level of $2,000 and the positive signals in the indicators indicate that this rise may continue. Provided that the price does not lose the $2,000 level, it seems likely that the bullish movement will continue in the evening hours. However, possible closures below the $2,000 level may bring retracements to $1,950 and then $1,900.
Supports 2,000 – 1,872 – 1,755
Resistances 2,131 – 2,254 – 2,552
XRP/USDT
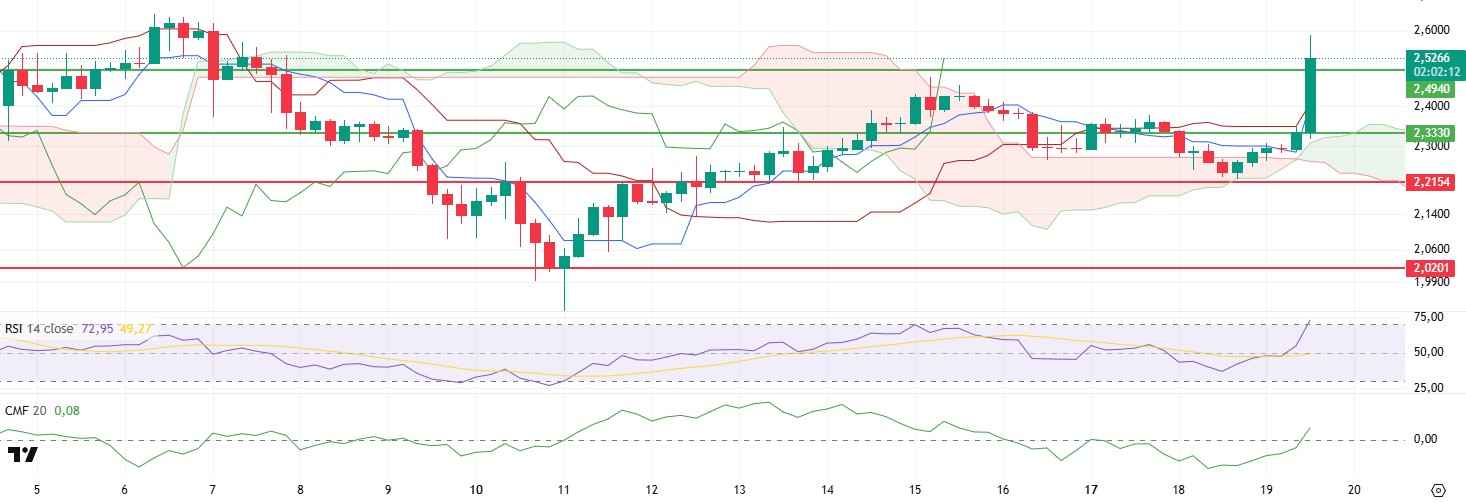
Ripple CEO Brad Garlinghouse said, “The moment we have been waiting for has arrived. The SEC will drop the appeal.” After his statement, XRP experienced a sharp rise during the day and managed to rise to the level of $2.59. With this rise, important resistance levels of $2.33 and $2.49 were exceeded.
In technical indicators, Chaikin Money Flow (CMF) moving into the positive area with the rise can be considered as a positive signal. Relative Strength Index (RSI) has entered the overbought area with the rise and shows that the price is open to volatile movements at these levels. On the other hand, the price above the kumo cloud level in the ichimoku indicator and the rise of the tenkan level in parallel with the price movement can be considered as factors that strengthen the positive picture.
As a result, it is confirmed by technical indicators that if the news flows in the XRP-specific news flows are positive in the coming days, the rises may continue. In this case, the persistence of the XRP price above $2.49 may bring rises up to $2.82. Violation of the $2.49 level may initiate a correction movement up to $2.33.
Supports 2.2154 – 2.0201 – 1.8932
Resistances 2.3330 – 2.4940 – 2.8280
SOL/USDT
Raydium, one of the leading decentralized exchanges on the Solana blockchain, launched its new token issuance platform LaunchLab. On the other hand, STARDEER launched a $10 Million fund to support the growth of the Solana ecosystem.
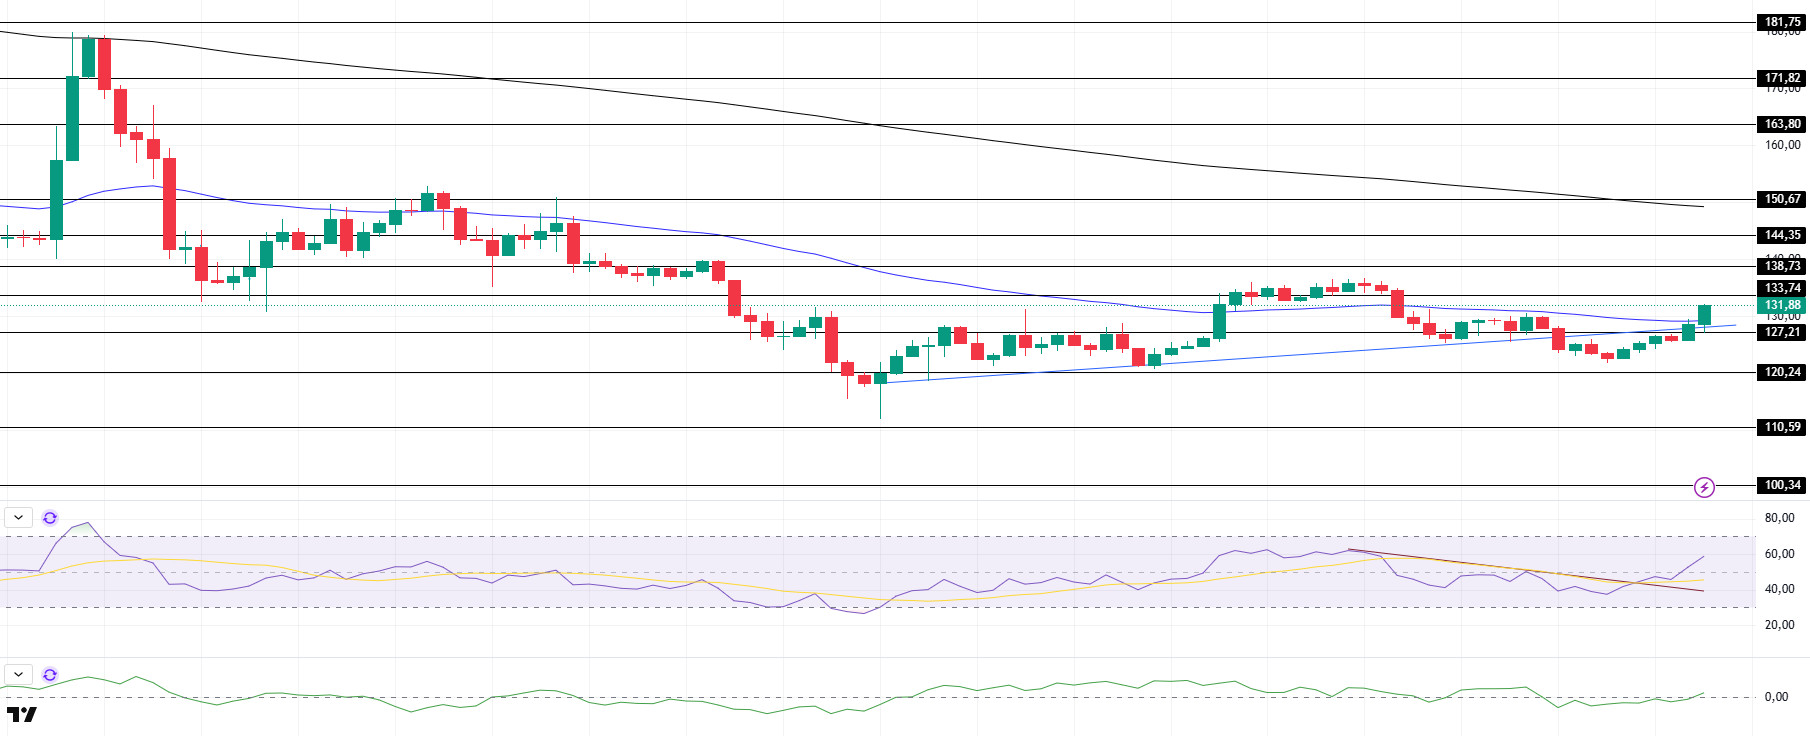
SOL has continued its uptrend since our analysis in the morning, breaking the uptrend resistance and pricing above the trend again. As of now, the asset seems to have broken the 50 EMA (Blue Line) on the candle that has not yet closed. On the 4-hour timeframe, the 50 EMA (Blue Line) remained below the 200 EMA (Black Line). This could deepen the decline further in the medium term. At the same time, the price is moving below the two moving averages. However, a large gap between the two moving averages may cause the asset to rise. When we examine the Chaikin Money Flow (CMF)20 indicator, it remained in the neutral zone. However, the low 24-hour volume may reduce money inflows and cause the asset to move into the negative zone. However, the Relative Strength Index (RSI)14 indicator moved into positive territory. In addition, the indicator, which broke the downtrend that started on March 15 upwards, continued to maintain it. This may cause the asset to rise further. The $ 133.74 level stands out as a very strong resistance point in the rises driven by both the upcoming macroeconomic data and the news in the Solana ecosystem. If it breaks here, the rise may continue. In case of pullbacks due to the opposite reasons or profit sales, the support level of 120.24 dollars can be triggered. If the price comes to these support levels, a potential bullish opportunity may arise if momentum increases.
Supports 127.21 – 120.24 – 110.59
Resistances 133.74 – 138.73 – 144.35
DOGE/USDT
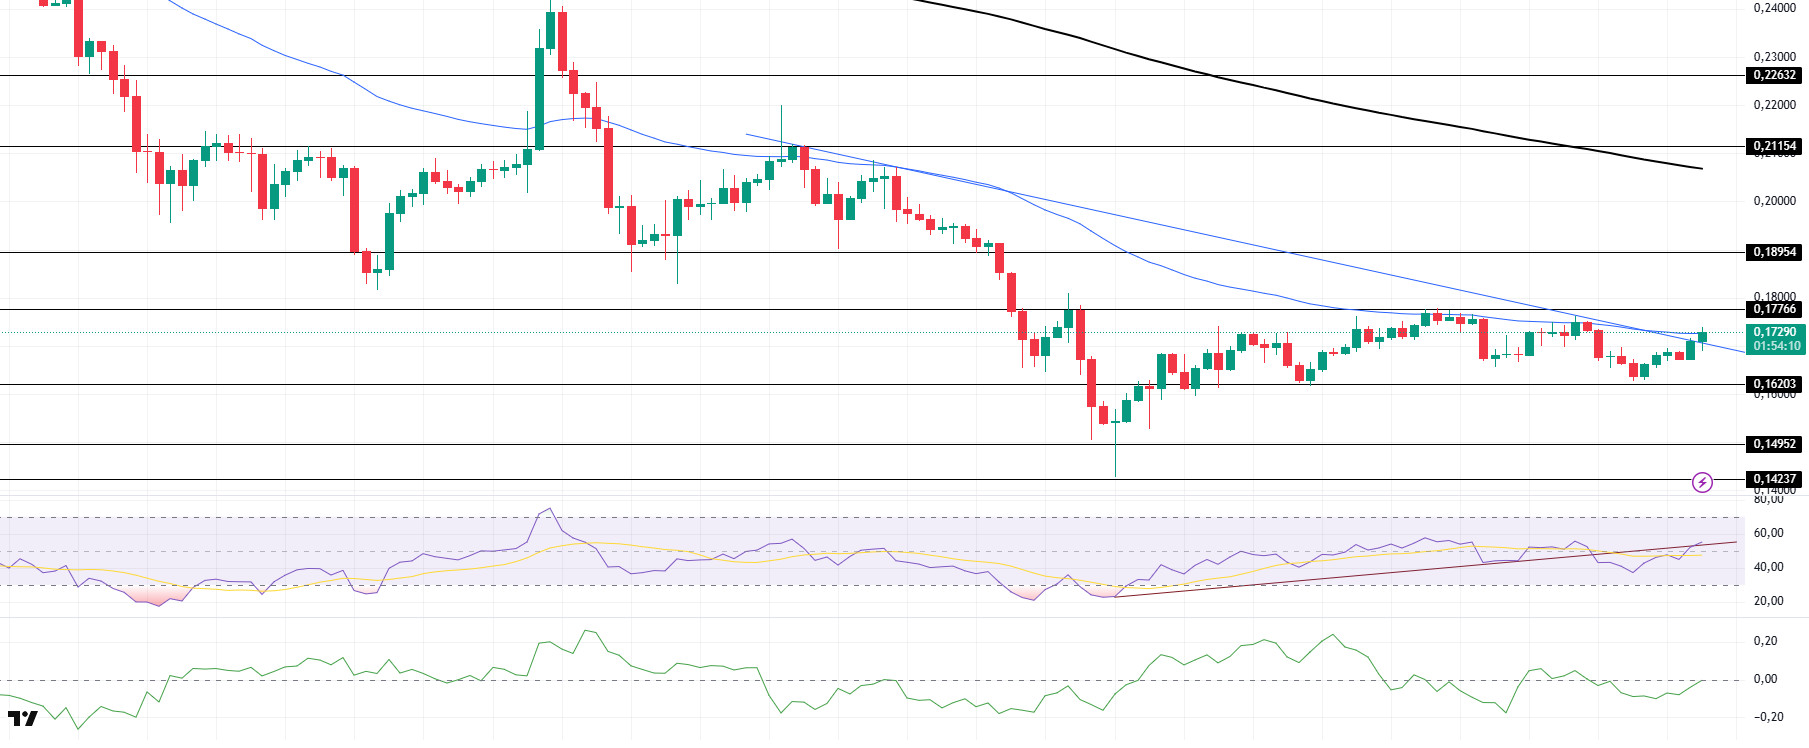
DOGE has continued its uptrend since our morning analysis. The asset is currently testing the 50 EMA (Blue Line) moving average as resistance, breaking the downtrend since March 6. On the 4-hour timeframe, the 50 EMA (Blue Line) is below the 200 EMA (Black Line). This could mean that the decline could deepen in the medium term. However, the price is pricing below two moving averages. The larger gap between the two moving averages increases the probability that DOGE will rise. When we analyze the Chaikin Money Flow (CMF)20 indicator, it is in the negative zone. In addition, the fact that the 24-hour volume is negative may reduce money inflows and cause CMF to fall further. On the other hand, Relative Strength Index (RSI)14 has moved into positive territory. However, although it failed to be above the uptrend on March 11 and broke the trend downwards, it is testing the trend as resistance again with today’s move. The level of 0.18954 dollars appears as a very strong resistance place in the rises due to political reasons, macroeconomic data and innovations in the DOGE coin. In case of possible pullbacks due to political, macroeconomic reasons or negativities in the ecosystem, the $0.14952 level, which is the base level of the trend, is an important support. If the price reaches these support levels, a potential bullish opportunity may arise if momentum increases.
Supports 0.16203 – 0.14952 – 0.14237
Resistances 0.17766 – 0.18954 – 0.21154
LEGAL NOTICE
The investment information, comments and recommendations contained herein do not constitute investment advice. Investment advisory services are provided individually by authorized institutions taking into account the risk and return preferences of individuals. The comments and recommendations contained herein are of a general nature. These recommendations may not be suitable for your financial situation and risk and return preferences. Therefore, making an investment decision based solely on the information contained herein may not produce results in line with your expectations.
