
Fear & Greed Index
Source: Alternative
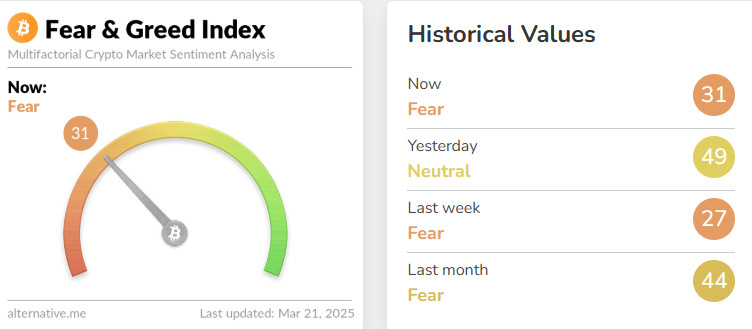
Change in Fear and Greed Value: +4
Last Week’s Level: 27
This Week’s Level: 31
This week, the Fear & Greed Index rose from 27 to 31. The FED’s decision to keep interest rates unchanged and maintain the expectation of an interest rate cut did not cause excessive concern in the market and supported the risk appetite to some extent. However, lowered economic growth expectations and higher inflation forecasts caused investors to maintain their cautious stance. In particular, signs of recession and stagflation risk were one of the factors limiting the rise in the index. While the expectation of an interest rate cut has a positive impact, the cautious mood continues due to economic uncertainties.
Fund Flow
Source: CoinShares
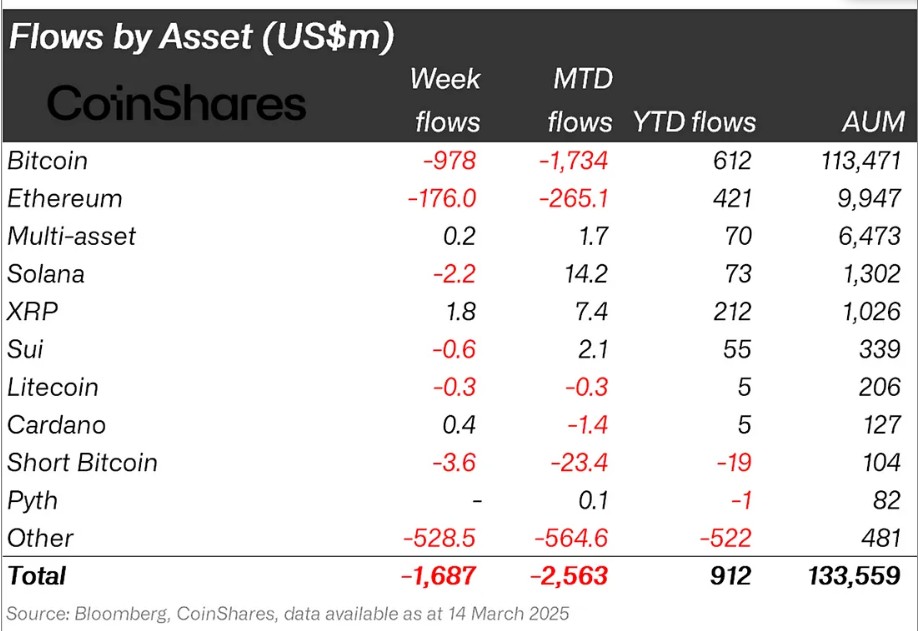
Overview: Markets experienced outflows totaling $1.7 billion this week amid Trump’s tariffs and policy uncertainty.
Fund Inputs
Multi-asset: Digital mutual funds saw one of the weakest fund inflows this week, totaling $0.2 million.
Ripple (XRP: Ripple CEO Brad Garlinghouse expects to launch the XRP ETF by the end of 2025 following the conclusion of the company’s legal battle with the SEC. With this news, Ripple saw an inflow of $1.8 million this week.
Cardano (ADA): Cardano holders sold more than 100 million $ADA last week. It saw an inflow of $0.4 million in the process.
Fund Outflows
Bitcoin (BTC): Bitcoin faced sharp selling pressure, falling from $87,000 to $82,000. With this decline, Bitcoin saw an outflow of $978 million last week.
Ethereum (ETH): Spot Ethereum ETFs experienced outflows of $53 million. The ETH network saw outflows of -$176 million.
Solana (SOL): Solana CME futures were launched. Volume remained at $12.1 million, showing a low momentum. Solana saw a total outflow of $2.2 million on this news.
SUI: Canary Files has filed a Form S-1 for the SUI ETF. This news saw an outflow of $0.6 million.
Litecoin(LTC): Litecoin fell 5.6% this week, leading the index lower. There were outflows of 0.3 million dollars this week.
Short Bitcoin: Outflows from short bitcoin positions totaled -$3.6 million.
Other: Altcoins saw outflows of $528 million.
Total MarketCap
Source: Tradingview
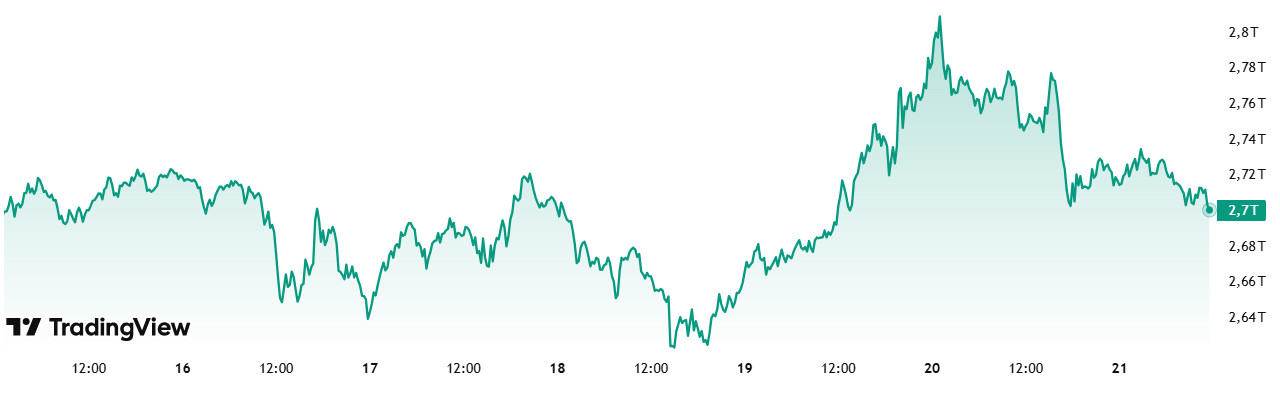
Last Week Market Capitalization: 2.65 trillion dollars
This Week Market Capitalization: 2.70 trillion dollars
The cryptocurrency market rallied by 1.54% last week, an increase of nearly $40 billion, and ended the week on a positive note. This week, although the total market capitalization started at $2.65 trillion, it rose to $2.80 trillion during the week. However, it was unable to surpass this level and fell back to $2.7 trillion. Compared to the beginning of the week, the market capitalization increased by $56.36 billion, an increase of 2.13%.
Total 2
Total 2 ended last week above the $1 trillion level with an increase of 0.30%. Total 2, which started the week with a market capitalization of $1.01 trillion, rose to $1.09 trillion during the week and then fell back to $1.04 trillion. Compared to the beginning of the week, the market capitalization increased by $24.77 billion, an increase of 2.44%.
Total 3
Total 3 realized an increase of 1.99% with a value increase of $15.68 billion. Accounting for 29.62% of the crypto market, Total 3 represented 27.82% of this week’s market gains.
This week, there has been an overall positive sentiment in the cryptocurrency market. Increases in Total 2 and Total 3 suggest that the major subgroups in the market are also rising. The fact that Total 2 remains above the $1 trillion mark and accounts for the bulk of Total 3’s gains is a promising sign for investors. The strong increases in total market capitalization and Total 3 in particular show that the altcoin market still has strong growth potential.
Bitcoin Dominance
Source: Tradingview
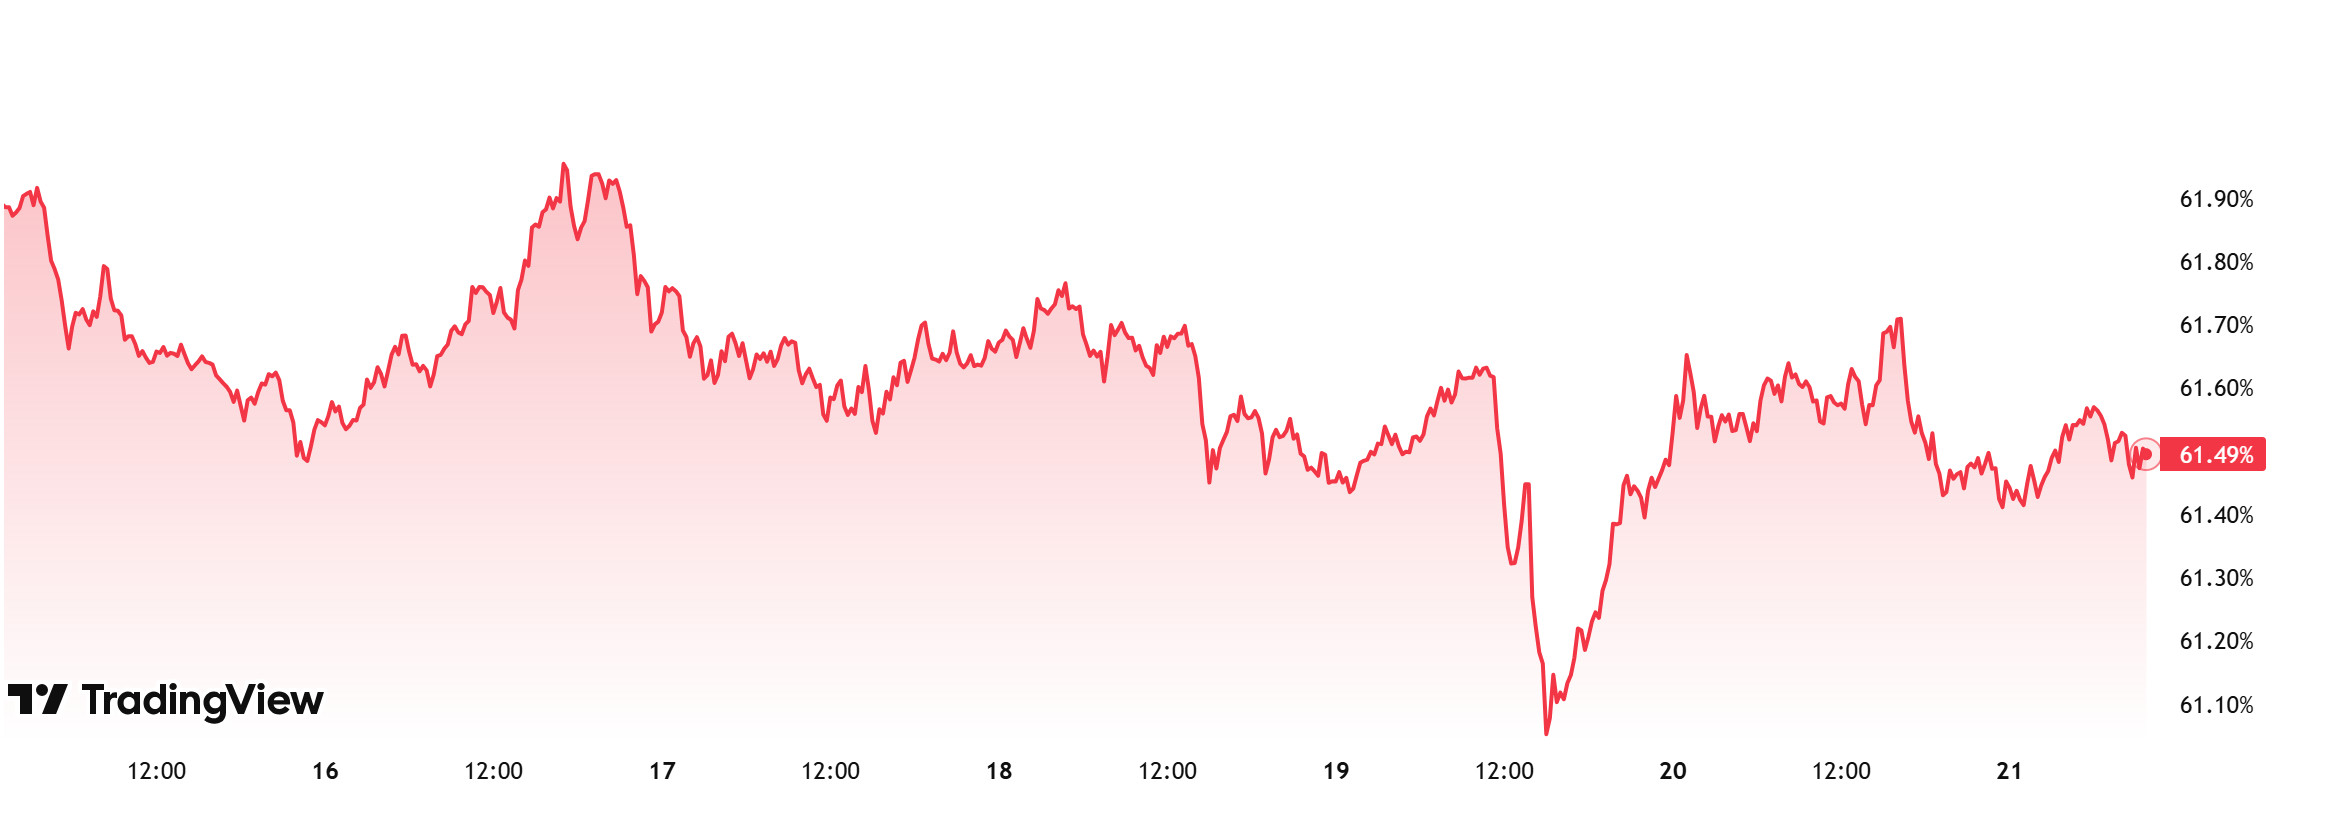
BTC dominance, which started the week at 61.76%, showed a downward trend during the week and is currently at 61.49%.
This week, the US Securities and Exchange Commission (SEC) announced that the first roundtable of the cryptocurrency working group will begin on March 21, 2025. In addition, US President Trump said in his speech at the Digital Asset Summit event that the US will become a leader in crypto and next-generation financial technologies. He also stated that the US dollar will maintain its position by expanding the dominance of the US dollar with dollar-based stablecoins and called for congress to pass the stablecoin law.
These developments may encourage institutional investors in particular and create an increase in buying appetite. As a result, we can expect BTC dominance to rise to 62% – 63% in the new week.
Ethereum Dominance
Source: Tradingview
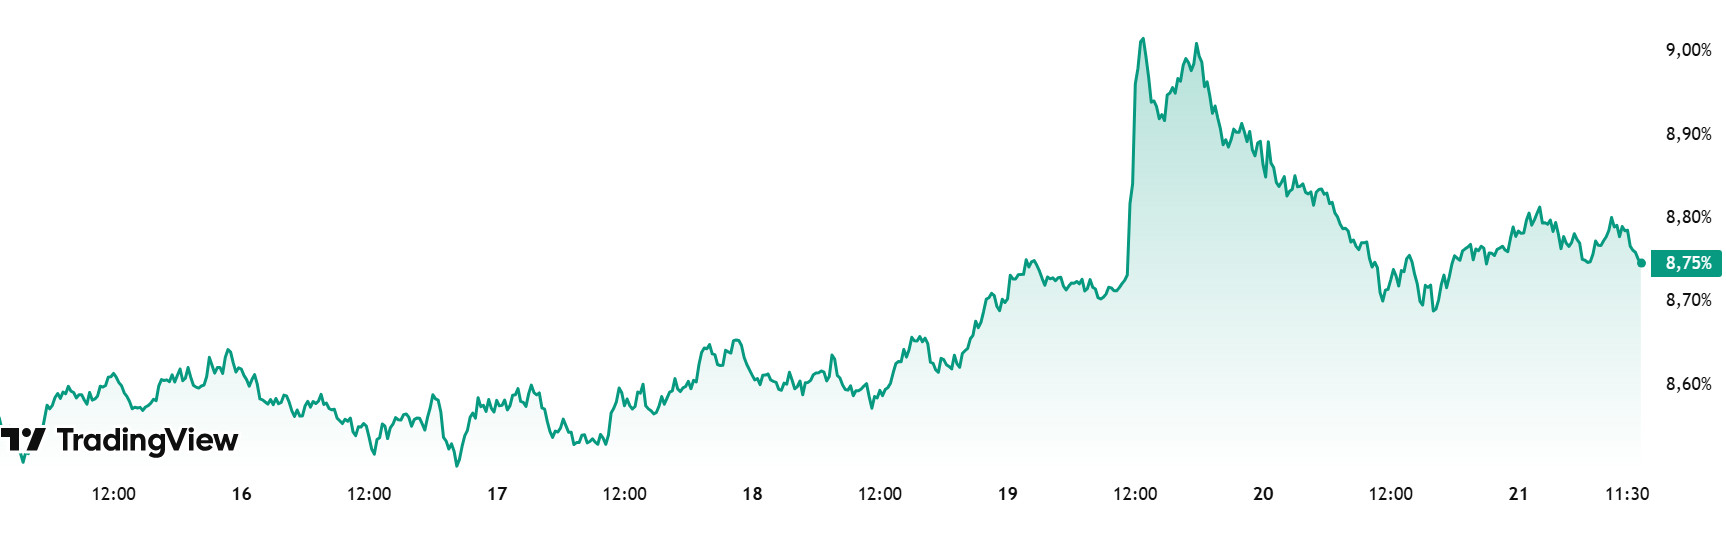
Weekly Change:
Last Week’s Level: 8.58%
This Week’s Level: 8.75%
Ethereum dominance recovered slightly to 10.88% after falling as low as 9.23% in the first week of February 2025. However, the dominance, which entered a downtrend again with the selling pressure in this region, continued to be significantly suppressed in the last three-week period. However, as of the current week, the dominance, which managed to hold above the 8.50% level, has gained some positive momentum.
Accordingly, Ethereum dominance, which rose to 8.88% as of the current week, gained a limited positive outlook on a weekly basis, with a total net outflow of $ 131.2 million in Spot Ethereum ETFs between March 14-20, 2025.
In the same period, a reverse movement was observed in Bitcoin dominance, and as of the last week, Ethereum dominance has exhibited a negative trend.
In this context, Ethereum dominance ended last week at 8.58% and is hovering around 8.75% as of the current week.
Bitcoin Spot ETF
Source: SosoValue
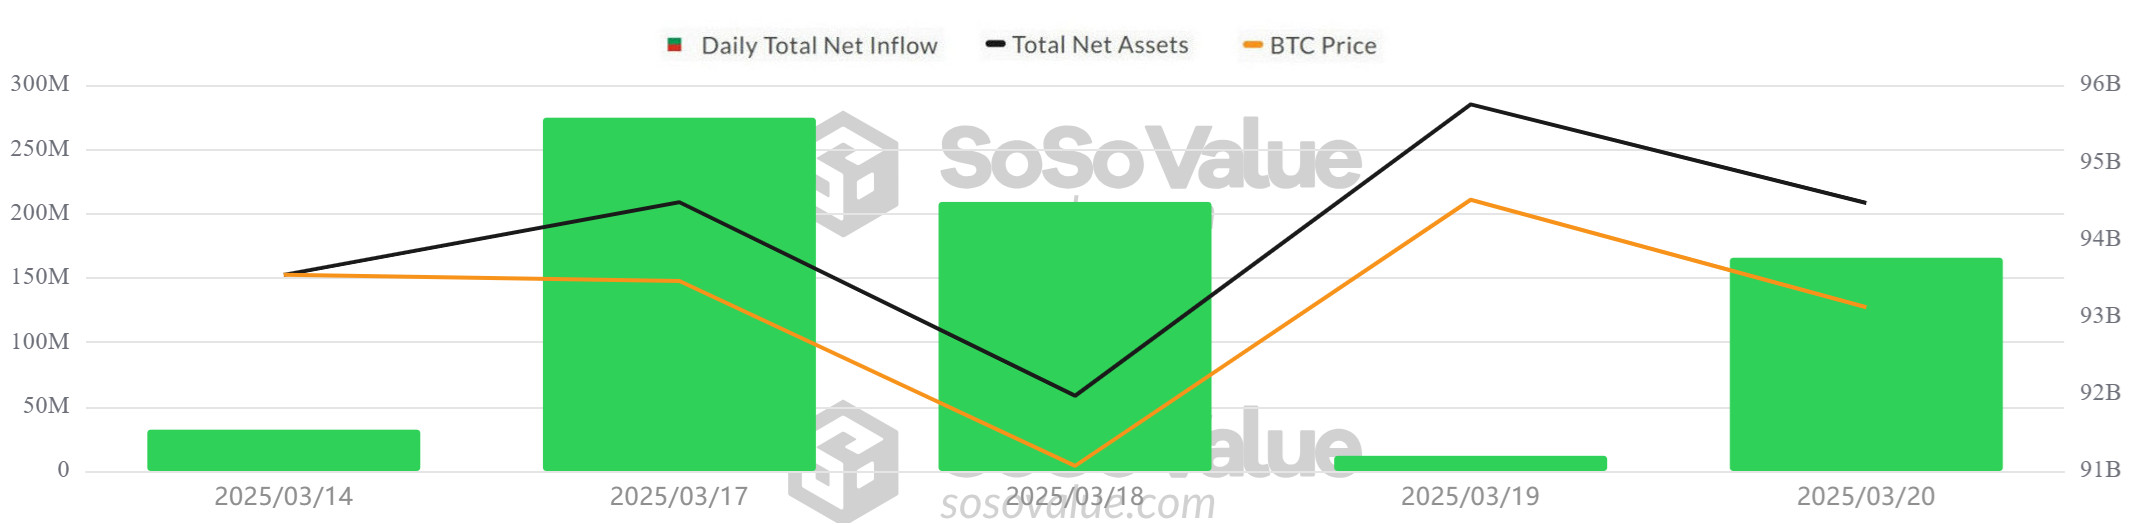
NetFlow Status: Spot Bitcoin ETFs saw a total net inflow of $702.5 million between March 14-20, 2025. Spot Bitcoin ETFs recorded net inflows for 5 consecutive days, signaling a recovery. BlackRock IBIT ETF and Ark ARKB ETF attracted attention with net inflows of $336.3 million and $180 million, respectively.
Bitcoin Price: Bitcoin, which opened daily at $81,115 on March 14, 2025, experienced a 3.83% increase on a weekly basis and closed daily at $84,223 on March 20. On March 19 , it reached $86,845, up 4.99% on a daily basis, reaching the highest daily closing level of the week. The increase in spot Bitcoin ETF inflows led to a positive momentum in the Bitcoin price.
Cumulative Net Inflows: Spot Bitcoin ETFs saw a total net inflow of $702.5 million between March 14-20, 2025, while cumulative net inflows reached $36.06 billion by the end of the 298th trading day.
| Date | Coin | Open Price | Close Price | Change % Price | ETF Flow (mil$) |
|---|---|---|---|---|---|
| 14-Mar-25 | BTC | 81,115 | 83,983 | 3.54% | 41.3 |
| 17-Mar-25 | BTC | 82,574 | 84,010 | 1.74% | 274.6 |
| 18-Mar-25 | BTC | 84,010 | 82,715 | -1.54% | 209.1 |
| 19-Mar-25 | BTC | 82,715 | 86,845 | 4.99% | 11.8 |
| 20-Mar-25 | BTC | 86,845 | 84,223 | -3.02% | 165.7 |
| Total for 14 – 20 Mar 25 | 3.83% | 702.5 | |||
In the period between March 14-20, 2025, the Bitcoin price increased, while Spot Bitcoin ETFs also saw net inflows. Although uncertainties in global markets persist, we have completed a week in which institutional investors’ confidence in risky assets began to recover, the wave of selling subsided and ETF inflows showed signs of recovery. Continued net inflows to Spot Bitcoin ETFs in the coming days may support the positive momentum in Bitcoin price. While market volatility is expected to continue in the short term, the direction of investor interest in the long term will continue to determine the trend of the market.
Ethereum spot ETF
Source: SosoValue
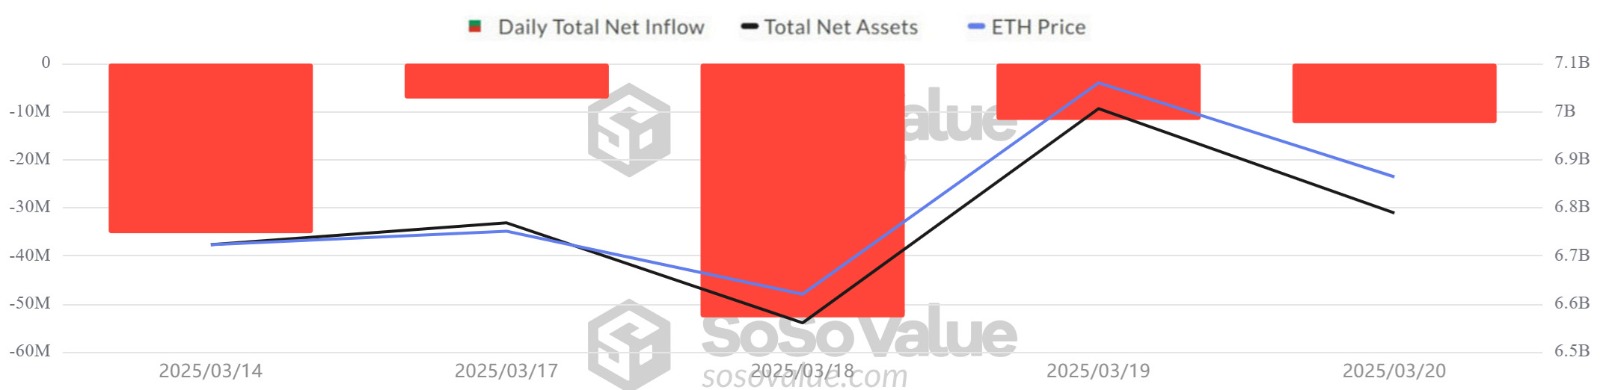
Between March 14-20, 2025, Spot Ethereum ETFs saw a total net outflow of $131.2 million. Outflows of $98.5 million from BlackRock ETHA ETF, $20.4 million from Fidelity FETH ETF and $17 million from Grayscale ETHE ETF attracted attention. Spot Ethereum ETFs experienced net outflows for the 12th consecutive time, with a total net outflow of $ 370.6 million in this process. At the end of the 166th trading day in Spot Ethereum ETFs, cumulative net inflows fell to $ 2.454 billion. Ethereum had a daily opening at $1,864 on March 14, 2025 and closed at $1,983 on March 20. On a weekly basis, ETH price increased by 6.38%.
| Date | Coin | Open Price | Close Price | Change % Price | ETF Flow (mil$) |
|---|---|---|---|---|---|
| 14-Mar-25 | ETH | 1,864 | 1,911 | 2.52% | -46.9 |
| 17-Mar-25 | ETH | 1,887 | 1,926 | 2.07% | -7.3 |
| 18-Mar-25 | ETH | 1,926 | 1,931 | 0.26% | -52.8 |
| 19-Mar-25 | ETH | 1,931 | 2,056 | 6.47% | -11.7 |
| 20-Mar-25 | ETH | 2,056 | 1,983 | -3.55% | -12.5 |
| Total for 14 – 20 Mar 25 | 6.38% | -131.2 | |||
Between March 14-20, Spot Ethereum ETFs saw continued net outflows as global economic uncertainty persisted. Although the risk aversion of institutional investors on Ethereum has increased, the rise in Ethereum price reveals that short-term buying has been effective and individual investors’ interest in the Ethereum ecosystem continues. If ETF outflows continue next week, selling pressure on the Ethereum price can be expected to increase. While the high volatility in the crypto market pushes investors to act cautiously, if ETF outflows continue, Ethereum may experience a retracement. On the other hand, improving macroeconomic conditions and a revival of institutional investor interest could support Ethereum’s medium and long-term recovery.
Bitcoin Options Breakdown
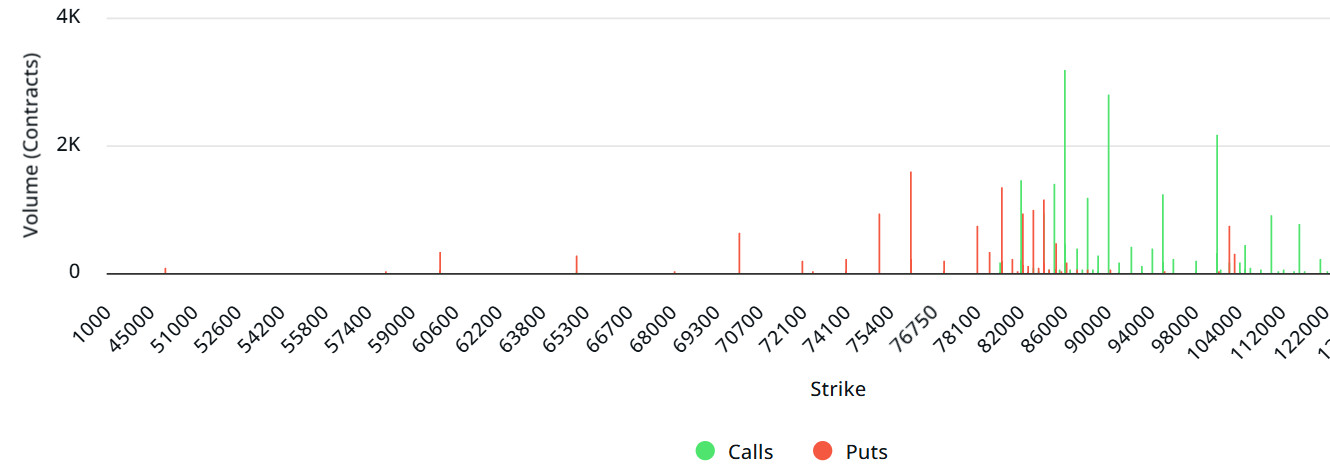
Source: Laevitas
Deribit Data
Deribit data shows that BTC options contracts with a notional value of approximately $1.8 billion expired today. At the same time, according to the data in the last 24 hours, if we look at the risk conversion in the next 1 month, put options are the dominant side in hedging more than call options. This indicates that the investor’s need for hedging against the decline has increased. When we look at the expected volatility, the fact that it is above the realized volatility is a bullish signal, but it shows us that call contract fees are expensive, whereas the contract fees of put options are low.
Laevitas Data
When we examine the chart, it is seen that put options are concentrated in the $ 76,000 – 84,000 band. Call options are concentrated between $ 82,000 – $ 95,000 and the concentration decreases towards the upper levels. At the same time, the level of about $ 82,000 is seen as support and the level of $ 86,000 as resistance. On the other hand, there are 1.57K put options at the $ 76,000 level, where there is a peak and there is a decrease in put volume after this level. However, at the $90,000 level, call options peaked at 2.77K units. When we look at the options market, we see that the market is in the decision-making process. Although there is a slight bear dominance, the slight upward signs in the open interest data in the coming period show us that the rise is not far away.
Option Expiration
Put/Call Ratio and Maximum Pain Point: In the last 7 days data from Laevitas, the number of call options decreased by 32% to 81.79K compared to last week. In contrast, the number of put options decreased by 43% to 55.12K. The put/call ratio for options was set at 0.70. A put/call ratio of 0.70 indicates that call options are more dominant among investors. Bitcoin’s maximum pain point is set at $85,000. At the time of writing, BTC was priced at $ 84,107 and we can say that if it exceeds the pain point of $ 85,000, we can say that the rises can start. In the next 7 days, there are 2.78K call and 2.39K put options at the time of writing.
Ethereum Options Distribution
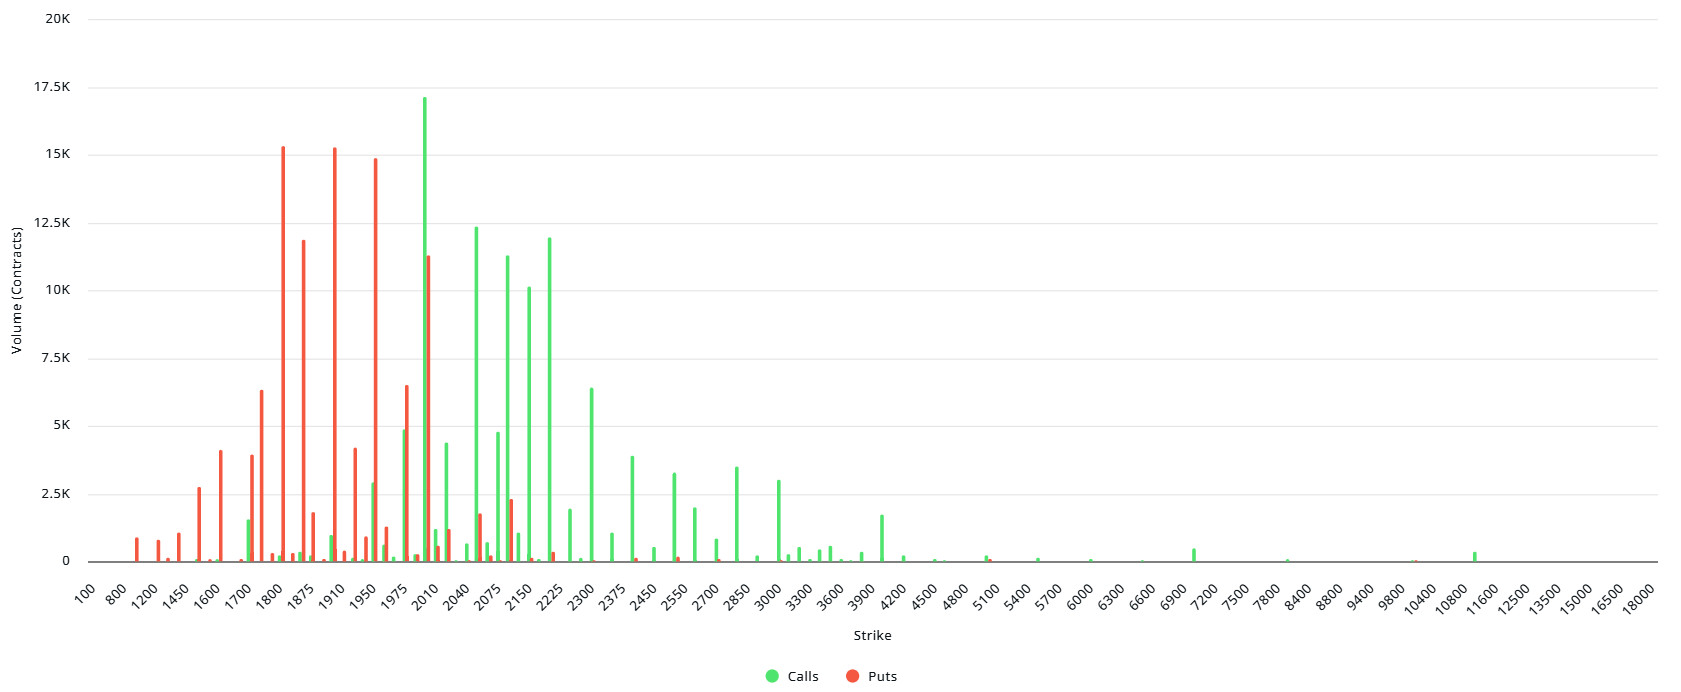
Source: Laevitas
Laevitas Data: When we examine the chart, it is seen that Put options are concentrated in the band between $ 1,775 – $ 1,875. There are about 12.4K Put options at the $1,800 level, where the volume peaks and the Put volume decreases after this level. This suggests that the $1.875 level is seen as a strong support. On the other hand, Call options are concentrated between $2,000 and $2,200 and the concentration decreases towards the upper levels. Especially at the $2,000 level, there are approximately 14.69K Call options. This shows that this level stands out as an important resistance. In addition, there is significant activity in both Call and Put options in the $1,900 – $2,000 range, indicating that the market sees this level as a decision-making zone. Although there is a slight bearish dominance, the open interest data in the options market shows signs of a slight increase, indicating that the market may be preparing for a rise.
Deribit Data: 129,099 Ethereum options contracts expired today. The notional value of these options was $259 million with a maximum pain point of $2,000. The Put/Call Ratio was realized as 0.60. At the time of writing, the ETH price is hovering in the $1,968 band, while the persistence above our maximum pain point of $2,000 will have the potential to accelerate the upward momentum of the price.
Legal Notice
The investment information, comments and recommendations contained in this document do not constitute investment advisory services. Investment advisory services are provided by authorized institutions on a personal basis, taking into account the risk and return preferences of individuals. The comments and recommendations contained in this document are of a general type. These recommendations may not be suitable for your financial situation and risk and return preferences. Therefore, making an investment decision based solely on the information contained in this document may not result in results that are in line with your expectations.
