
TECHNICAL ANALYSIS
BTC/USDT
The US government holds a total of $17.6 billion worth of cryptocurrency, with the largest asset being Bitcoin with 198,000 BTC. Fed President Kugler signaled that interest rates could remain stable for a long time, while the Trump family’s crypto project, the USD1 stablecoin, will be launched. On the other hand, KULR Technology acquired another 56.3 BTC for $5 million, bringing its total Bitcoin holdings to 668 BTC.
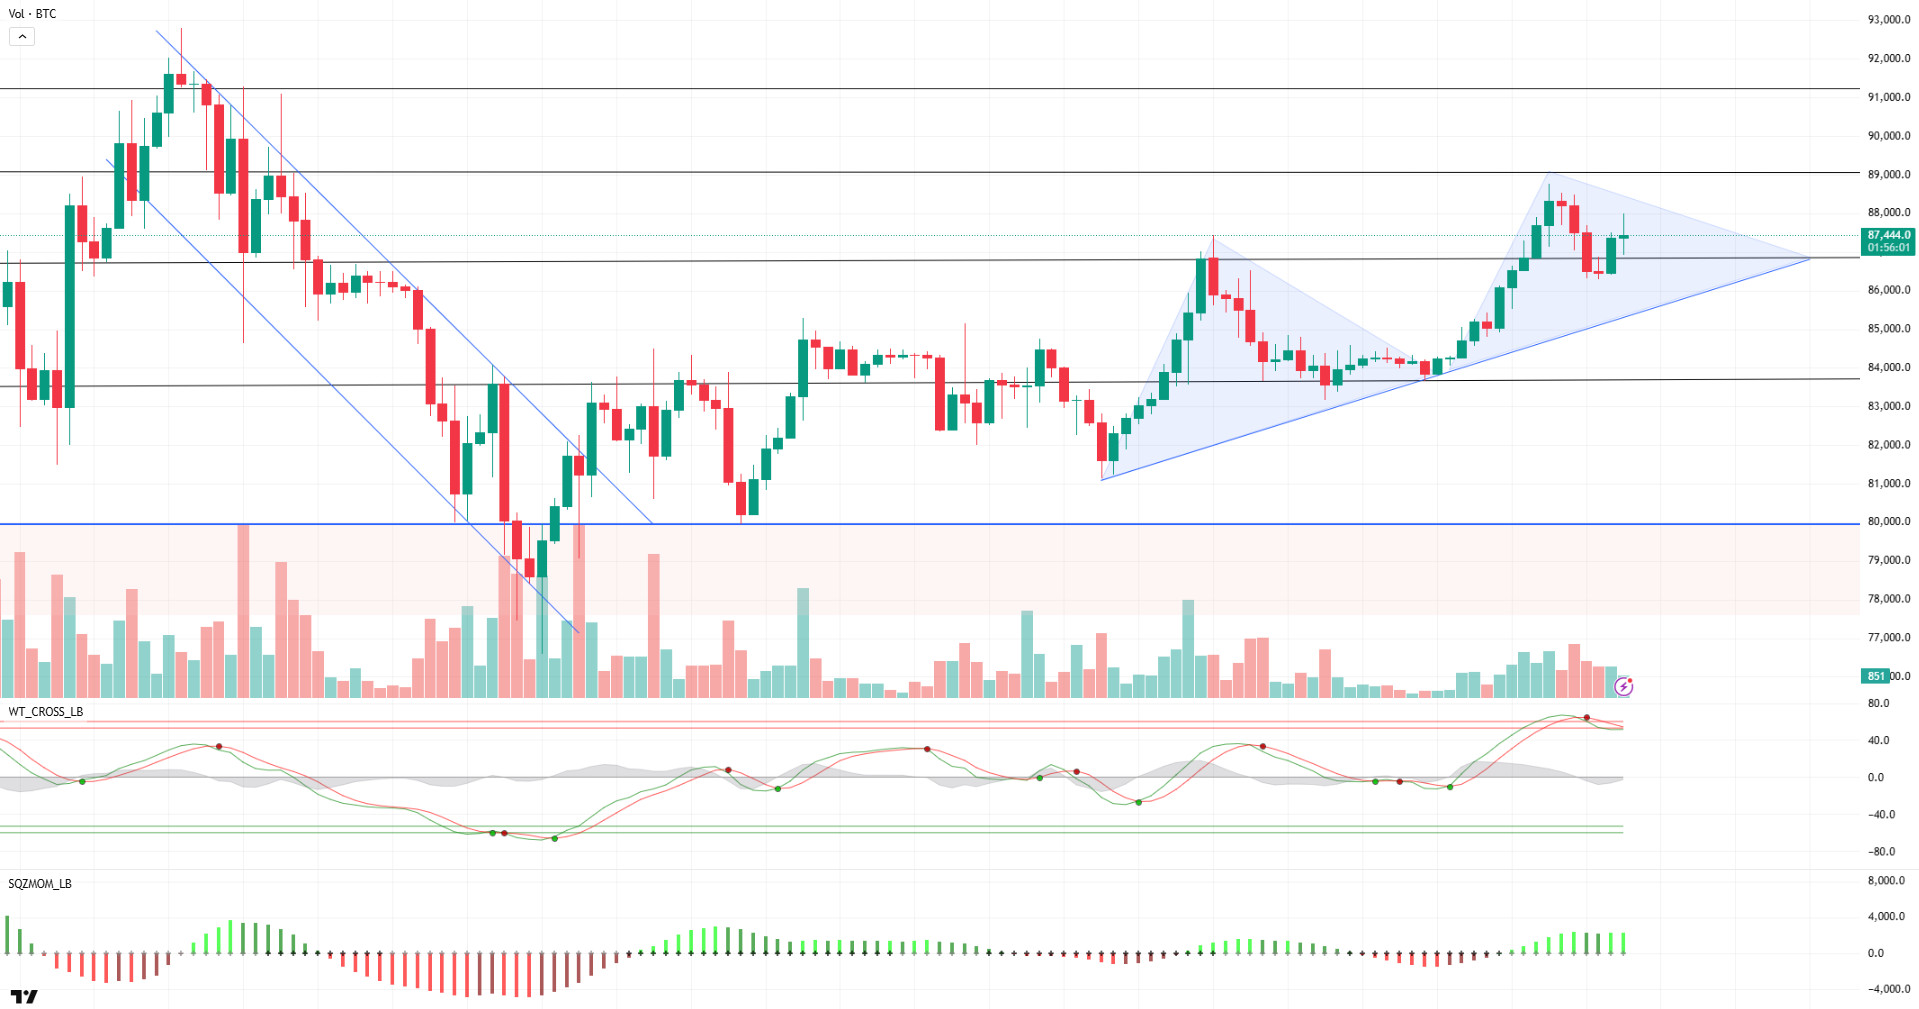
Looking at BTC’s technical outlook, it seems that it managed to recover even though it fell below the 86,600-support level during the day. At the time of writing, BTC was trading at 87,400 and its correlation with traditional markets pushed the price back up. In particular, it has a strong correlation of 0.71 with the Nasdaq and 0.67 with the S&P 500, indicating that movements in the US markets have a direct impact on the direction of BTC. This also proves that Bitcoin is becoming more and more integrated into traditional financial markets. Despite the sell signal in the overbought area of the Wave Trend Oscillator in the previous analysis, the sell signal appears to be weakening. Momentum indicators also support the price, suggesting that BTC continues to be in demand. BTC’s 200-day moving average (MA) reached 86,600, while the Mayer Multiple was calculated at 1.03. This is below the average Mayer Multiple of 1.36. This suggests that BTC is pricing at historically low levels, while pricing below the 85,000 level is in cheap territory for BTC. Liquidation data shows that long trades below 85,000 continue to attract attention in a possible wave of selling, while remaining a barrier to a steeper rally. On the other hand, if the uptrend continues, the 89,000 level will be followed as a resistance level.
Supports 86,600 – 83,500 – 82,400
Resistances 89,000 – 91,400 – 92,800
ETH/USDT
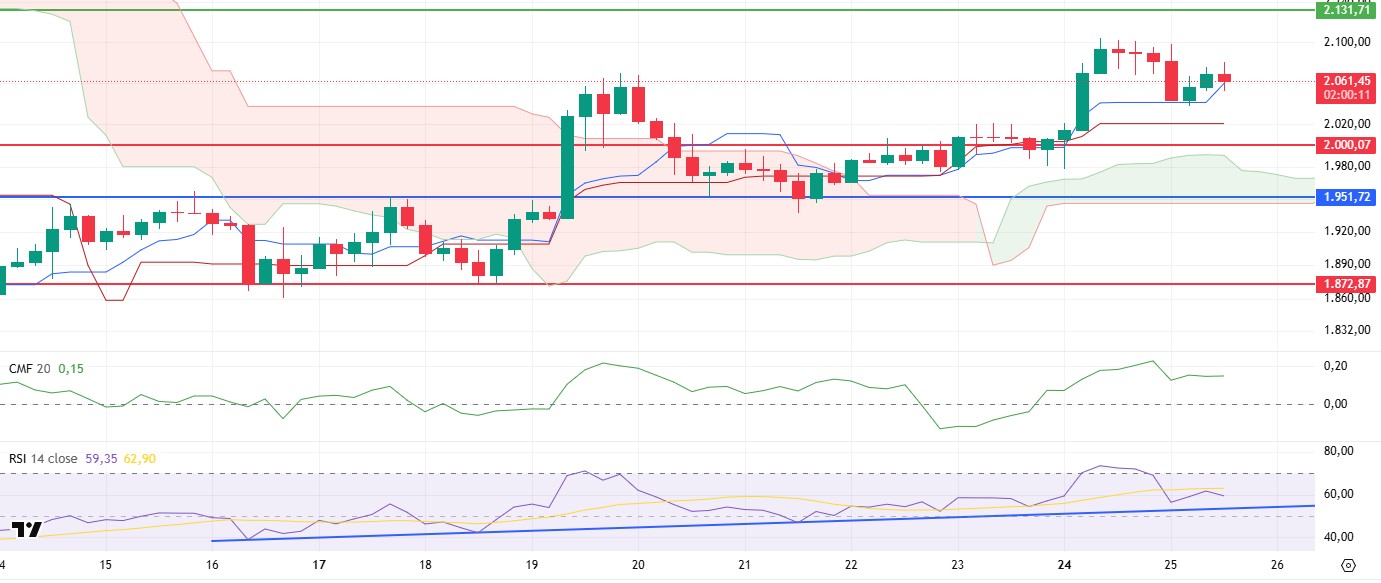
ETH continued its upward movement by maintaining its tenkan level during the day with the effect of the positive opening of the US markets and managed to rise up to $2,080. In the current market conditions, where technical indicators are largely flat, ETH’s price targets remain unchanged.
When analyzed within the scope of technical analysis, it is seen that despite the low trading volume, the Chaikin Money Flow (CMF) indicator displays a slightly positive and horizontal outlook, indicating that the buyer-seller balance has formed. While CMF remains structurally positive, it indicates that there is no strong selling pressure in the market. When the Relative Strength Index (RSI) is analyzed, it is observed that despite the correction in the overbought zone, it managed to stay above the trend line and did not show any negative divergence. This suggests that ETH maintains its positive structure within the current trend and technically maintains its upside potential. In terms of the Ichimoku indicator, the fact that ETH did not lose the Tenkan level and the price hovered above the Ichimoku cloud (Kumo), Kijun and Tenkan levels indicates that the positive structure continues. This technical pattern can be interpreted as the overall market bias is still to the upside.
Current indicators suggest that ETH maintains its positive outlook and is likely to continue its upward movement as long as it stays above critical support levels. Slight increases can be expected to continue during the remaining hours of the day. The resistance point at $2,134 is likely to be tested, especially if the Tenkan level is maintained. Breaching this area could trigger stronger rallies in ETH and push the price to higher resistance levels. However, the possible loss of the Tenkan level could cause the price to retrace back towards the $2,000 level.
Supports 2,000 – 1,951 – 1,872
Resistances 2,131 – 2,254 – 2,507
XRP/USDT
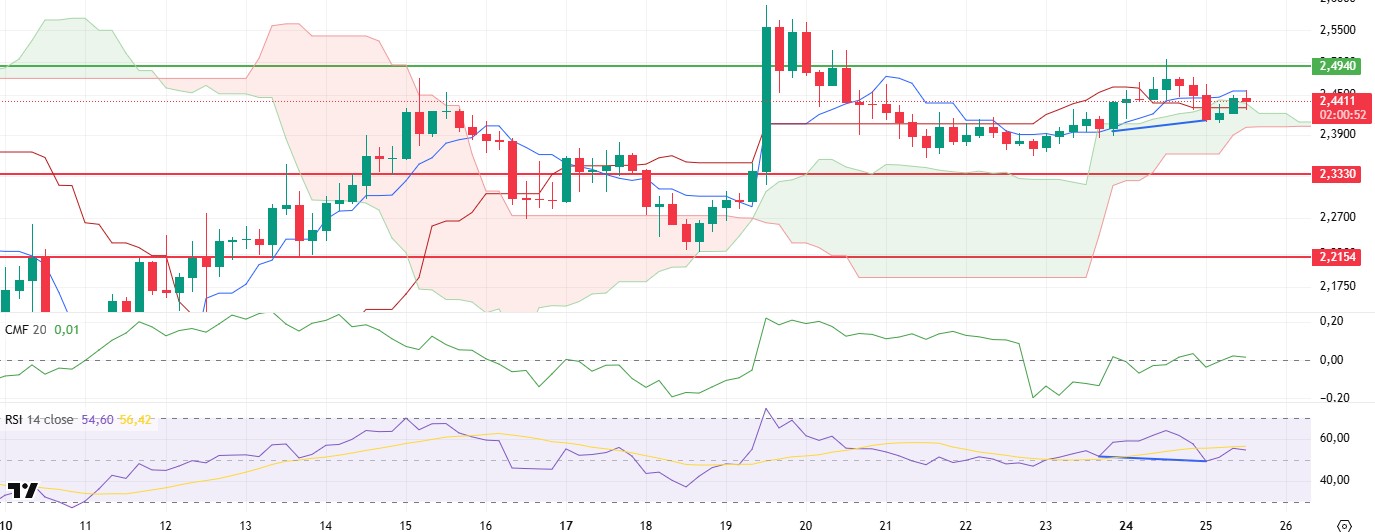
XRP rose to the tenkan level of $2.455 during the day. After its rise to this region, it experienced a slight pullback due to the volatility at the US opening, but technical indicators and on-chain data suggest that the upward movement may continue.
The fact that the Chaikin Money Flow (CMF) indicator did not lose the positive area, and the Cumulative Volume Delta (CVD) data showed that spot purchases continued to rise can be interpreted as an important sign that the positive structure is maintained. In the Ichimoku indicator, the price rising above the kumo cloud strengthens the positive outlook, but it can be said that the pricing between tenkan and kijun levels creates uncertainty. Looking at the Relative Strength Index (RSI) indicator, it is seen that the positive divergence mentioned in the morning analysis is working, and the price and RSI are moving upwards.
As a result, another attack to the $2.49 levels can be expected later in the day, provided that the kumo cloud boundaries are not violated. The breakout of this resistance level may bring more drastic rises. Violation of the Kumo cloud boundaries may cause some retracement.
Supports 2.3330 – 2.2154 – 2.0201
Resistances 2.4940 – 2.6269 – 2.8280
SOL/USDT
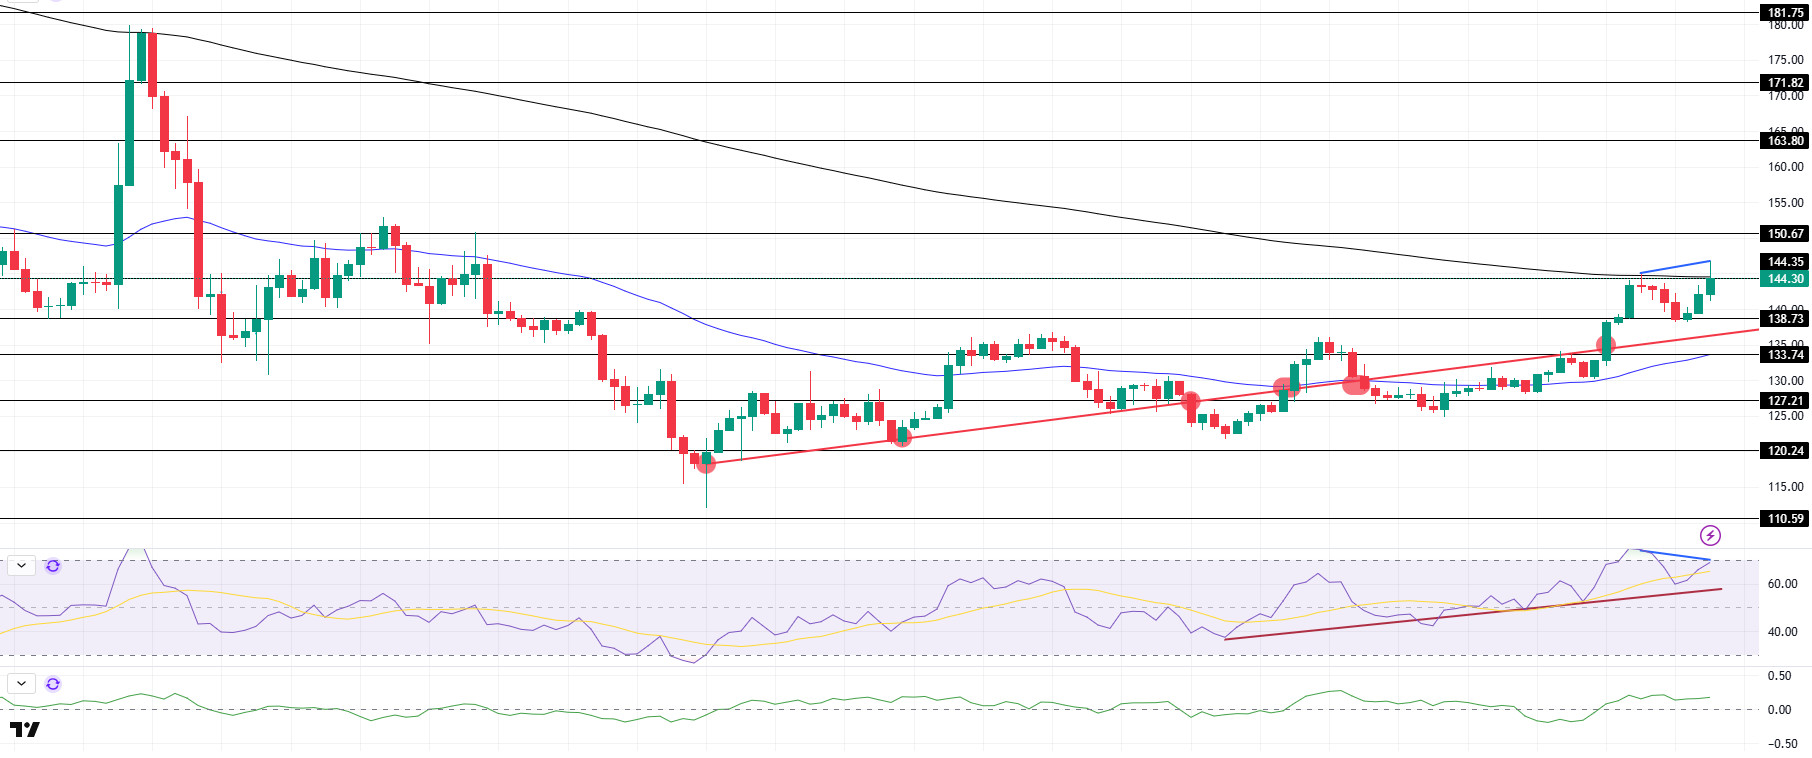
Pump. Fun’s new DEX hits $1 billion in volume one week after launch. SOL has been bullish since our morning analysis. The asset had turned bearish after hitting strong resistance at $144.35. This level also coincided with the 200 EMA (Black Line). The asset, which continues to rise by accelerating from its strong support at $138.73, is currently testing the 200 EMA as resistance. If it breaks here, it can test the strong resistance level of $163.80. On the 4-hour timeframe, the 50 EMA (Blue Line) remained below the 200 EMA (Black Line). This could deepen the decline further in the medium term. At the same time, the price is moving between the two moving averages again. The Chaikin Money Flow (CMF)20 indicator is in positive territory, but the negative daily volume may reduce inflows and move CMF into negative territory. However, the Relative Strength Index (RSI)14 indicator retreated from the overbought zone to the mid-level of the positive zone. This may have reduced the selling pressure for the asset to move higher. At the same time, bearish divergence should be taken into account. The $150.67 level appears as a resistance point in the rises driven by both the upcoming macroeconomic data and the news in the Solana ecosystem. If it breaks here, the rise may continue. In case of retracements for the opposite reasons or due to profit sales, the support level of $133.74 can be triggered. If the price comes to these support levels, a potential bullish opportunity may arise if momentum increases.
Supports 138.73 – 133.74 – 127.21
Resistances 144.35 – 150.67 – 163.80
DOGE/USDT
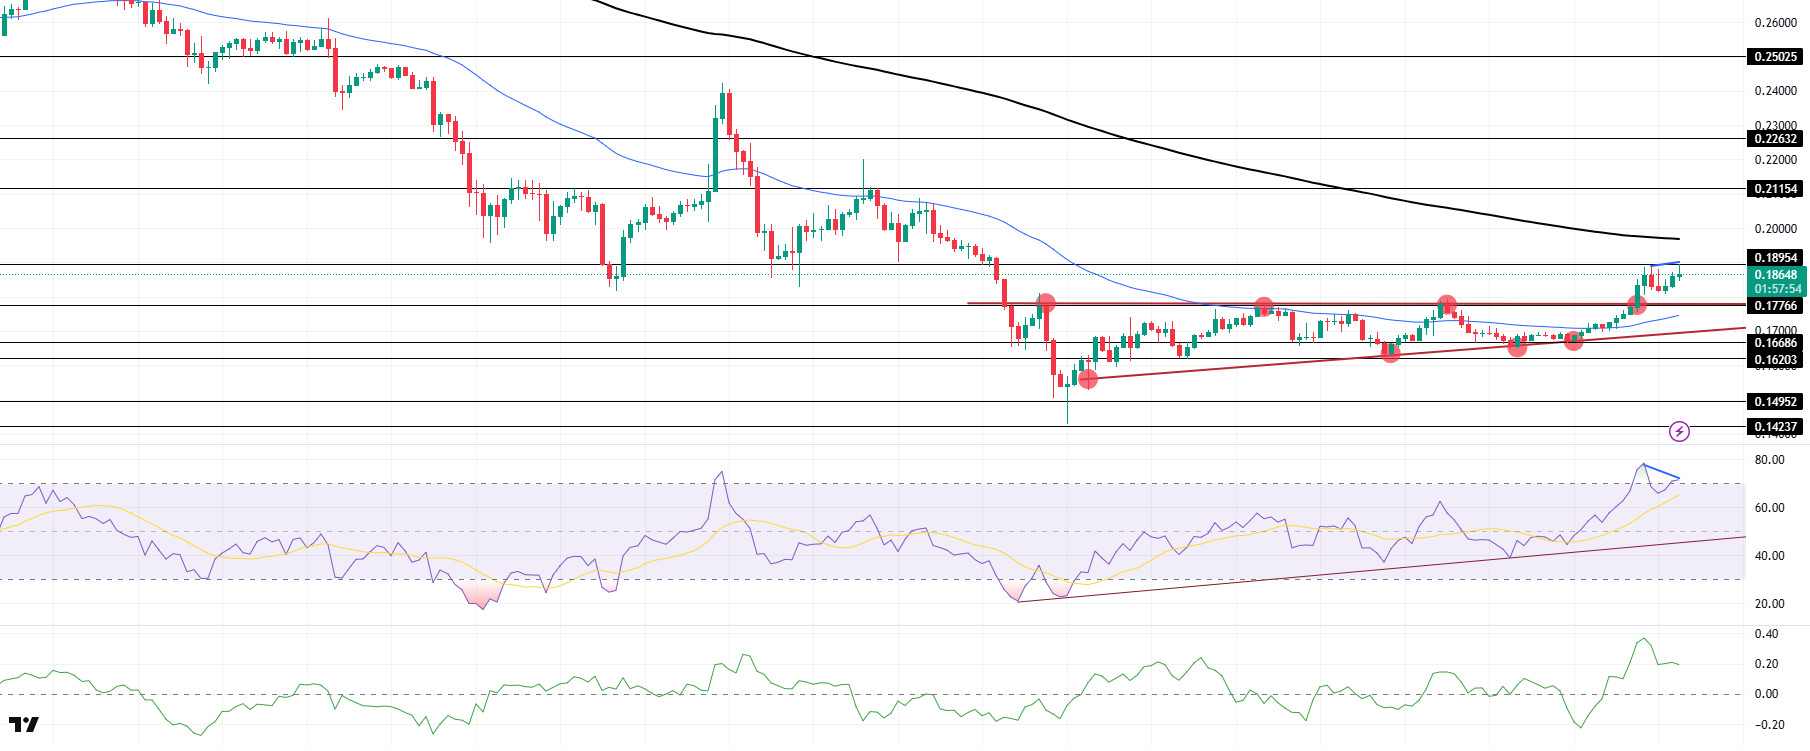
DOGE was slightly bullish after our analysis in the morning. Breaking the ascending triangle pattern to the upside, the asset stuck at the strong resistance at $0.18954. On the 4-hour timeframe, the 50 EMA (Blue Line) is below the 200 EMA (Black Line). This could mean that the decline could deepen in the medium term. However, the price has started to price between the two moving averages. The Chaikin Money Flow (CMF)20 indicator is in positive territory. In addition, the fact that the 24-hour volume is on the plus side may increase inflows, allowing CMF to reach the higher zone. On the other hand, Relative Strength Index (RSI)14 is positioned at the overbought level. This may cause pullbacks. At the same time, bearish divergence should be taken into account. The level of $0.18954 dollars appears as a very strong resistance place in the rises due to political reasons, macroeconomic data and innovations in the DOGE coin. In case of possible retracements due to political, macroeconomic reasons or due to negativities in the ecosystem, the $0.17766 level, which is a strong support place, is an important support place. If the price comes to these support levels, a potential bullish opportunity may arise if momentum increases.
Supports 0.17766 – 0.16686 – 0.16203
Resistances 0.18954 – 0.21154 – 0.22632
Legal Notice
The investment information, comments and recommendations contained herein do not constitute investment advice. Investment advisory services are provided individually by authorized institutions taking into account the risk and return preferences of individuals. The comments and recommendations contained herein are of a general nature. These recommendations may not be suitable for your financial situation and risk and return preferences. Therefore, making an investment decision based solely on the information contained herein may not produce results in line with your expectations.
