Fear & Greed Index

Source: Alternative
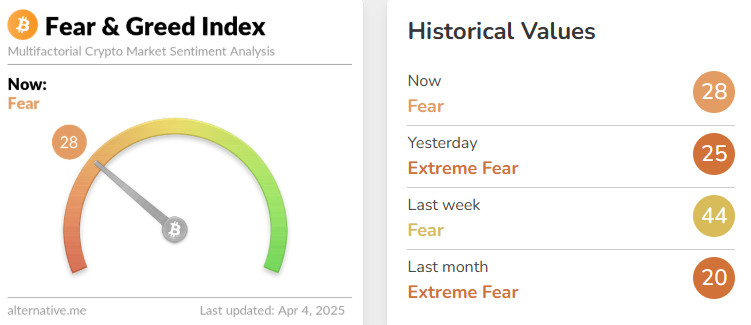
Change in Fear and Greed Value: -16
Last Week Level: 44
This Week’s Level: 28
This week, the index fell from 44 to 28, reflecting growing uncertainty in the market. Although MicroStrategy’s $1.92 billion purchase of Bitcoin showed the strength of institutional demand, global economic developments weakened risk appetite. China’s move to restrict US investments in response to Trump’s tariffs raised concerns that global trade wars could deepen. The new tariffs announced by the US also increased uncertainty in the markets and accelerated the flight from risky assets. In particular, the loss of 2 trillion dollars from the US stock markets after Trump’s policies signaled a serious weakening in investor confidence. Global trade tensions and economic uncertainties increased pressure on risky assets, including Bitcoin, negatively impacting market sentiment. Overall, although institutional buying provided short-term support, broader economic uncertainty and trade policy risks continue to weigh on the index.
Found Flow

Source: CoinShares
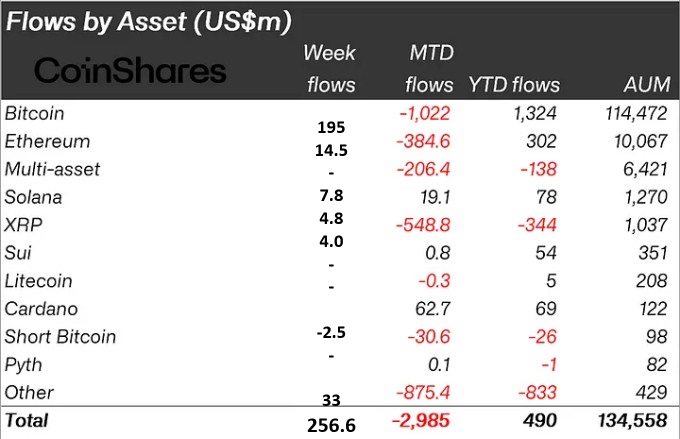
Overview: Trump’s announcement of new tariffs on April 2 saw inflows of $256 million into digital asset investment products this week, indicating a renewed positive sentiment, but investors remain cautious.
Fund Inputs:
Bitcoin (BTC): Trump announced a general 10% tariff on all countries. Bitcoin rose back to the $88,000 level. With this news, Bitcoin saw inflows totaling $195 million this week.
Ethereum (ETH): US President Donald Trump’s statements on tariffs caused a sharp selloff in global markets. With increased uncertainty and risk aversion, ETH fell as low as $1,780. After this sharp drop, the price tended to recover above the $1,822 level. With this recovery in price, the ETH network saw a total inflow of $14.5 million this week.
Solana (SOL): Solana saw an inflow of $7.8 million this week, reaching the highest DEX trading volume among all Blockchains.
Ripple (XRP): Rising to $2.21, it gave the expected reaction in parallel with the general rise in the markets. It saw an inflow of $4.8 million this week.
SUI: Inflows of $4.0 million this week, influenced by market dynamics.
Other: Trump’s trade policies have caused volatility in the prices of Bitcoin and other major crypto assets, leading to a total inflow of $33 million in altcoins this week.
Fund Outflows
Short Bitcoin: Outflows from short bitcoin positions totalled $2.5 million.
Total MarketCap

Source: Tradingview
Last Week Market Capitalization: 2.63 trillion Dollars
This Week Market Capitalization: 2.62 trillion Dollars
Last week, the cryptocurrency market fell by 4.99% with a loss of approximately $138.01 billion and ended the week negatively. This week, starting from a total market capitalization of $2.63 trillion, there was a decline of 0.28% with a loss of $7 billion and the market capitalization stands at $2.62 trillion. For the last 5 weeks, price action has occasionally dipped below the 50-week moving average, but the week’s closes have been above this level. Therefore, the critical threshold for the Total chart could be considered as no weekly close below the $2.6 trillion level.
Total 2
Total 2 ended last week below the $1 trillion level with a loss of 6.09%. Total 2, which started the new week with a market capitalization of 992 billion dollars, rose to 1.04 trillion dollars during the week and then fell below 1 trillion dollars again with the US tariff announcements. Compared to the beginning of the week, the market capitalization fell by 1.93% with a loss of $19.15 billion.
Total 3
Last week, it lost $ 40.33 billion in value, a decline of 4.95%. Total 3, which started the new week at $ 744.18 billion, fell 2.29% with a loss of $ 17.69 billion.
This week, there has been a negative sentiment in the cryptocurrency market in general. The general selling pressure in the market has led to significant losses in altcoin groups. However, large market capitalization cryptocurrencies such as Bitcoin and Ethereum have seen a relatively limited decline, suggesting that the market still has the potential for an overall recovery.
Bitcoin Dominance

Source: Tradingview
Bitcoin Dominance
BTC dominance, which started the week at 62.22%, rose throughout the week to 63.08% and is currently at 62.82%.
Franklin Templeton, which manages $1.5 trillion in assets, is preparing to launch Bitcoin and cryptocurrency-focused exchange-traded products (ETPs) in Europe. GameStop issued $1.5 billion in bonds to buy Bitcoin. In addition, 22,048 Bitcoin were purchased by Strategy and 160 Bitcoin were purchased by Metaplanet this week. When we analyze Bitcoin spot ETFs, it is seen that money outflows were generally experienced this week.
If US President Trump takes positive steps regarding the tariffs expected to start next week, there may be some further increase in the buying appetite of institutional and ETF investors. In light of these developments, we can expect BTC dominance to rise to 63.5% – 64.5% levels in the new week.
Ethereum Dominance

Source: Tradingview
Last Week’s Level: 8.30%
This Week’s Level: 8.29%
Ethereum dominance, after surging to a high of 10.88% in mid-February 2025, resumed a bearish trend in the last week of February with selling pressure in this area and has continued to be significantly suppressed over the past five-week period.
In this direction, Ethereum dominance, which moved below the 8.50% level followed as of the current week, continued its negative outlook on a weekly basis, with a total net outflow of $ 47.4 million from Spot Ethereum ETFs between March 28 and April 3, 2025.
In the same period, a reverse movement was observed in Bitcoin dominance, and as of the last week, a positive trend has been exhibited in contrast to Ethereum dominance.
In this context, Ethereum dominance ended last week at 8.30%, while it is hovering at 8.29% as of the current week.
Bitcoin Spot ETF

Source: SosoValue
Netflow Status: Between March 28 and April 03, 2025, Spot Bitcoin ETFs saw a total net outflow of $193.3 million. The 10-day streak of positive net inflows ended on March 28, the first trading day of the week. On a weekly basis, Fidelity FBTC ETF with $83.1 million, Grayscale GBTC ETF with $70.3 million and BlackRock IBIT ETF with $35.5 million were the notable ETFs with net outflows.
Bitcoin Price: Bitcoin, which opened daily at $87,232 on March 28, 2025, fell 4.61% on a weekly basis and closed at $83,213 on April 03. The sharpest decline of the week was on March 28, falling 3.22% to $84,424. Outflows from spot Bitcoin ETFs led to a negative momentum in the Bitcoin price.
Cumulative Net Inflows: Spot Bitcoin ETFs saw a total net outflow of $193.3 million between March 28 and April 03, 2025, while cumulative net inflows fell to $36.234 billion by the end of the 308th trading day.
| Date | Open Price (USD) | Close Price (USD) | Change (%) | ETF Flow (Million USD) |
|---|---|---|---|---|
| March 28, 2025, | 87,232 | 84,424 | -3.22% | -93.2 |
| March 31, 2025, | 82,390 | 82,550 | 0.19% | -60.6 |
| April 1, 2025, | 82,550 | 85,158 | 3.16% | -157.8 |
| April 2, 2025, | 85,158 | 82,516 | -3.10% | 218.1 |
| April 3, 2025, | 82,516 | 83,213 | 0.84% | -99.8 |
| Total (March 28 – April 3, 2025) | -4.61% | -193.3 | ||
Between March 28 and April 3, 2025, both price and ETF inflows weakened on a weekly basis. US President Donald Trump’s imposition of tariffs on April 2, 2025 increased uncertainty in global markets. If global economic wars intensify and political uncertainties deepen in the coming days, outflows from Spot Bitcoin ETFs are likely to accelerate. This may re-trigger selling pressure in the Bitcoin price. Volatility may continue in the short term.
Ethereum spot ETF

Source: SosoValue
Between March 28 and April 3, 2025, Spot Ethereum ETFs saw net outflows totaling $47.4 million. The most notable outflows were -$20.2 million from BlackRock ETHA ETF, -$26.4 million from Grayscale ETHE ETF and -$6.2 million from Bitwise ETHW ETF, while only Fidelity FETH ETF saw a net inflow of $6.4 million. Spot Ethereum ETFs’ total net inflows at the end of the 176th trading day fell to $2.375 billion.
| Date | Open Price (USD) | Close Price (USD) | Change (%) | ETF Flow (Million USD) |
|---|---|---|---|---|
| March 28, 2025, | 2,003 | 1,896 | -5.34% | 4.7 |
| March 31, 2025 | 1,807 | 1,822 | 0.83% | 6.4 |
| April 1, 2025 | 1,822 | 1,904 | 4.50% | -3.6 |
| April 2, 2025 | 1,904 | 1,795 | -5.72% | -51.3 |
| April 3, 2025 | 1,795 | 1,817 | 1.23% | -3.6 |
| Total (March 28 – April 3, 2025) | -9.29% | -47.4 | ||
Between March 28 and April 3, 2025, the most notable outflow day was April 2, 2025, which US President Donald Trump declared as America’s “Independence Day” and officially implemented tariffs. On this date, Spot Ethereum ETFs saw outflows totaling $51.3 million. These outflows in ETFs put downward pressure on the Ethereum price. While institutional investors were seen to stay away from the market this week, high volatility in prices attracted attention. On the other hand, Ethereum developers postponed the Pectra update to May 7. This update, which is expected to contribute positively to the Ethereum network, may create positive expectations in the market. With the approach of the update, it may be possible to increase inflows to Spot Ethereum ETFs and create a recovery effect on the Ethereum price.
Bitcoin Options Breakdown

Source: Laevitas
$BTC: Notional: $2.19B | Put/Call: 1.88 | Max Pain: $83K
Deribit Data: Deribit data shows that BTC options contracts with a notional value of approximately $2.19 billion expired today. At the same time, according to the data in the last 24 hours, if we look at the risk conversion in the next 1 week, put options are the dominant side in hedging more than call options. This indicates that the investor’s need to hedge against the decline has increased. When we look at the expected volatility, the fact that it is slightly above the realized volatility is a bullish signal, but it shows us that call contract fees are expensive, while the contract fees of put options are low. At the same time, the fact that the two volatility values are close to each other shows us that there may not be much movement on the option side.
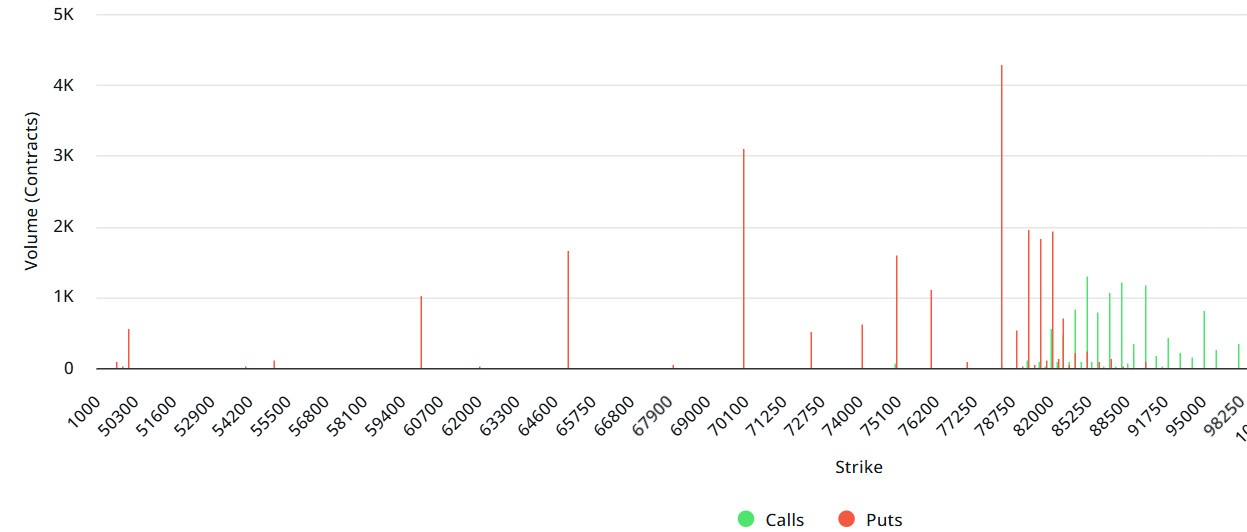
Laevitas Data: When we examine the chart, we see that put options are concentrated in the $ 75,000 – $ 83,000 band. Call options are concentrated between the levels of 83,000 – 95,000 dollars and the concentration decreases towards the upper levels. At the same time, the level of approximately 78,000 dollars is seen as support and the level of 85,000 dollars as resistance. On the other hand, there are 5.23K put options at the $ 78,000 level, where there is a peak and there is a decrease in put volume after this level. However, at the $85,000 level, call options peaked at 1.82K units. When we look at the options market, we see that the selling pressure continues on a daily and weekly basis.
Option Expiration
Put/Call Ratio and Maximum Pain Point: In the last 7 days of data from Laevitas, the number of call options increased by 40% compared to last week to 84.35K. In contrast, the number of put options increased by 112% to 104.14K. The put/call ratio for options was set at 1.88. This shows that put options are more dominant among traders. Bitcoin’s maximum pain point is seen at $83,000 at the time of writing. BTC is priced at $84,154 and if it does not break the pain point of $83,000 downwards, rises may begin. In the coming period, there are 1.95K call and 4.98K put options at the time of writing.
Ethereum Options Distribution

Source: Laevitas
ETH: Notional: $399.75M | Put/Call: 1.41 | Max Pain: $1.85K
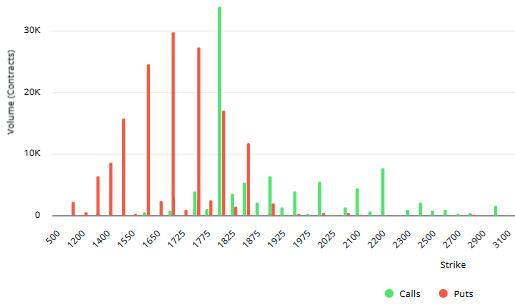
Laevitas Data: When we analyze the chart, it is seen that Put options are concentrated in the $1,600 – $1,700 band. It is noteworthy that the Put volume peaks at the $1,700 and $1,750 levels, where there are approximately 30K and 27K contracts, respectively. This suggests that the $1,700 – $1,750 region is seen as a strong support. On the other hand, we see that Call options are concentrated between $1,800 and $2,000. At the $1,800 level, the Call volume reaches its highest point, where there are about 34K contracts. This suggests that this level could work as an important resistance. The fact that Put options currently have higher volume than Call options shows that selling pressure continues in the market. It will be especially critical whether the $1,700 – $1,750 levels can be maintained.
Deribit Data: At The Money (ATM) volatility, a measure of market volatility, fell 18.85% to 53.74, indicating continued market uncertainty. The 25Δ Risk Reversal (RR) value, which is seen as a balance point, increased by 10.75% on a daily basis to -6.94. On the other hand, the 25Δ Butterfly Spread (BF) declined to 25.4, a decrease of 17.93%. This data shows that option traders are still undecided about the market direction, but they expect a significant change in direction. One of the most striking points is that the interest in put options has continued in the past two weeks. In contrast, the volume of call options fell by nearly 50% and the size of open interest (OI) increased by 7.58%. In sum, although market volatility seems to have decreased compared to the recent period, investors are hedging themselves against downside risks.
Option Expiration
Ethereum options with a notional value of $399.75 million expired on April 4. The maximum pain point is $1,850 and the put/call ratio is 1.41.
Legal Notice
The investment information, comments and recommendations contained in this document do not constitute investment advisory services. Investment advisory services are provided by authorized institutions on a personal basis, taking into account the risk and return preferences of individuals. The comments and recommendations contained in this document are of a general type. These recommendations may not be suitable for your financial situation and risk and return preferences. Therefore, making an investment decision based solely on the information contained in this document may not result in results that are in line with your expectations.


