
TECHNICAL ANALYSIS
BTC/USDT
China has raised its tariffs on US goods to 84%. This decision is seen as a direct retaliation to the tariffs imposed by the US and reveals China’s hardening trade strategy. This step is expected to increase economic pressure in global markets. Former Treasury Secretary Larry Summers stated that this course could drag the US into a new financial crisis. Current Treasury Secretary Bessent, on the other hand, said in harsh terms that “every option is on the table, including the removal of Chinese companies’ shares from US stock exchanges”. On the other hand, Swedish MP Rickard Nordin suggested that Bitcoin should be included in foreign exchange reserves. Later in the day, Donald Trump’s response to new retaliations against China will be closely monitored both in terms of markets and global relations.
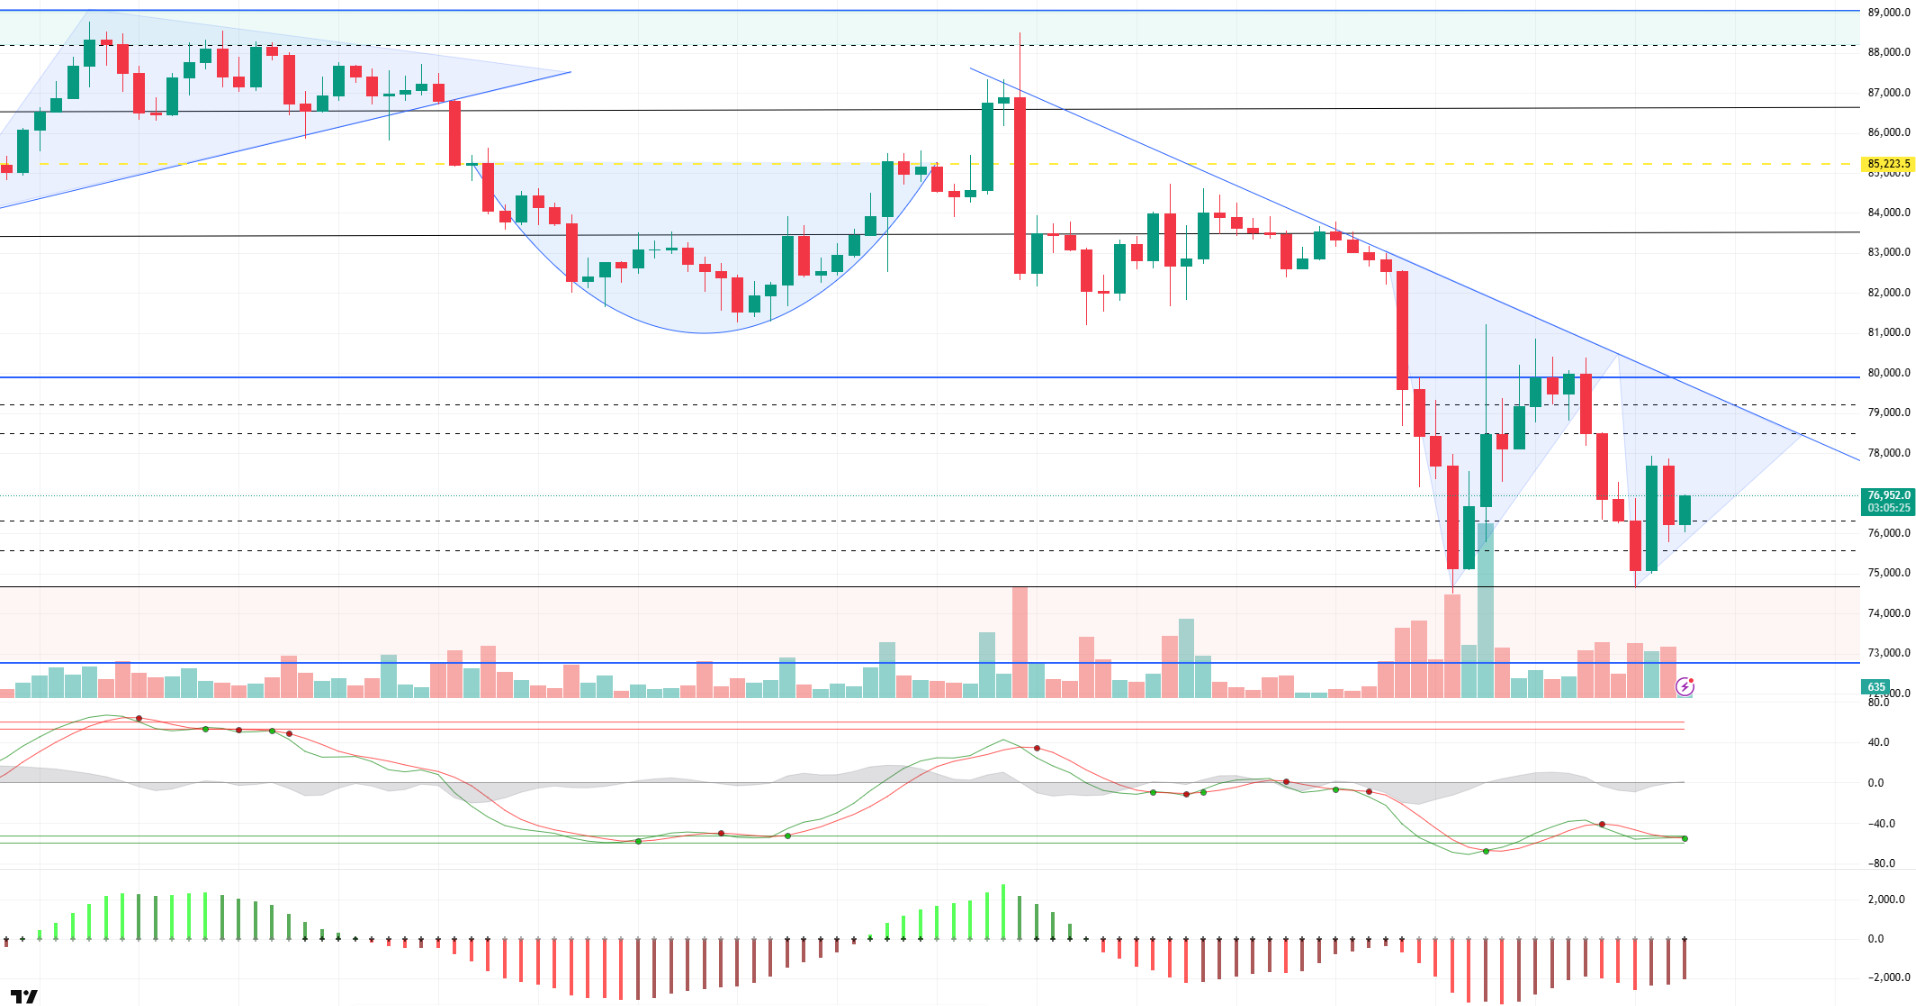
When we look at the technical outlook, we stated in the previous analysis that we expect the sell signal to be replaced by a buy signal and if this process is supported by fundamental factors, the double bottom pattern may come into play. As a matter of fact, this expectation was technically fulfilled as the wave trend oscillator gave a buy signal during the day. However, the retaliation news from China turned the market down again and an environment where fundamental developments did not support the technique. At the time of writing, BTC is trading at 76,900 and the market has turned its eyes to the statements that may come from the Trump front this time. The negative sentiment in global indices is also reflected in the US pre-market data. In case the selling pressure deepens, if the 74,600 level, which has been tested twice before, is broken, the price may retreat to the levels seen in the pre-Trump period, i.e. below the 70,000 band. On the other hand, if the tone of fundamental developments softens or there are statements that may positively affect market sentiment, it may be possible for the technical structure to start working again. In this scenario, the double bottom pattern would remain valid and BTC could be expected to target the 85,000 level where short positions are concentrated.
Supports 76,400 – 75,500 – 74,600
Resistances 78,500 – 80,000 – 81,500
ETH/USDT
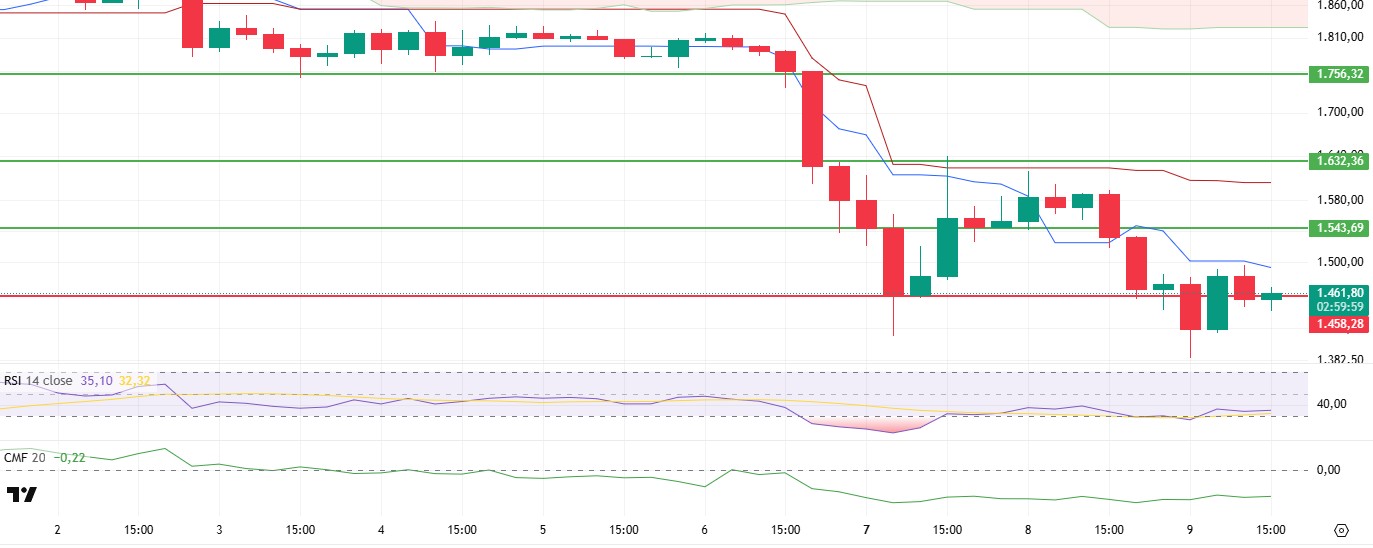
During the day, ETH rallied up to the tankan level due to the positive signals in technical indicators. However, China’s announcement that it would impose an additional 84% tariff in response to the US tariffs led to a decline in risk appetite in global markets. The increased selling pressure with this development caused ETH to break its important support at the $1,458 level. While the break of this support level signaled a weakening in terms of the short-term technical outlook, it revealed that the pressure on the market continues to remain highly sensitive to macroeconomic developments.
While technical indicators continue to accompany price movements, the horizontal course of the Chaikin Money Flow (CMF) indicator is noteworthy. The fact that CMF did not show a significant decline suggests that the selling pressure is mainly stemming from the futures markets and that a significant liquidity outflow from the spot market has not yet materialized. This suggests that the selling in the market was mostly limited to short-term and speculative trades, and therefore, fundamental investors largely maintained their positions. Similarly, the Relative Strength Index (RSI) did not react strongly to the decline and exhibited a horizontal outlook, suggesting that the current momentum remains balanced and the sell-off is not excessive.
In terms of the overall assessment, if the US markets have a negative opening in the evening, the ETH price may also be affected by this negative sentiment. However, the current outlook on technical indicators suggests that ETH may manage to hold above the $1,453 level and continue its sideways movement, or even regain upward momentum in the short term. On the other hand, in a possible pullback scenario, the $1,369 level stands out as an important support point and it can be evaluated that the buying appetite may increase in this region and the price may enter the recovery process again.
Supports 1,458 – 1,369 – 1,290
Resistances 1,543 – 1,632 – 1,756
XRP/USDT
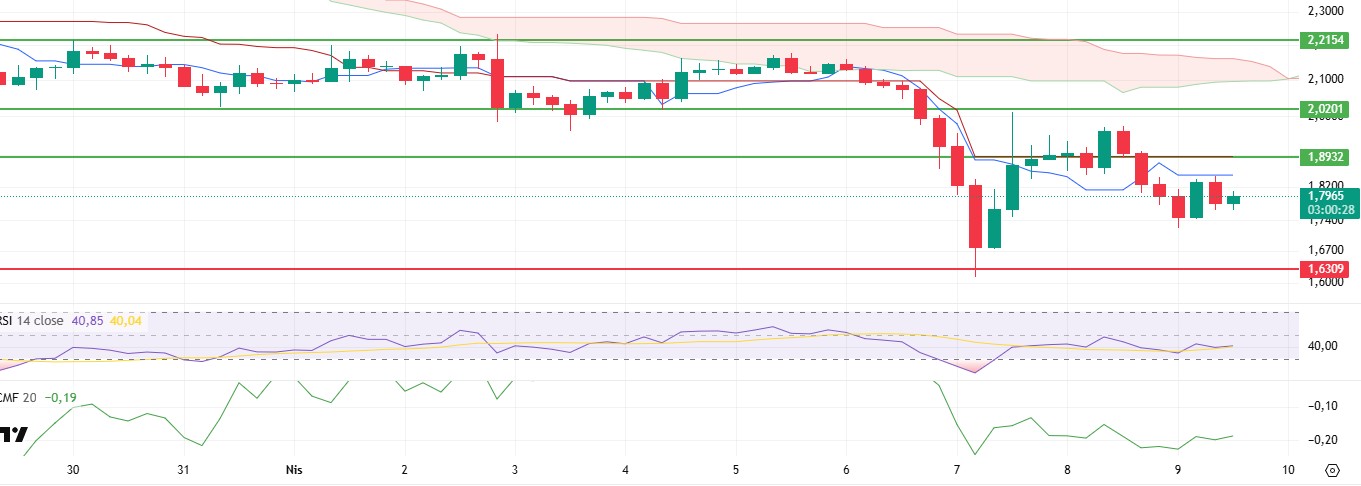
Although XRP exhibited an upward momentum by rising up to the tankan level during the day, the increasing uncertainty in global markets with China’s announcement that it would impose an additional tariff of 84% in response to the US led to a slight pullback in XRP price. Although this pullback is due to the increase in risk perception in the general market atmosphere, the signals given by technical indicators indicate that the positive trend for XRP continues.
Notably, the Chaikin Money Flow (CMF) indicator continues to trend upwards despite the downward movement in prices. This shows that liquidity inflows to the spot markets continue, albeit limited, and investors have not completely lost confidence in XRP. The Relative Strength Index (RSI) indicator also supports this picture. The fact that the RSI has managed to stay above the based MA line and maintain its upward trend indicates that price movements are supported by momentum. Technically, this can be considered as a sign that the upside potential continues.
The current technical outlook suggests that XRP has the potential to rise to the $1.89 level in the short term. Technical indicators remain positive, making a test of this level likely, while the market’s reaction should be carefully monitored if the price approaches this resistance. On the other hand, the re-emerging trade tensions between the US and China continue to pose a significant risk to XRP, like all financial assets. If the negative news flows continue and the risk-off trend in global markets strengthens, it may be possible for XRP to retreat to the $1.63 level.
Supports 1.6309 – 1.4264 – 1.2895
Resistances 1.8932 – 2.0201 – 2.2154
SOL/USDT
Pump.fun has sent more than 166 thousand SOLs to a centralized exchange in the last 24 hours.
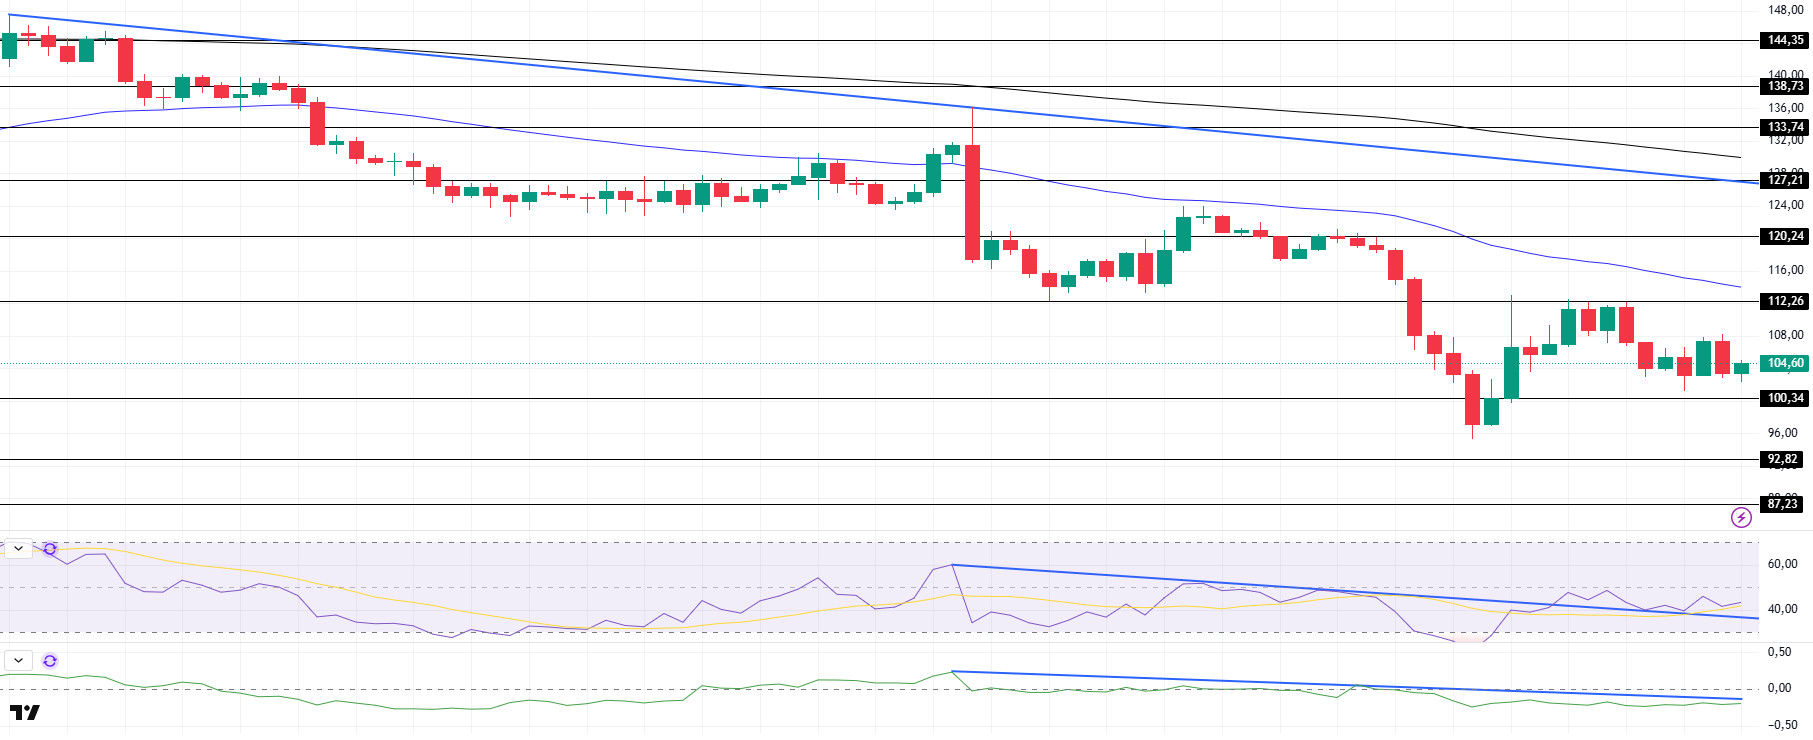
SOL has continued to price sideways since our analysis this morning. The asset tested the resistance level of 112.26 5 times but failed to break it. The downtrend that started on March 25th continues. On the 4-hour timeframe, the 50 EMA (Blue Line) remained below the 200 EMA (Black Line). This could deepen the decline further in the medium term. At the same time, the price continues to move below the two moving averages. When we analyze the Chaikin Money Flow (CMF)20 indicator, it is in the negative zone, but the negative daily volume may keep CMF in the negative zone. On the other hand, CMF continued its downtrend that started on April 2. However, the Relative Strength Index (RSI)14 indicator was in negative territory but managed to stay above the downtrend that started on April 2. The $112.26 level stands out as a resistance point in the rises driven by the upcoming macroeconomic data and the news in the Solana ecosystem. If it breaks here, the rise may continue. In case of retracements for the opposite reasons or due to profit sales, the support level of $ 100.34 can be triggered. If the price comes to these support levels, a potential bullish opportunity may arise if momentum increases.
Supports 100.34 – 92.82 – 87.23
Resistances 112.26 – 120.24 – 127.21
DOGE/USDT
21Shares has listed the Dogecoin ETP backed by the Dogecoin Foundation on the SIX Swiss Exchange.
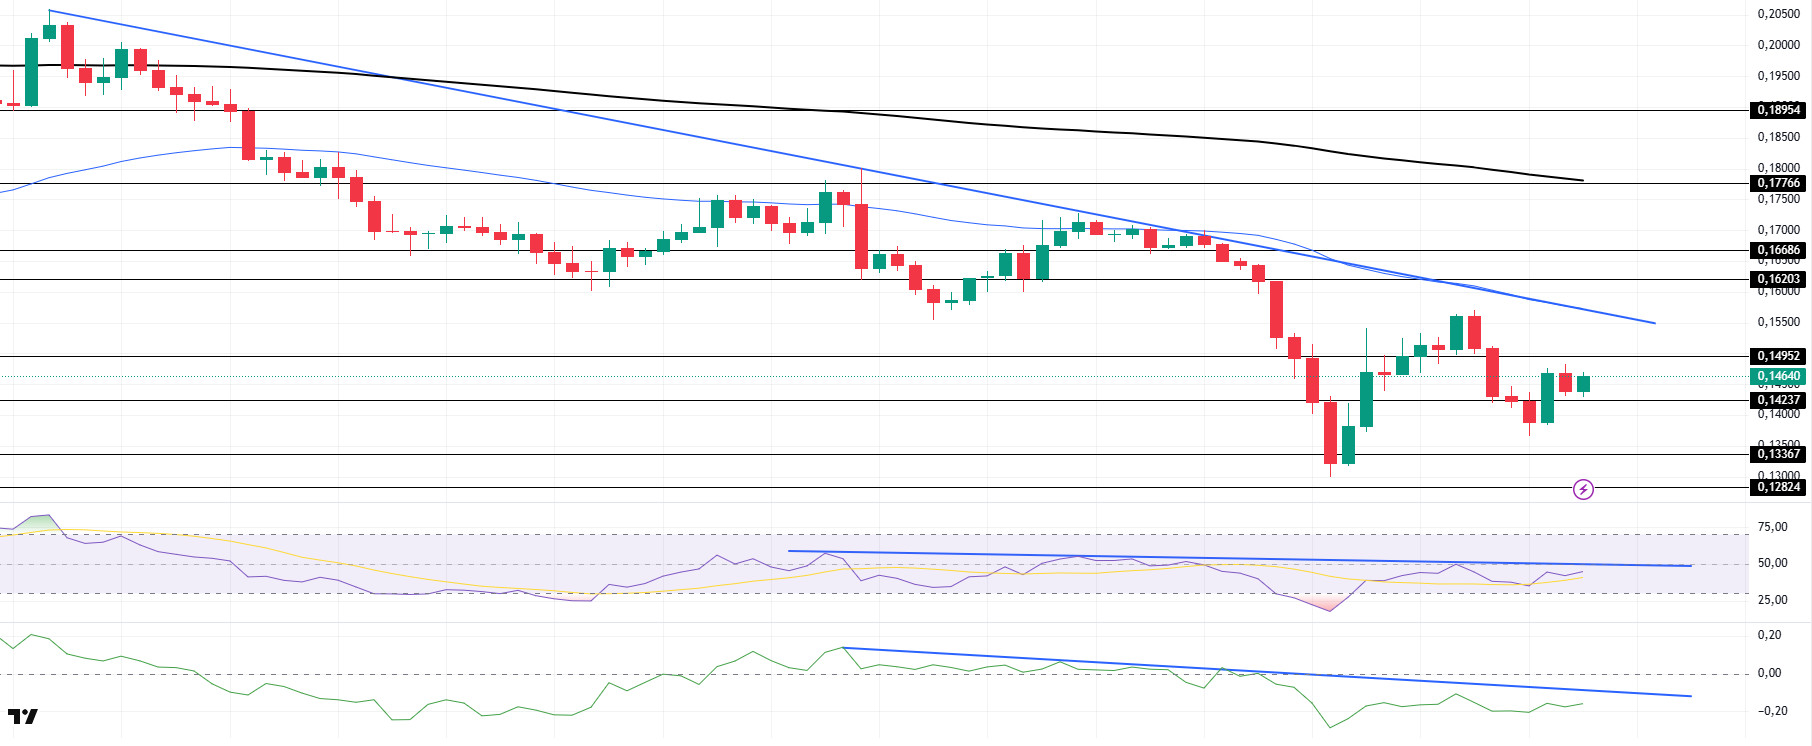
DOGE has moved sideways since our analysis this morning. The asset continues to hover below the downtrend that started on March 26. The asset, which tested the strong support level of $0.14237, gained momentum from here and rose slightly. On the 4-hour timeframe, the 50 EMA (Blue Line) continues to be below the 200 EMA (Black Line). This could mean that the decline could deepen in the medium term. However, the price continues to price below the two moving averages. When we examine the Chaikin Money Flow (CMF)20 indicator, it is at the mid-level of the negative zone. In addition, the negative 24-hour volume may cause CMF to retreat further in the negative zone. However, the downtrend continues. On the other hand, Relative Strength Index (RSI)14 is in the middle of the negative level and is preparing to retest the downtrend that started on April 1 as resistance. If it breaks this resistance, the asset may test the resistance level of 0.16203. The $0.16686 level is a very strong resistance point in the uptrend due to political reasons, macroeconomic data and innovations in the DOGE coin. In case of possible retracements due to political, macroeconomic reasons or due to negativities in the ecosystem, the $ 0.13367 level, which is a strong support place, is an important support place. If the price reaches these support levels, a potential bullish opportunity may arise if momentum increases.
Supports 0.14237 – 013367 – 0.12824
Resistances 0.14952 – 0.16203 – 0.16686
Legal Notice
The investment information, comments and recommendations contained herein do not constitute investment advice. Investment advisory services are provided individually by authorized institutions taking into account the risk and return preferences of individuals. The comments and recommendations contained herein are of a general nature. These recommendations may not be suitable for your financial situation and risk and return preferences. Therefore, making an investment decision based solely on the information contained herein may not produce results in line with your expectations.
