
TECHNICAL ANALYSIS
BTC/USDT
As the tension in the trade wars decreased, crypto markets started to show signs of recovery again. In the statement from the White House, it was stated that tariffs were suspended for 90 days and the rates applied to most countries will be reduced to 10%. While this development partially increased the global risk appetite, the Fed minutes stated that the Fed was aware of the economic uncertainties and that monetary policy would continue to be flexible depending on the data. In this context, interest rate cut expectations have been pointing to May in recent days, but it seems to have been postponed to June again. On the crypto side, Paul Atkins’ approval as SEC chairman was followed, while BlackRock’s transfer of 3,296 BTC to a central exchange attracted attention. Today, eyes will be on US inflation data and unemployment claims and we can expect increased volatility.
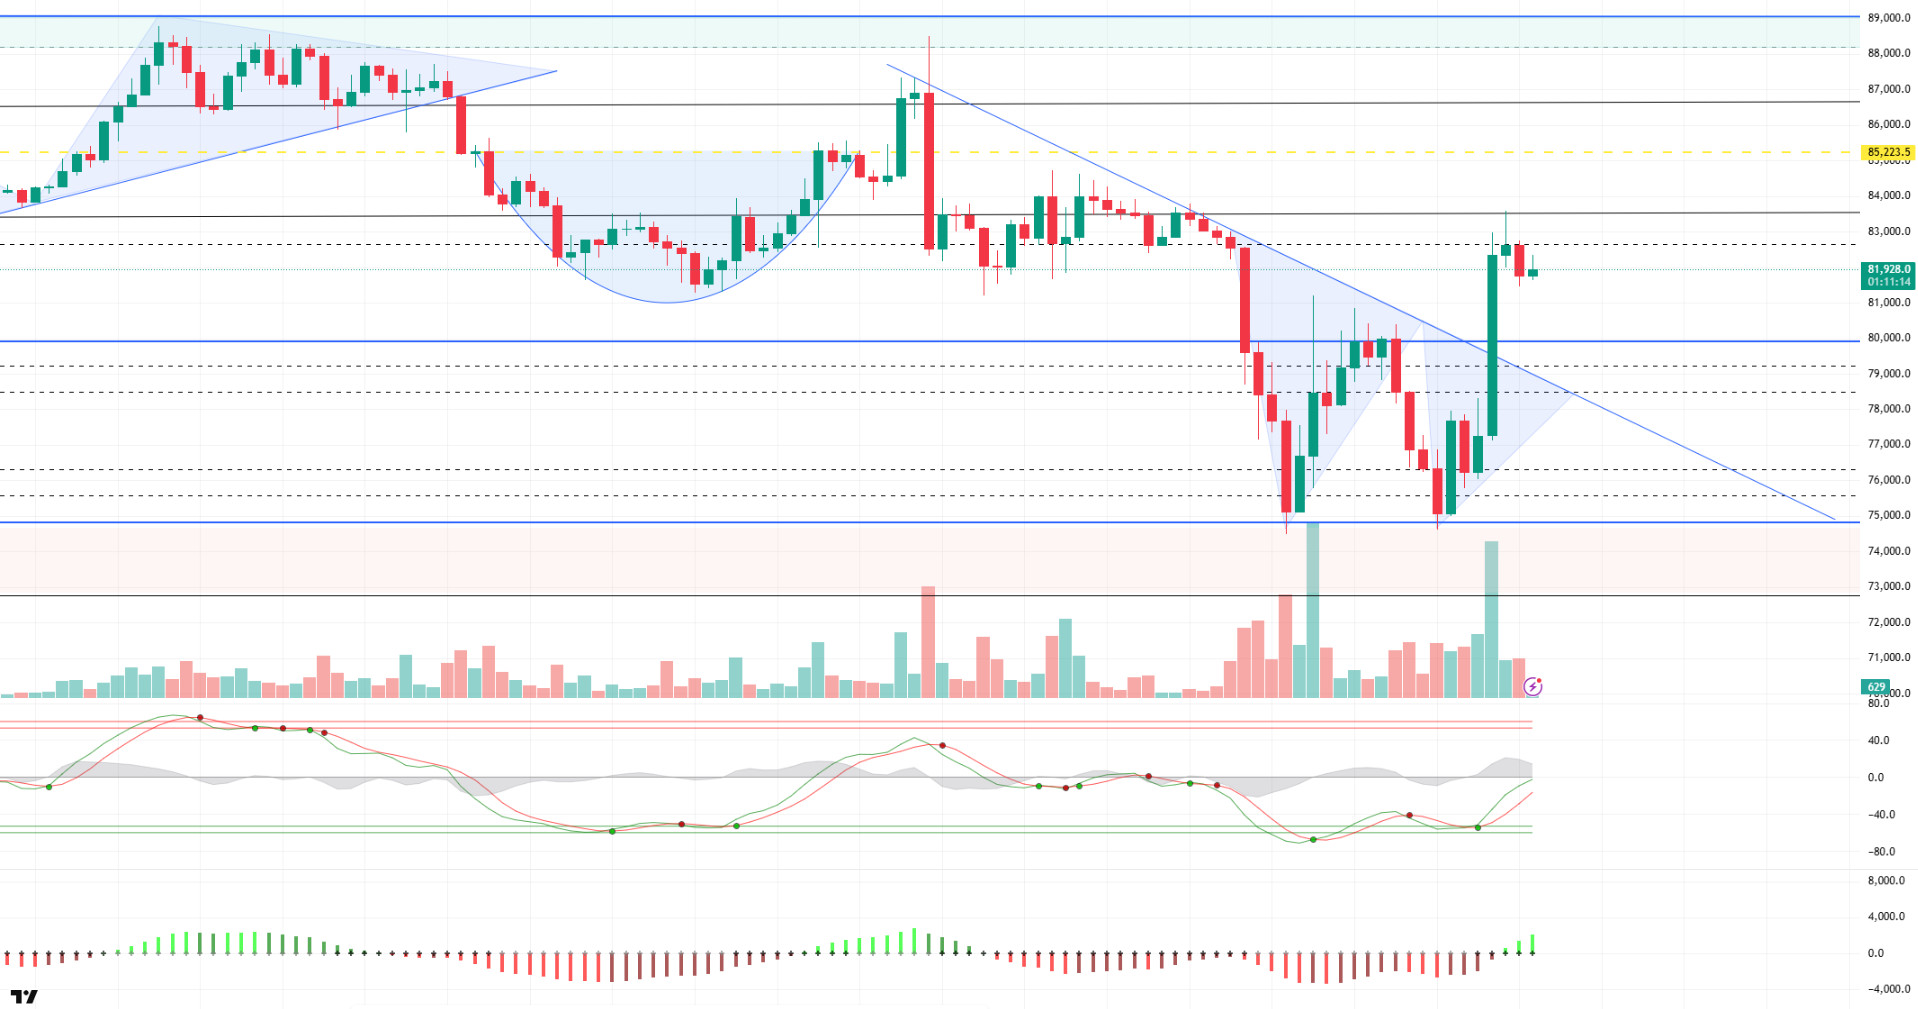
When we look at the technical outlook, in our previous analyses, we stated that the technical structure of the price received confirmation with the double bottom formation, turning its direction upwards in parallel with the buy signal of the oscillators, creating a suitable ground for the rise. As a matter of fact, with the softening of the tone in Trump’s tariffs, the price was confirmed, breaking the downtrend with a voluminous candle, rising as much as the depth length and successfully completed the pattern by testing the 83,500-resistance level. At the time of writing, BTC, which corrected the uptrend, is priced at 82,000 and continues to maintain its gains. With the continuation of the buy signal on the Wave trend oscillator and the momentum increasing again, the short trade accumulation indicated by the yellow line stands out as the target zone, while the impact of fundamental developments should be carefully monitored once again. Although there is some more room for upside in technical terms, we will again follow the 80,000 level as a reference point in case the tone of the developments on the agenda hardens once again or inflation data above expectations (2.5%).
Supports 81,500 – 80,000 – 78,500
Resistances 83,500 – 85,200 – 86,600
ETH/USDT
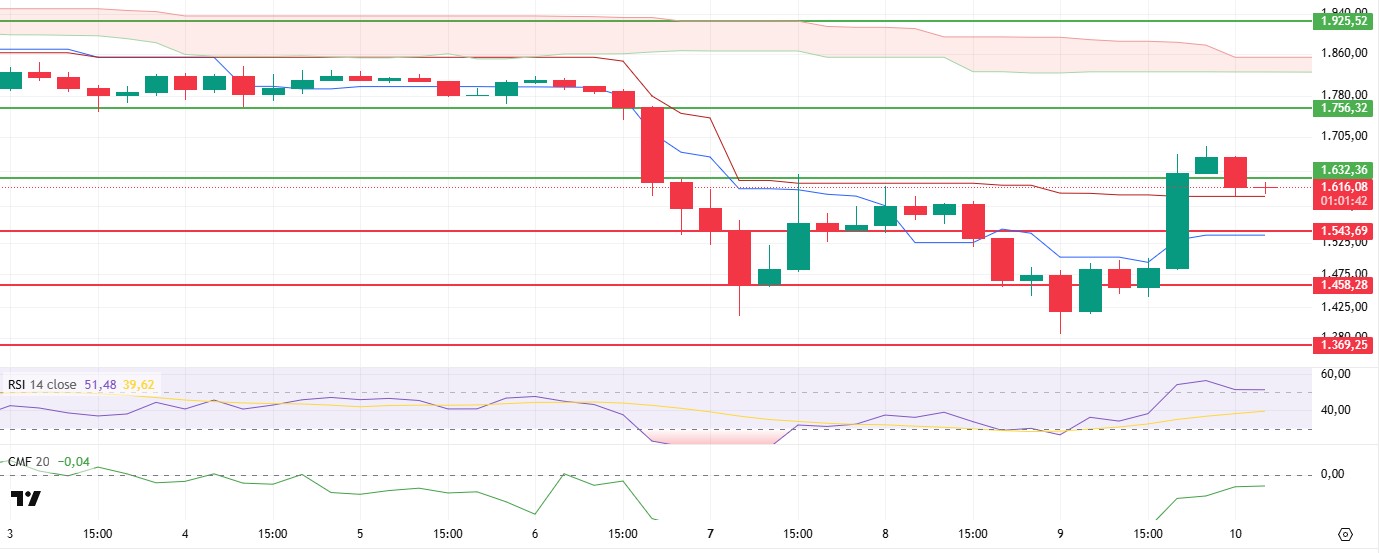
Yesterday evening, the US suspended its tariffs for 90 days and mutually agreed to lower the tariffs by 10%, which created a positive sentiment in global markets. With the effect of these developments, upward movements were observed in many financial instruments as a result of increased risk appetite and restoration of investor confidence. ETH also took its share of this upward momentum and managed to break the resistance level of $ 1,543, which is an important threshold in technical terms, and managed to rise above the $ 1,632 level. However, with the sales towards the morning hours, the price sagged below the $ 1,632 level again and realized a short-term correction movement.
From a technical indicators perspective, the bullish trend continues to be supported. The Chaikin Money Flow (CMF) indicator is approaching the positive territory, indicating that capital inflows are intensifying. The CMF reaching the zero line indicates that the upside potential is still alive and investors’ interest in the market is increasing. If the indicator crosses above zero, this could be considered as a strong “buy” signal. On the other hand, the Relative Strength Index (RSI) indicator has lost some of its positive bias after the morning price pullback and has started to trend downwards. This signals a weakening in momentum in the short term, suggesting that slight pullbacks in prices may continue during the day. The Ichimoku cloud indicator continues to produce more optimistic signals in terms of technical outlook. The fact that the price has risen above both kijun and tenkan levels supports that buyers are gaining strength, and the short-term trend is upward. Kumo cloud remains horizontal, confirming that the market is balanced and looking for direction, but the overall outlook is positive.
When evaluated in the light of all these indicators, the possibility that the Ethereum price will rise above the $1,632 resistance level again during the day seems technically strong. In particular, the fact that the price continues to stay above the kijun sen level in the Ichimoku indicator is an important condition that supports this scenario. If the $1,632 level is sustained above the $1,632 level, it may be possible for the price to rise to $1,756 in the evening hours. On the other hand, if the price dips below the kijun level, this bullish scenario may become invalid and a correction to $1,543 may be possible.
Supports 1,632 – 1,756 – 1,925
Resistances 1,543 – 1,632 – 1,756
XRP/USDT
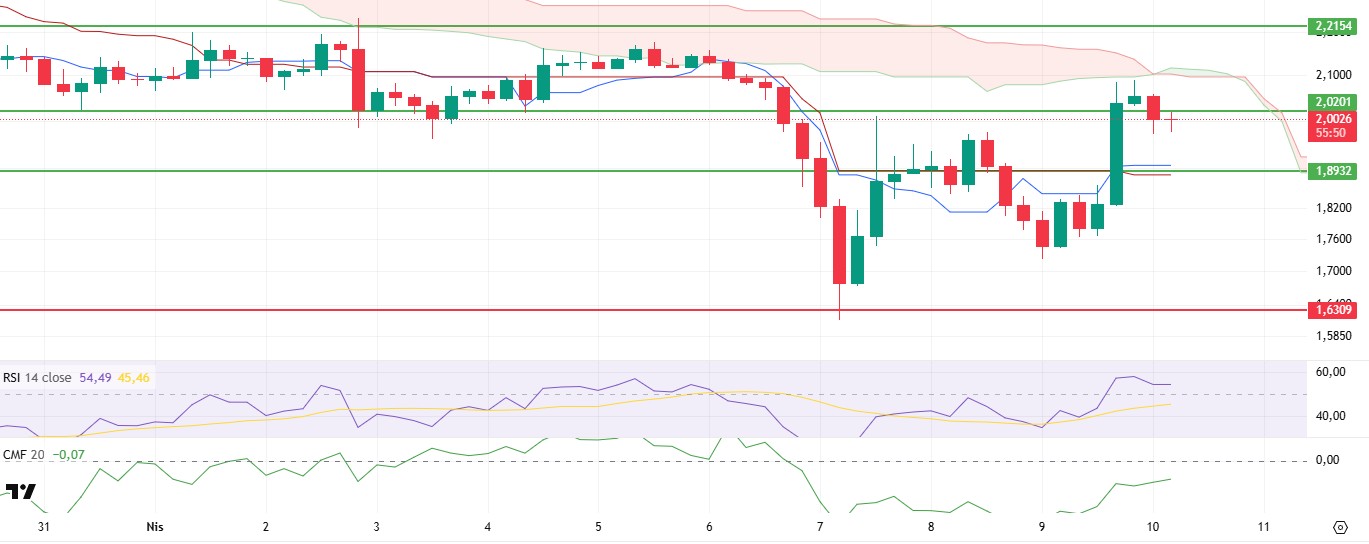
Yesterday evening, the US suspended tariffs for 90 days and cut tariffs by 10%, which had a positive impact on global markets. With the effect of the optimistic atmosphere created by these developments, XRP also gained an upward momentum and managed to exceed the resistance of $1.89, which is a critical level in technical terms, and managed to rise above the $2.02 level. However, with the selling pressure coming from this region in the morning hours, the price fell below the $2.02 level again and exhibited a short-term correction movement.
When technical indicators are analyzed, although the $2.02 level was broken downwards, indicators generally indicate that the upward trend may continue. The fact that the Chaikin Money Flow (CMF) indicator continues its positive course and moves towards the zero line indicates that capital inflows into the market continue and investors are still taking positions in the direction of buying. If this indicator crosses the zero line to the upside, a strong buy signal may be generated. Looking at the Ichimoku indicator, the technical picture is even more positive. The price breaking above both tenkan sen and kijun sen levels is considered as an important signal that the uptrend is gaining strength. In particular, the fact that the tenkan level cuts the kijun level upwards indicates that the short-term momentum is increasing and the market is trading buyer-heavy.
In the light of all these indicators, if XRP exceeds the $2.02 level again during the day, it seems likely that the upward movement will accelerate and a rise towards the upper limits of the kumo cloud will be experienced. Persistence above this level could pave the way for increased buying appetite and push the price towards higher resistance levels. On the other hand, the $1.89 level stands out as a strong support in a possible pullback. Maintaining this level could allow the XRP price to rebound and continue its upward movement. However, if this support level is lost, weakening in the short-term technical outlook may occur.
Supports 1.8932- 1.6309 – 1.4264
Resistances 2.0201 – 2.2154 – 2.3938
SOL/USDT
The SOL whale triggered new speculation by transferring 71,448 units of SOL, worth 8.54 million, to a centralized exchange.
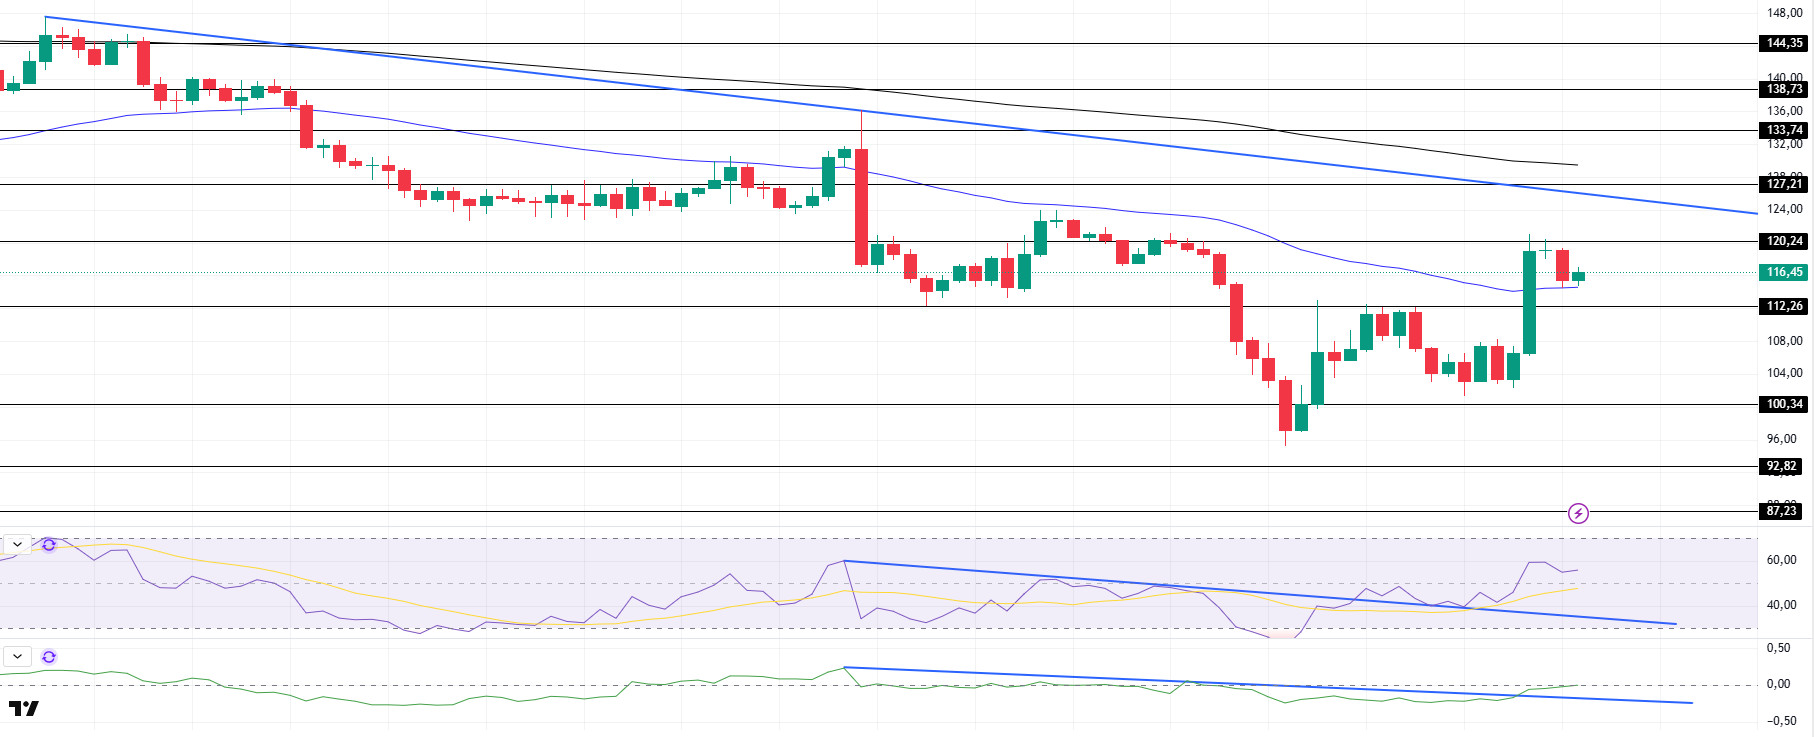
SOL has rallied since yesterday’s analysis after Trump’s announcement of a 90-day delay of his sanctions on tariffs. The asset, which rose by about 13%, tested the strong resistance level of $120.24 but failed to break it and retreated slightly and is currently experiencing an upward acceleration with support from the 50 EMA (Blue Line). If the acceleration continues, it may test the downtrend that started on March 25. On the 4-hour timeframe, the 50 EMA (Blue Line) remained below the 200 EMA (Black Line). This could continue the decline in the medium term. At the same time, the price started moving between two moving averages. This shows us that the market is in the decision phase. When we analyze the Chaikin Money Flow (CMF)20 indicator, it moved up from the negative zone and reached the neutral zone. However, the fact that the daily volume is also on the rise may enable CMF to move into the positive zone. On the other hand, CMF has broken the downtrend that started on April 2. However, Relative Strength Index (RSI)14 broke the downtrend that started on April 2 to the upside and turned it into support and accelerated from there to the positive zone. This could push the price higher. The $120.24 level appears as a resistance point in the rises driven by the upcoming macroeconomic data and the news in the Solana ecosystem. If it breaks here, the rise may continue. In case of retracements for the opposite reasons or due to profit sales, the support level of 112.26 dollars can be triggered. If the price comes to these support levels, a potential bullish opportunity may arise if momentum increases.
Supports 112.26 – 100.34 – 92.82
Resistances 120.24 – 127.21 – 133.74
DOGE/USDT
21Shares has filed an S-1 application with the US SEC for the Dogecoin ETF. The asset manager is the third company to file for the DOGE ETF after Grayscale and Bitwise. On the Onchain, DOGE trades fell more than 94% in just one month, from 374,700 to 20,000. Santiment found that Dogecoin whales sold more than 1.32 billion DOGE in the last 48 hours alone.
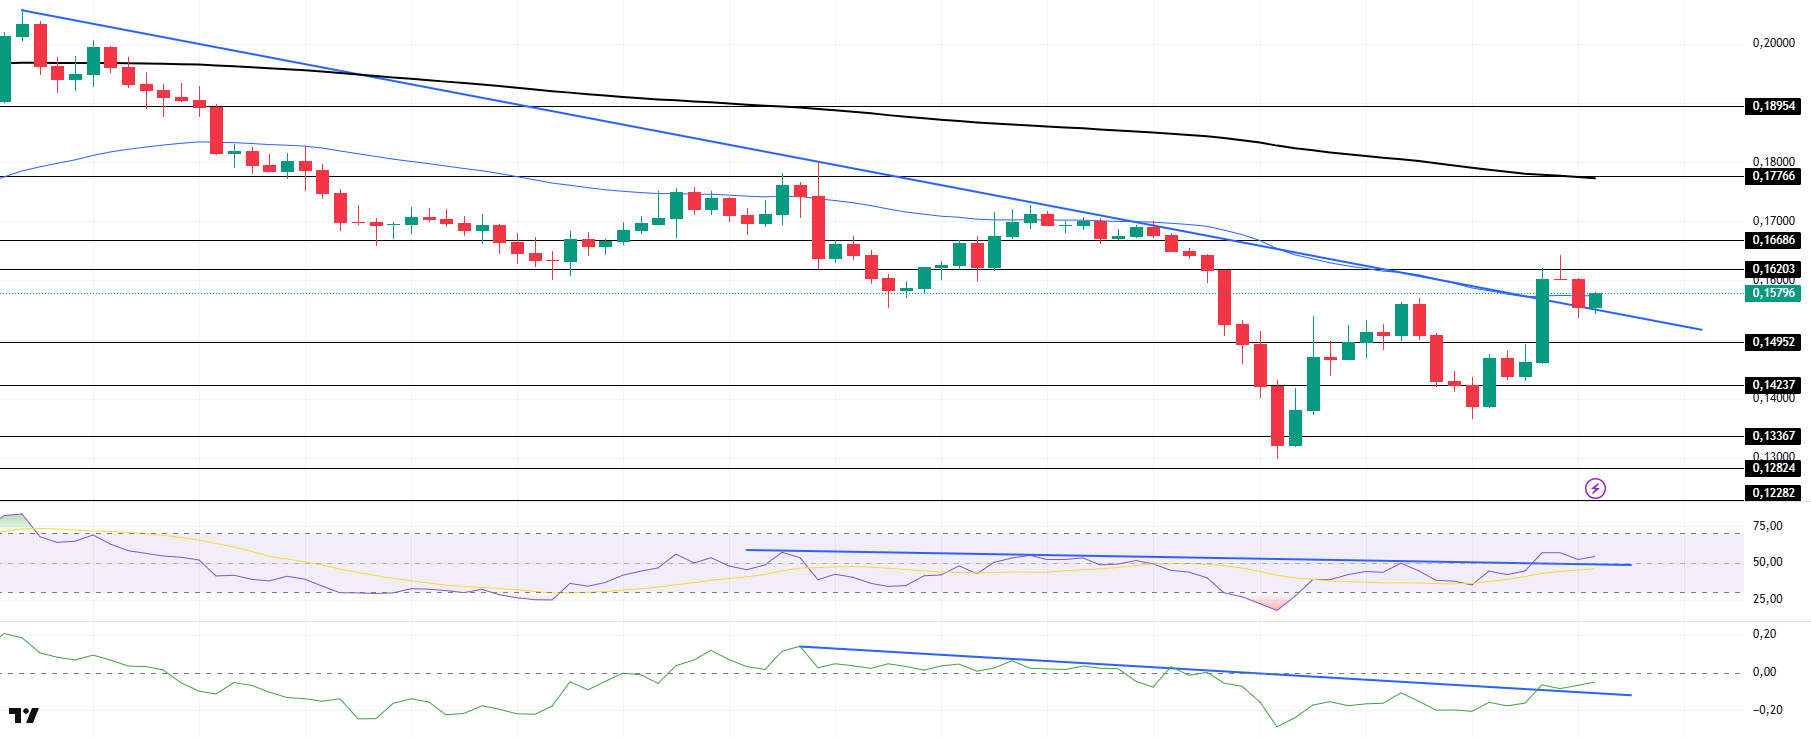
Following our analysis last night, DOGE rallied after Trump announced his decision to postpone his sanctions on tariffs for 90 days. The asset turned around the resistance level of $0.16203, up about 15%. On March 26, the asset managed to break the downtrend that started on March 26 and is currently accelerating upwards with support. Located between the downtrend and the 50 EMA (Blue Line), the price may retest the strong resistance at 0.16203 if the favorable market dynamics continue. On the 4-hour timeframe, the 50 EMA (Blue Line) remains below the 200 EMA (Black Line). This could mean that the decline could continue in the medium term. However, the price continues to price below the two moving averages. When we examine the Chaikin Money Flow (CMF)20 indicator, it is at the mid-level of the negative zone. In addition, the positive 24-hour volume may enable CMF to move into the positive zone. However, the downtrend in CMF has broken to the upside. This may continue the uptrend. On the other hand, Relative Strength Index (RSI)14 has broken the downtrend that started on April 1 as well as transitioning from the mid-region of the negative level to the positive zone. It may test this trend as support and continue its uptrend. The level of 0.16686 dollars appears as a very strong resistance place in the rises due to political reasons, macroeconomic data and innovations in the DOGE coin. In case of possible retracements due to political, macroeconomic reasons or due to negativities in the ecosystem, the $0.14952 level, which is a strong support place, is an important support place. If the price reaches these support levels, a potential bullish opportunity may arise if momentum increases.
Supports 0.14952 – 0.14237 – 013367
Resistances 0.16203 – 0.16686 – 0.17766
Legal Notice
The investment information, comments and recommendations contained herein do not constitute investment advice. Investment advisory services are provided individually by authorized institutions taking into account the risk and return preferences of individuals. The comments and recommendations contained herein are of a general nature. These recommendations may not be suitable for your financial situation and risk and return preferences. Therefore, making an investment decision based solely on the information contained herein may not produce results in line with your expectations.
