
TECHNICAL ANALYSIS
BTC/USDT
While El Salvador President Nayib Bukele and US President Donald Trump met at the White House, the public expectation was to focus on crypto issues. However, Bitcoin was not on the agenda of the meeting. On the other hand, Trump’s advisor Bo Hines stated that the US could use tariff revenues for Bitcoin purchases, indicating that pro-crypto policies continue. On the institutional side, the buying appetite continues. Institutions bought 95,431 BTC in the first quarter of 2025, holding 3.28% of the total circulating supply.
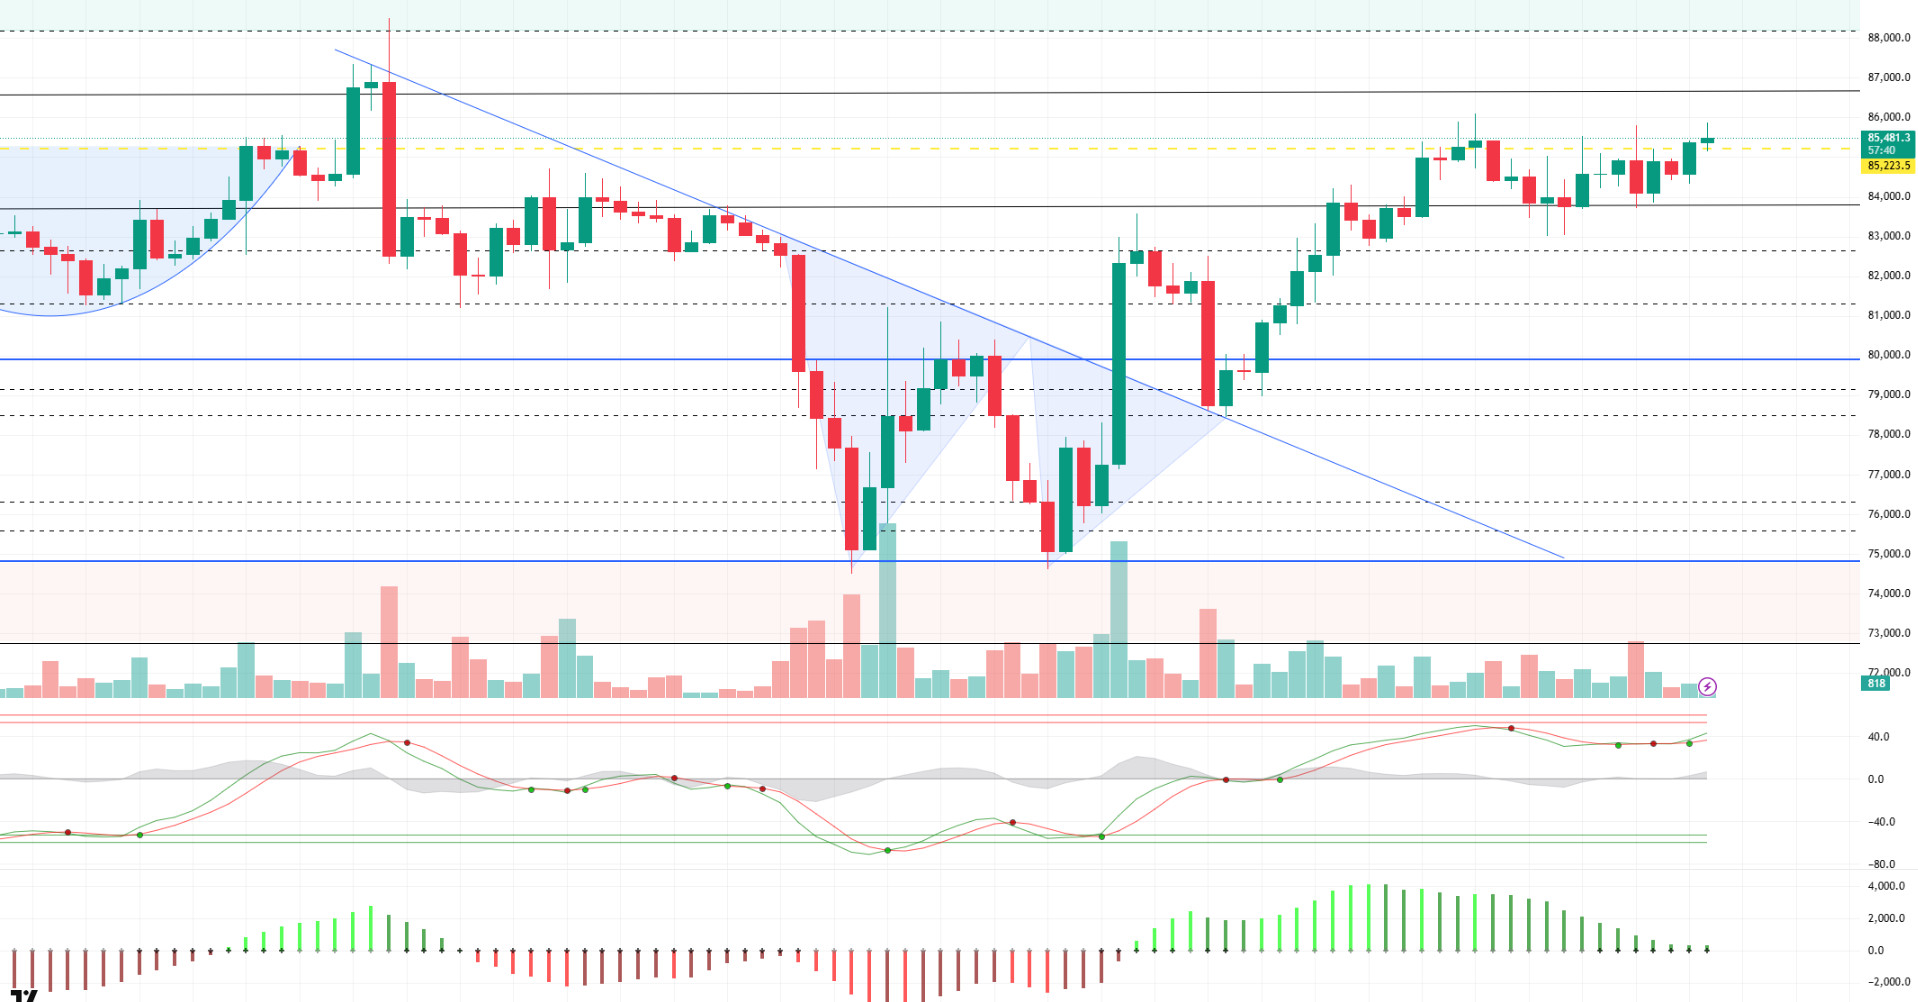
Looking at the technical outlook, BTC consolidated in the 83,500-85,000-band range within the uptrend structure and turned its direction up again after a short-term sell signal. BTC, which has been testing the 85,000 level for the last three days, exceeded this resistance from time to time, but retreated without being able to persist above it. However, at the time of writing, BTC is trading around 85,500 above this level. The wave trend oscillator in BTC, which continues to struggle in the resistance zone, generates trading signals near the overbought zone, while this situation reveals an indecisive technical picture. Momentum indicators are still weak, supporting the uncertainty in the market. While there is some room for further technical upside, the lack of fundamentals does not support the move. Given BTC’s sensitivity to news flows, fundamental developments seem to be the most important factor that will determine its direction. While there is silence on the tariff front for now, all eyes are on the first set of tariffs expected to arrive from the European Union today. The tone of these developments could lead to momentary shifts in the market. On the other hand, BTC still lacks an important catalyst. As long as there is no concrete development regarding the reserve system, it is technically possible for the price to experience a strong bullish rally, but it seems difficult from a fundamental perspective. Moreover, despite the retreat in the dollar index, the increase in the VIX fear index suggests that risk sentiment has deteriorated in the medium term and may put pressure on BTC price. In global markets, the Asian side is positive, while optimism in the US futures market is also noteworthy. This may support short-term price movements. If the rise continues during the day, the 86,600 level will appear as resistance. In a possible pullback, 85,200 will be the first intermediate support and then 83,500 will continue to be monitored as the major support level.
Supports 85,200 – 83,500 – 81,500
Resistances 86,600 – 89.000 – 91,800
ETH/USDT
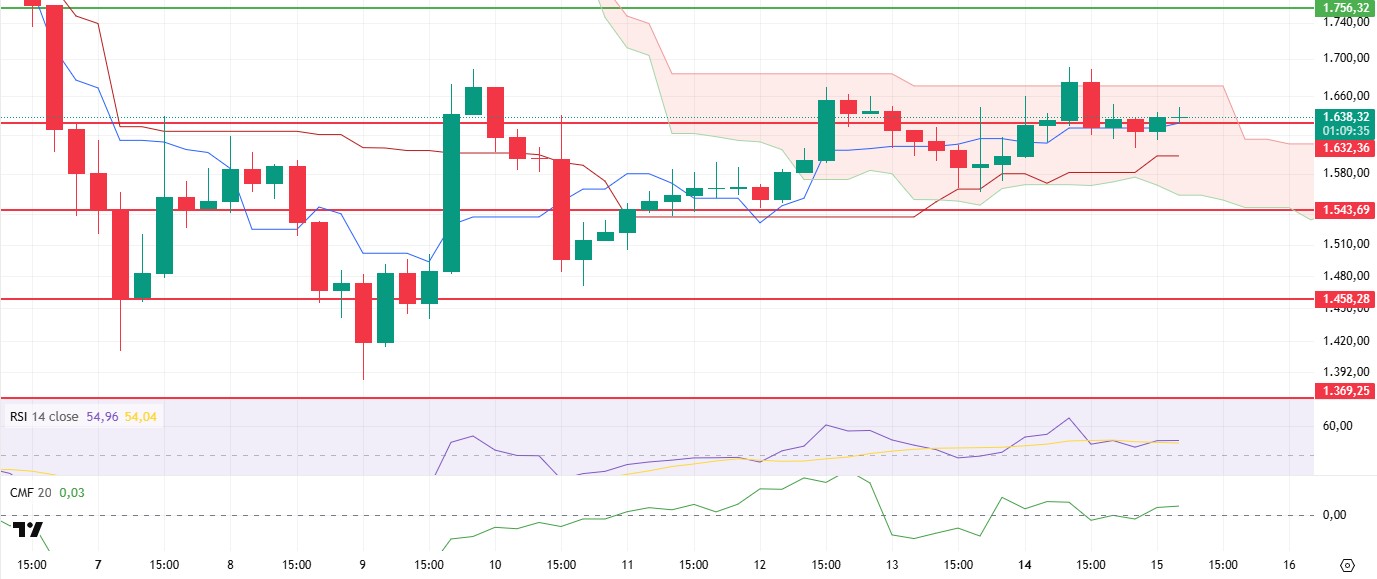
ETH entered a bearish trend yesterday evening, rejecting the upper band of the kumo cloud on the Ichimoku indicator, in line with the general pullback in the US markets. Despite this decline, the price managed to hold on to the $1,632 level, which currently stands out as a short-term balance point. Technical indicators remain generally positive.
The Relative Strength Index (RSI) indicator has gained upward momentum, breaking the negative divergence observed in its previous course. This indicates that the market momentum has started to build upwards again and the buy side is gaining strength. Chaikin Money Flow (CMF), on the other hand, briefly slipped into negative territory during the recent decline, but as the price regained the $1,632 level, it returned to positive territory and started its upward movement. This is an important signal that the capital inflow towards Ethereum is accelerating again and buyers are starting to increase their activity in the market. When the Ichimoku indicator is analyzed, the fact that the price is still pricing above the tenkan level and generally remains within the boundaries of the kumo cloud shows that the technical outlook remains positive. However, the reaction from the upper band of the kumo cloud during the decline during the day can be considered as a critical signal that can determine the direction of the trend in the short term. If the price manages to break through this zone, a stronger confirmation of the uptrend may be in question.
As a result, with the recovery in technical indicators and positive signals, if the ETH price maintains the $1,632 level, slight upward movements can be expected to continue during the day. As long as it stays above this level, it can be targeted to overcome the kumo cloud resistance at $1,670 in the first place. With the break of this resistance, the possibility of testing $ 1,756 levels will gain strength. On the other hand, the $1,543 level should be monitored as a strong support in a possible selling pressure. If this support is broken, the declines may deepen to the $1,458 region. Therefore, in the short term, both the $1,632 support and the $1,670 resistance stand out as critical levels in terms of the direction of the price.
Supports 1,632 – 1,543 – 1,458
Resistances 1,756 – 1,952 – 2,205
XRP/USDT
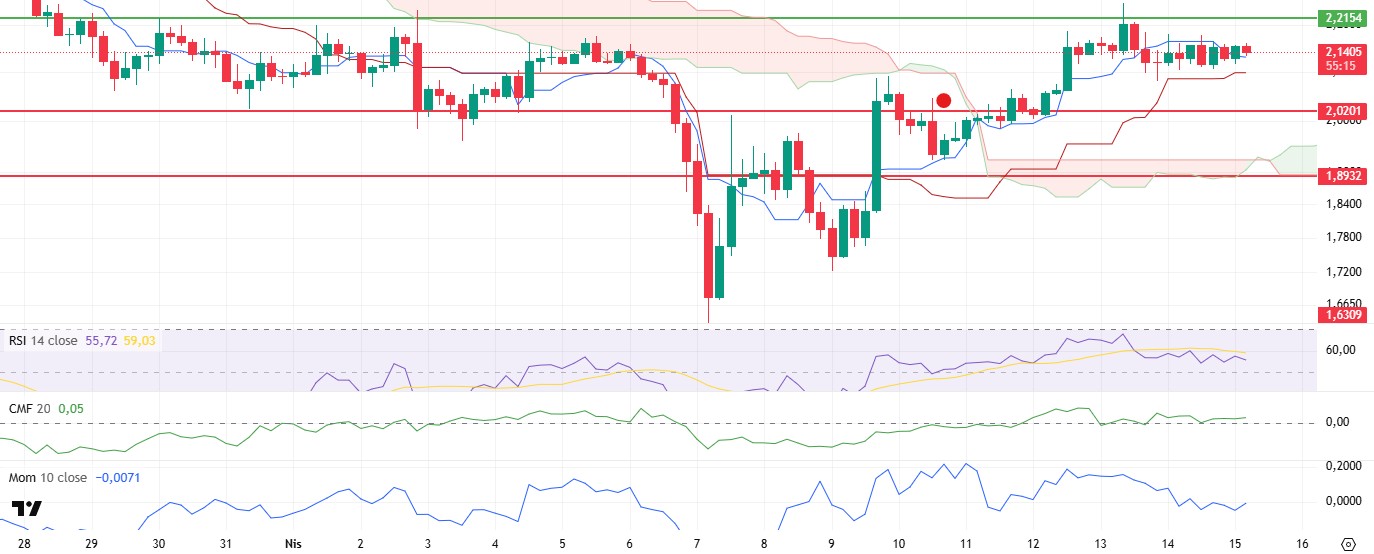
XRP has been moving horizontally in a narrow price range with low volume transactions for a while. Despite the slight pullback in the crypto market yesterday, XRP managed to maintain its price at the level of $2.10, and in this sense, it exhibits a resistant structure in the short term. The fact that price movements are limited to low volatility is directly reflected in the indicators. Looking at the technical outlook, the vast majority of indicators continue to produce horizontal and unstable signals.
The Chaikin Money Flow (CMF) indicator remained flat in the positive territory, indicating that the balance between buyers and sellers continues. This suggests that there is no strong capital outflow or inflow in the market, but the current buyer pressure is enough to keep the price at these levels. On the other hand, volume-sensitive indicators such as Momentum and Relative Strength Index (RSI) are showing a weakening trend. These indicators reveal that a strong upward momentum has not yet formed due to the low trading volume, so the bullish scenario needs confirmation. When the Ichimoku indicator is analyzed, it is seen that the price continues to remain above the tenkan level. While this supports technical positivity in the short term, at the same time, the upward trend of the kumo cloud in the ichimoku indicator reveals that the overall technical structure remains positive. However, the point to be noted here is that a volatile breakout may approach as the price is stuck in a narrow range.
In this context, if the $2.21 level breaks to the upside, XRP is likely to break out of the narrow band and start a sharp uptrend. Such a breakout could lead to increased investor interest and, if supported by volume, a new short-term uptrend could form. On the other hand, a breach of the $2.02 level in a possible downward pressure could disrupt the positive structure and lead the price to retreat towards lower support zones. Therefore, it is important to focus carefully on the regions where the current horizontal trend will end in terms of short-term positioning.
Supports 2.0201- 1.8932 – 1.6309
Resistances 2.2154 – 2.3938 – 2.4721
SOL/USDT
Canada will launch the world’s first spot Solana ETFs on April 16th with OSC approval and staking through TD Bank Group. On the other hand, with the implementation of SIMD-0207, Solana engineers increased the block size of the chain by 4%
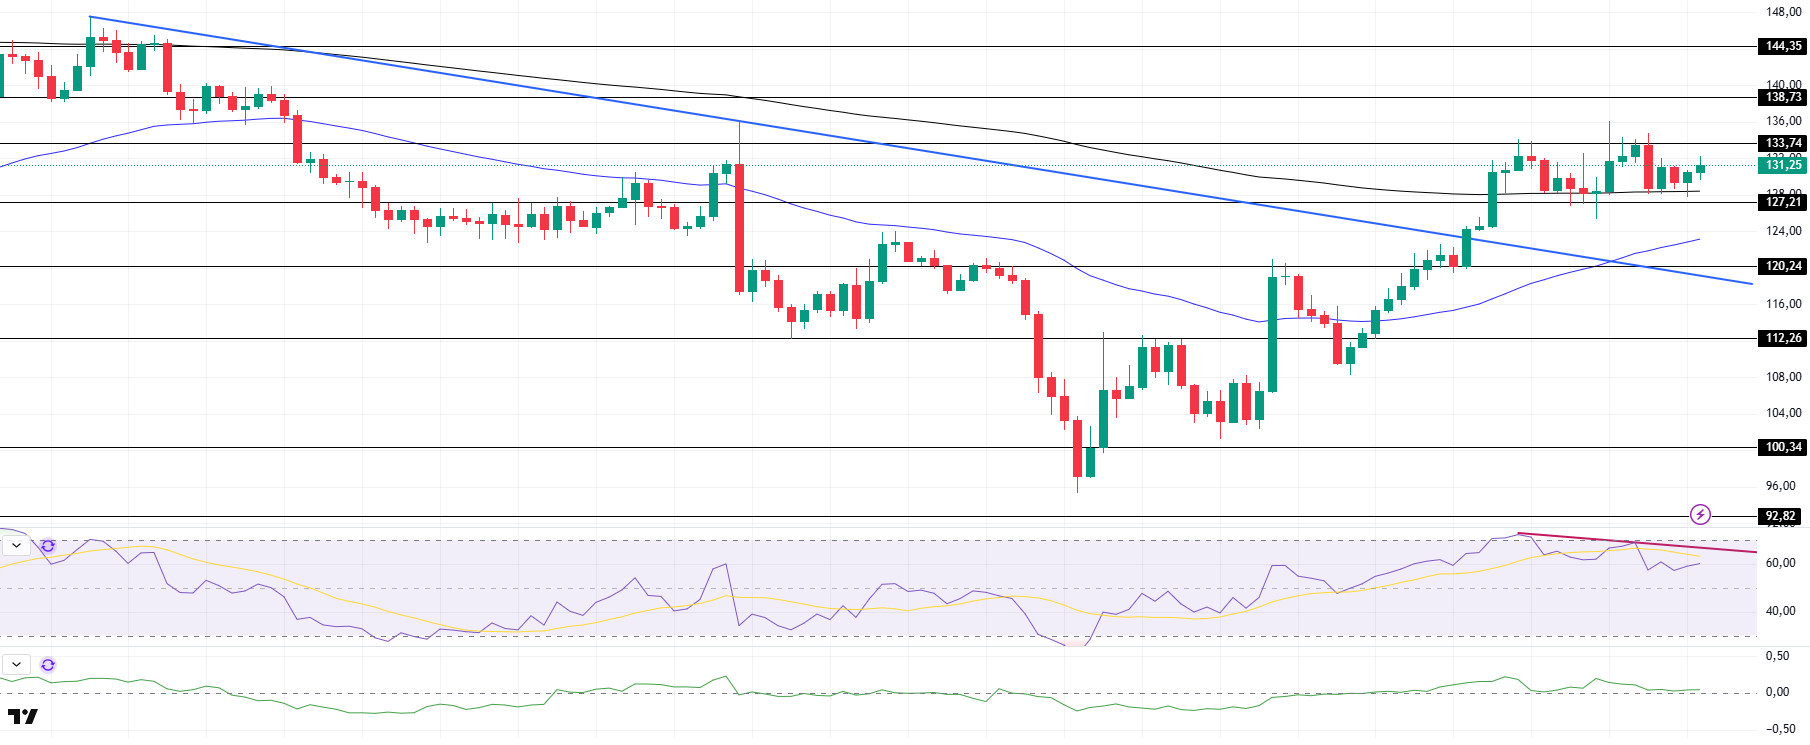
SOL continues to move sideways. The asset remained above the strong resistance level of $127.21 and the moving average of 200 EMA (Black Line). It tested the strong resistance level of $133.74 twice as resistance but failed to break it and continued to hold at this level with a slight retracement. On the 4-hour timeframe, the 50 EMA (Blue Line) is below the 200 EMA (Black Line). This could continue the decline in the medium term. At the same time, the price continued to move above the two moving averages. This suggests that buyers are becoming more dominant in the market. The Chaikin Money Flow (CMF)20 indicator is also at a positive level. However, the negative daily volume may move CMF into negative territory. However, Relative Strength Index (RSI)14 continues the downtrend that started on April 12. However, profit selling seems to have reached saturation. This may start an upward acceleration again. The $144.35 level appears as a resistance point in the rises driven by the upcoming macroeconomic data and the news in the Solana ecosystem. If it breaks here, the rise may continue. In case of retracements for the opposite reasons or due to profit sales, the support level of $127.21 can be triggered. If the price comes to these support levels, a potential bullish opportunity may arise if momentum increases.
Supports 127.21 – 120.24 – 112.26
Resistances 133.74 – 138.73 – 144.35
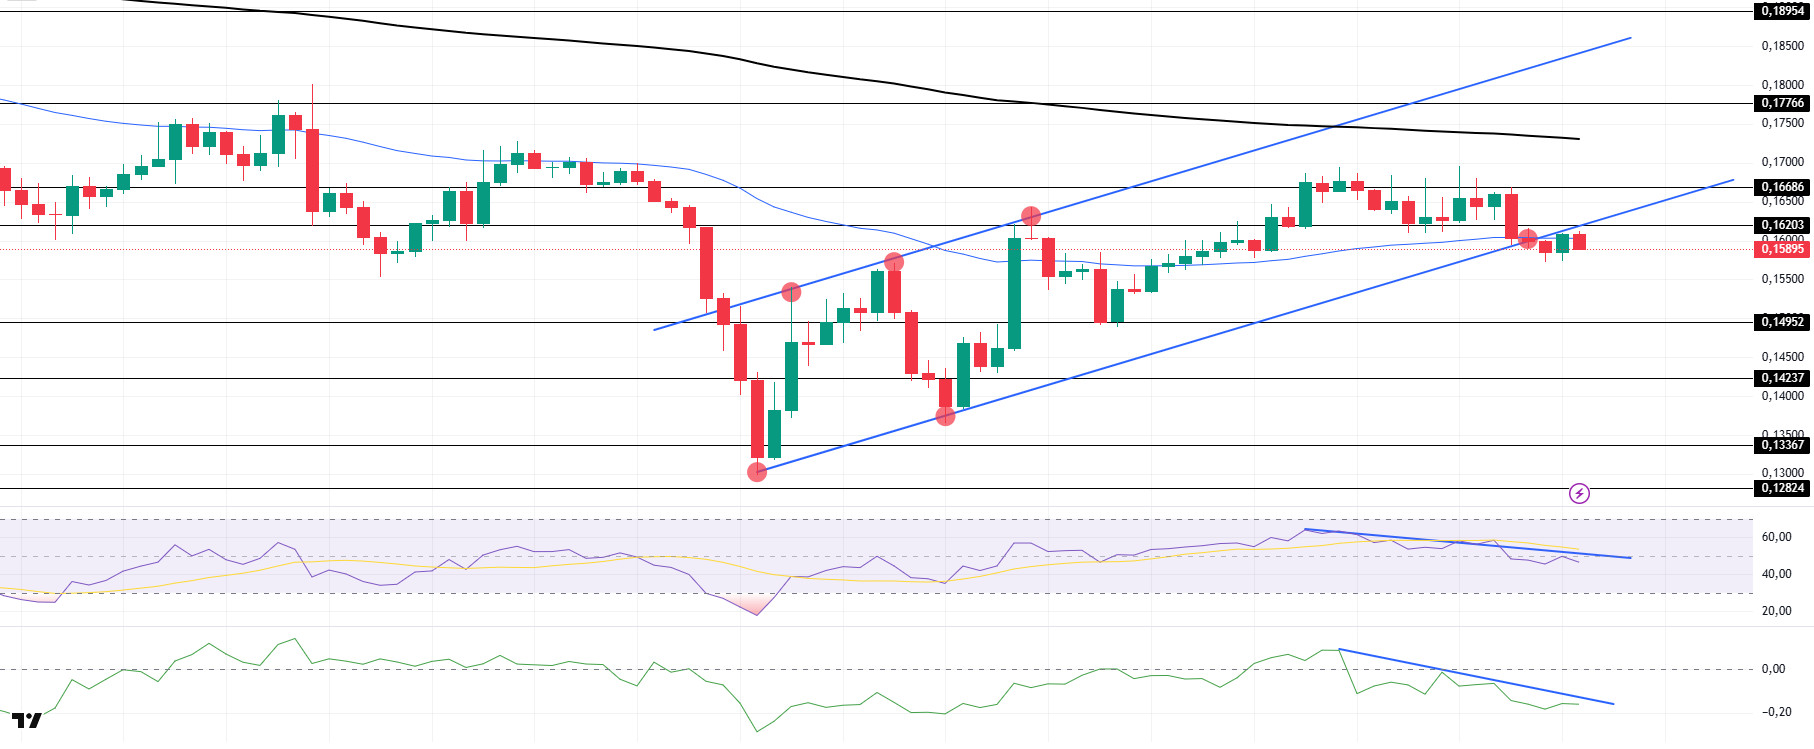
DOGE/USDT
DOGE retreated slightly after a prolonged sideways movement. The asset tested the resistance level at $0.16686 multiple times but failed to break it and broke the strong support at $0.16203 and the downside of the uptrend that started on April 7. It is currently testing the base level of the trend as resistance. However, it remained above the 50 EMA (Blue Line), the moving average. On the 4-hour timeframe, the 50 EMA (Blue Line) remains below the 200 EMA (Black Line). This could mean that the decline could continue in the medium term. However, the price started to price between the two moving averages. This shows us that the price is in the decision-making phase. When we examine the Chaikin Money Flow (CMF)20 indicator, it continued to be in the negative zone. In addition, the negative 24-hour volume may increase the retracement of CMF. However, the downtrend in CMF, which started on April 12, continues. This may continue the decline. On the other hand, Relative Strength Index (RSI)14 is at the neutral level, but it maintains the downtrend that started on April 12. This may cause pullbacks. The $0.16686 level stands out as a very strong resistance point in the rises due to political reasons, macroeconomic data and innovations in the DOGE coin. In case of possible pullbacks due to political, macroeconomic reasons or negativities in the ecosystem, the $ 0.14952 level, which is a strong support place, is an important support place. If the price reaches these support levels, a potential bullish opportunity may arise if momentum increases.
Supports 0.14952 – 014237 – 0.13367
Resistances 0.16203 – 0.16686 – 0.17766
LEGAL NOTICE
The investment information, comments and recommendations contained herein do not constitute investment advice. Investment advisory services are provided individually by authorized institutions taking into account the risk and return preferences of individuals. The comments and recommendations contained herein are of a general nature. These recommendations may not be suitable for your financial situation and risk and return preferences. Therefore, making an investment decision based solely on the information contained herein may not produce results in line with your expectations.
