
TECHNICAL ANALYSIS
BTC/USDT
US President Donald Trump has once again called for an urgent interest rate cut, sharpening his criticism of Fed Chairman Jerome Powell. European Central Bank (ECB) cut interest rates by 25 basis points in line with expectations. On the other hand, applications for unemployment benefits in the US, which we followed in the data set today, were announced slightly below expectations with 215K.
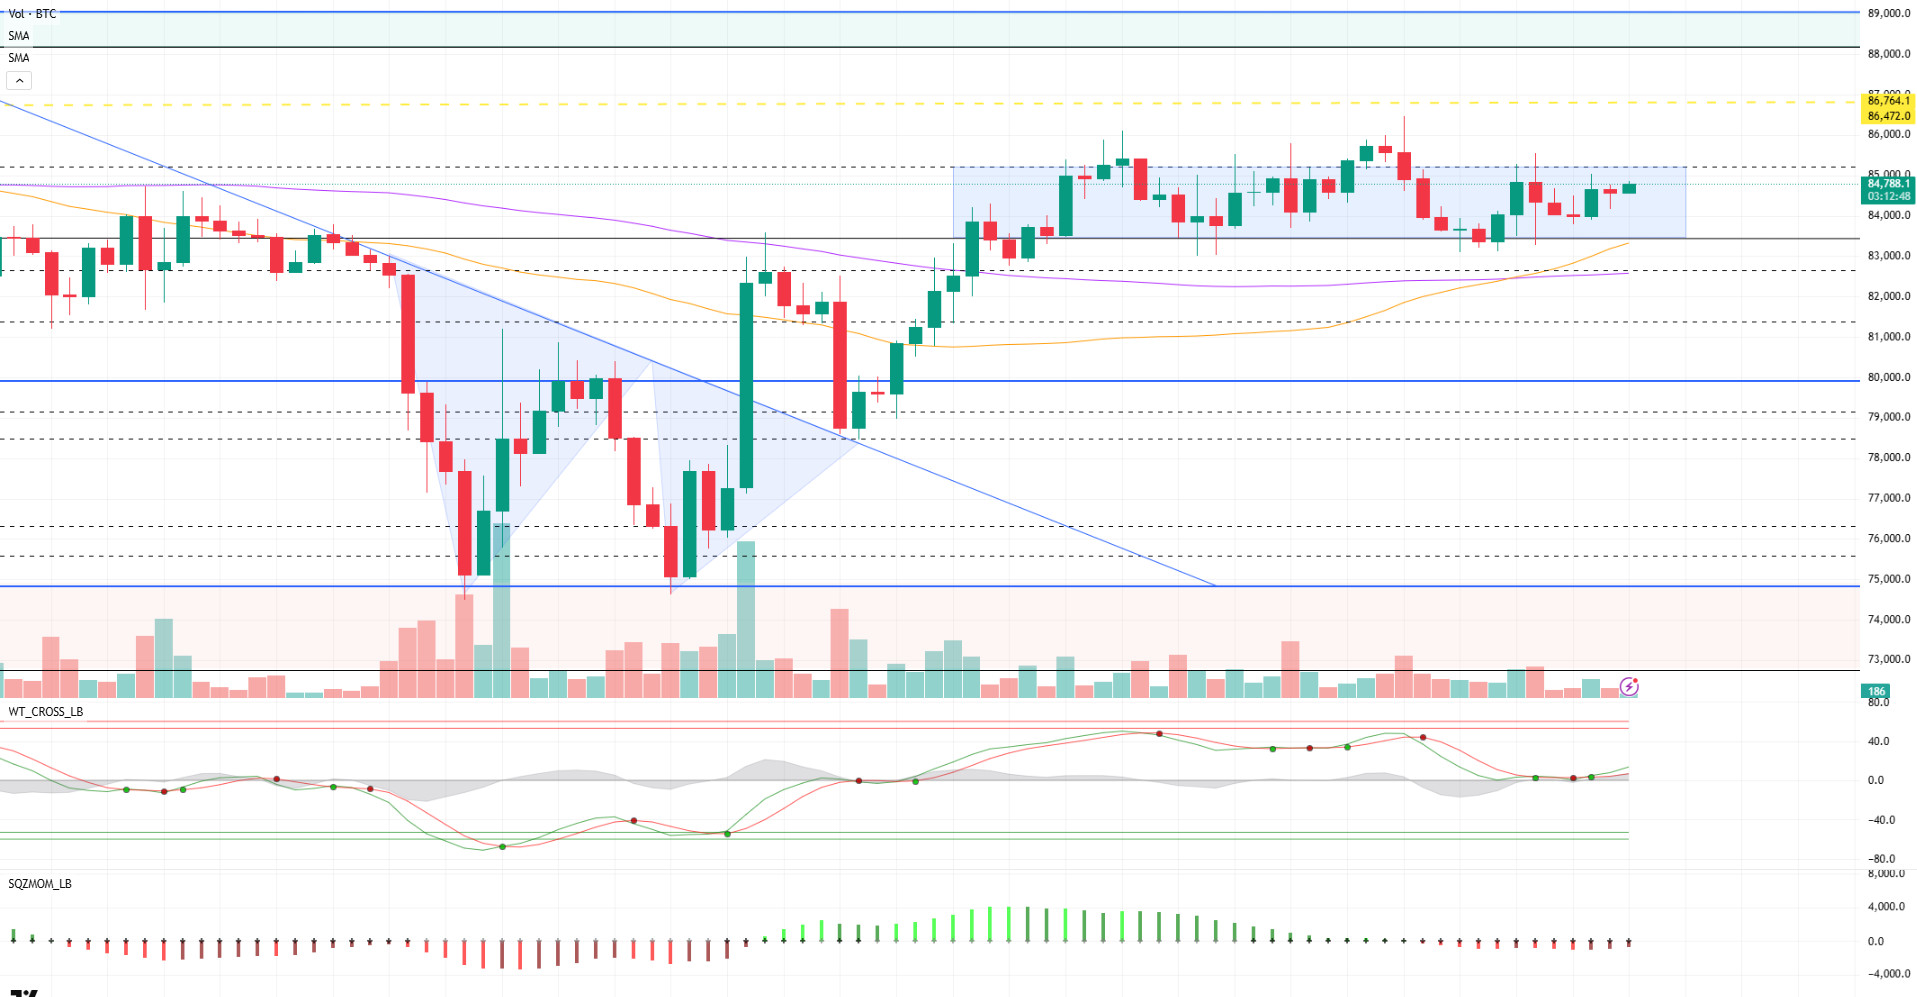
Looking at the technical outlook, BTC continues to consolidate in a horizontal band range. In this process dominated by low volatility, the price behavior following the rising trend structure points to a “high tight flag” pattern. If the breakout point of this pattern, the 85,200 level, is exceeded in volume, the price can be expected to first target the liquidation zones in the range of 86,472 – 86,764, while hourly closes above these levels bring the 88,000 level back to the agenda. Looking at the technical indicators, the Wave Trend Oscillator has started to generate a buy signal, supporting the positive outlook. At the same time, the SMA 50 crossing the SMA 100 to the upside indicates that the bullish scenario is technically strengthening. However, in order for these technical structures to turn into a strong and sustainable movement, it remains important to see an increase in volume and supportive developments on the fundamental side. Technically, an upside breakout can be expected to follow this consolidation phase with the effect of the pattern. However, in a possible pullback scenario, the 83,500 level remains important as a strong reference and support point.
Supports 83,500 – 81,500 – 80,000
Resistances 85,200 – 86,600 – 89.000
ETH/USDT
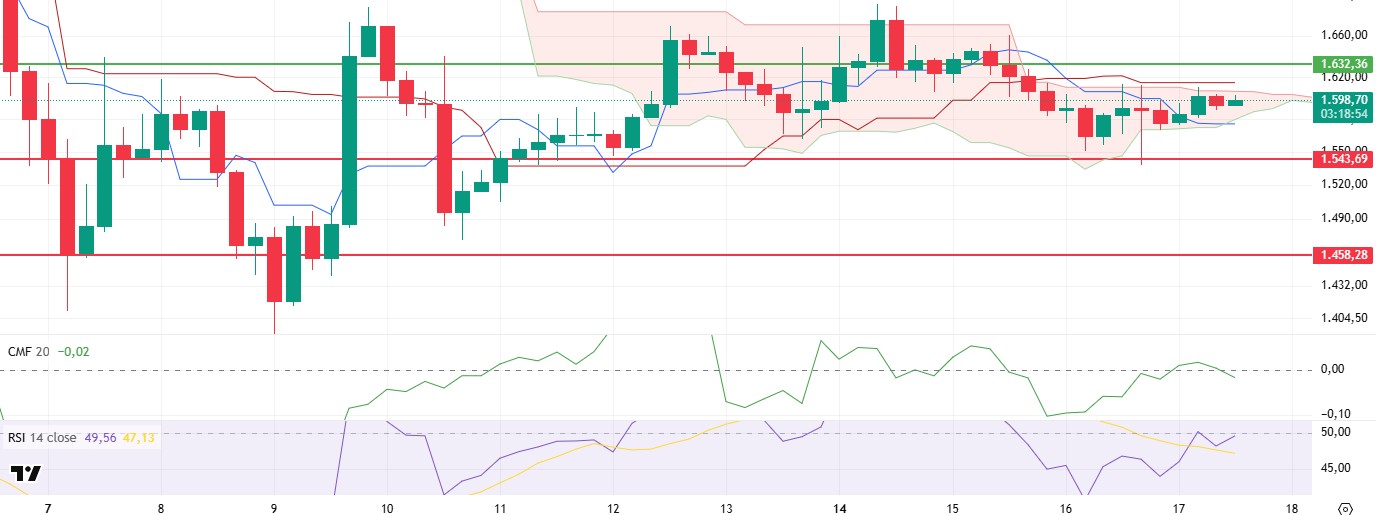
ETH is trying to stabilize around the $1,600 level, moving in a narrow price range during the day. A short-term rebound attempt in the morning hours led to limited changes in some technical indicators. But overall, price action is still stuck in a band characterized by uncertainty.
Although the Chaikin Money Flow (CMF) indicator signaled a short-term capital inflow by shifting into positive territory in the morning, it failed to maintain this momentum during the day and fell back into negative territory. Although this pullback does not constitute a structural weakness in technical terms, it can be interpreted that liquidity inflows to spot markets may gain momentum if CMF moves into positive territory in the evening. This movement of CMF may be a supportive factor, especially if the price breaks to the upside. Relative Strength Index (RSI) has turned up again during the intraday fluctuations with support from the based MA line. This uptrend confirms the increase in momentum and increases the potential for the price to test short-term resistances. The positive trend of the RSI strengthens the possibility of the price breaking out of the narrow range. The Ichimoku indicator shows that the downtrend at the tenkan level has stopped and the price is stuck between the kumo cloud and the tenkan and kijun levels. This structure creates a critical zone of indecision in terms of market direction. The tight structure of the kumo cloud may increase the impact of a possible breakout. For this reason, it is of great importance to follow these levels in terms of both upward and downward price movements.
In the current outlook, in order for ETH to gain upside momentum in the evening hours, it must first break through the upper band of the kumo cloud at $1,607 resistance and the kijun level at $1,614. A close above these levels could generate an important signal for the market to turn its direction upwards. On the other hand, in a downside scenario, if the $1,574 level, the lower limit of the kumo cloud, is breached, the price can be expected to retest the $1,543 support. Below this level, the possibility of increased selling pressure should be considered.
Supports 1,543 – 1,458 – 1,369
Resistances 1,632 – 1,756 – 1,925
XRP/USDT
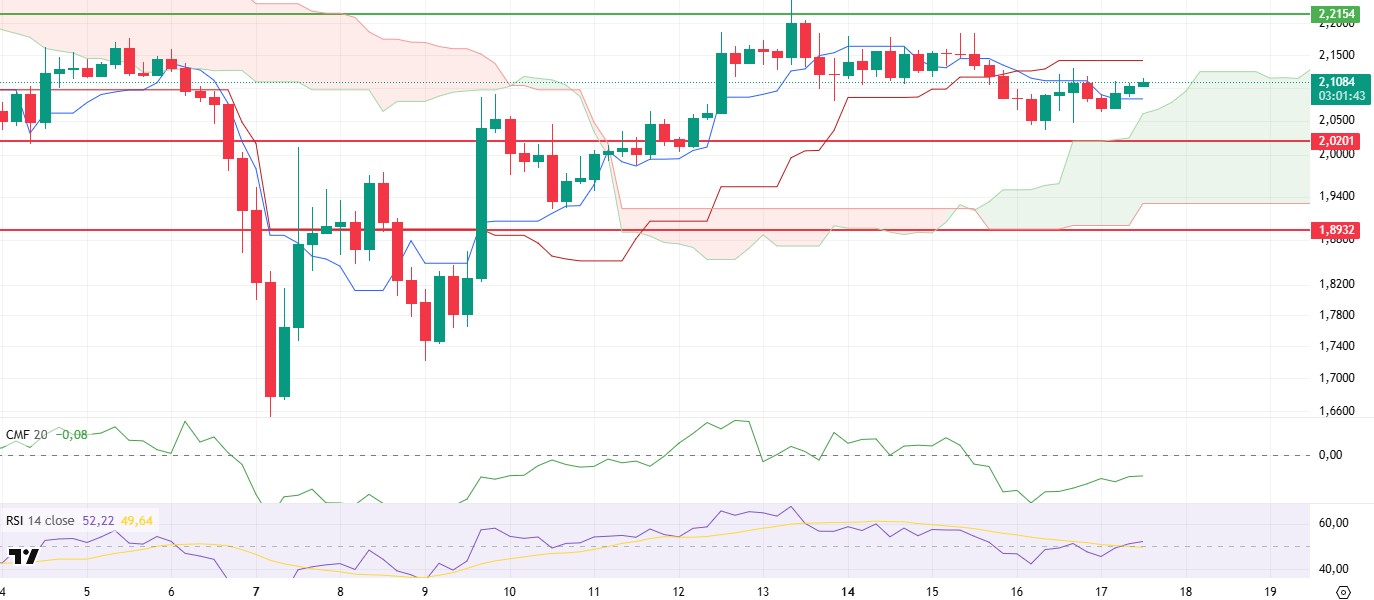
XRP managed to hold above the $2.10 level, maintaining its sideways trend with a slight positive trend during the day. This stability in price movements, together with the positive outlook supported by technical indicators, indicates that the upside potential is maintained in the short term.
Momentum indicators have gained strength, especially with the Relative Strength Index (RSI) indicator moving upwards away from the based MA line. This movement in the RSI suggests that the market has increased buying pressure and the positive structure continues. On the other hand, although the Chaikin Money Flow (CMF) indicator is still in negative territory, its recovery trend gives positive signals regarding market liquidity. The Ichimoku indicator, on the other hand, is more cautious. The current negative outlook formed by the intersection of tenkan and kijun levels has not yet been broken. However, despite this negative picture, the fact that the price has regained the tenkan level and continues to stay above the kumo cloud shows that there is no clear sell signal yet and downward pressure remains limited. In particular, the fact that the price holds above the cloud reveals that the overall structure is still positioned in a region close to neutral to positive.
In this context, XRP’s price action in the evening hours is critical. In the upside scenario, breaking through the kijun resistance at $2.14 could enable the price to accelerate up to $2.21. If this resistance level is broken in a voluminous way, it may pave the way for harder and permanent rises. On the other hand, in the event of a downside break, a break below the $2.02 support could be the beginning of a new downtrend for XRP. This level is the critical threshold for the short-term outlook not to turn negative.
Supports 2.0201- 1.8932 – 1.6309
Resistances 2.2154 – 2.3938 – 2.4721
SOL/USDT
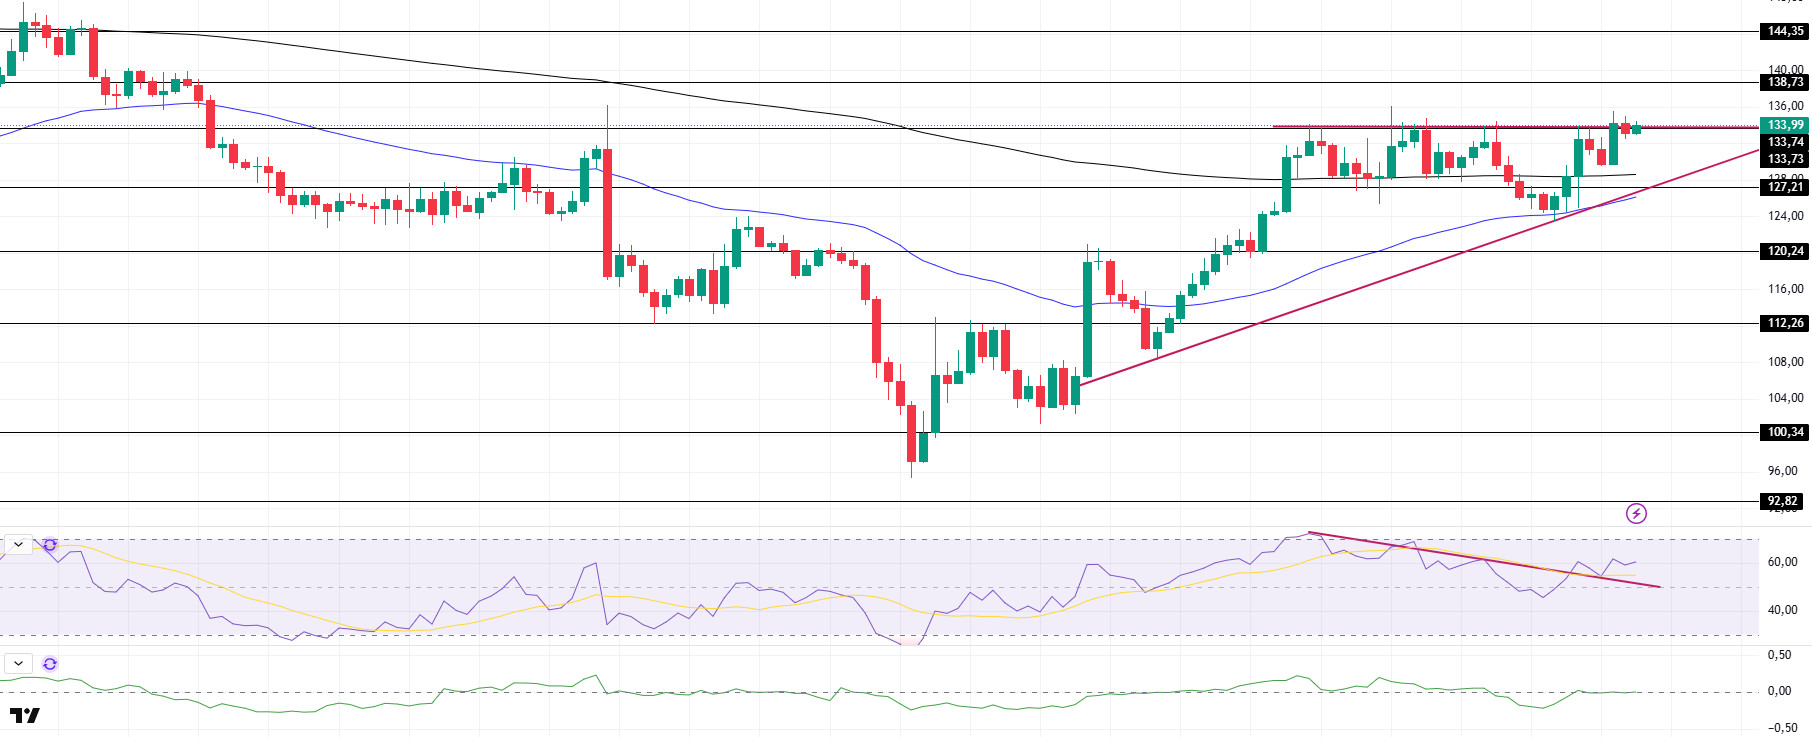
SOL moved sideways during the day. The asset is currently testing the $133.74 level, which is the resistance of the ascending triangle pattern. The price, which had tested here 3 times before, could not break here. If it breaks here, the $144.35 level appears as a strong resistance place. On the 4-hour timeframe, the 50 EMA (Blue Line) is below the 200 EMA (Black Line). This could continue the decline in the medium term. At the same time, the price continues to move above the two moving averages. This shows that there is buying pressure in the market. The Chaikin Money Flow (CMF)20 indicator is at a neutral level. However, positive daily volume may move CMF into positive territory. Relative Strength Index (RSI)14, on the other hand, broke the downtrend that started on April 12 to the upside and accelerated from there, turning the downtrend into a support zone. This may increase buying pressure. The $144.35 level appears as a resistance point in the rises driven by the upcoming macroeconomic data and the news in the Solana ecosystem. If it breaks here, the rise may continue. In case of retracements for the opposite reasons or due to profit sales, the support level of $ 127.21 can be triggered. If the price comes to these support levels, a potential bullish opportunity may arise if momentum increases.
Supports 127.21 – 120.24 – 112.26
Resistances 133.74 – 138.73 – 144.35
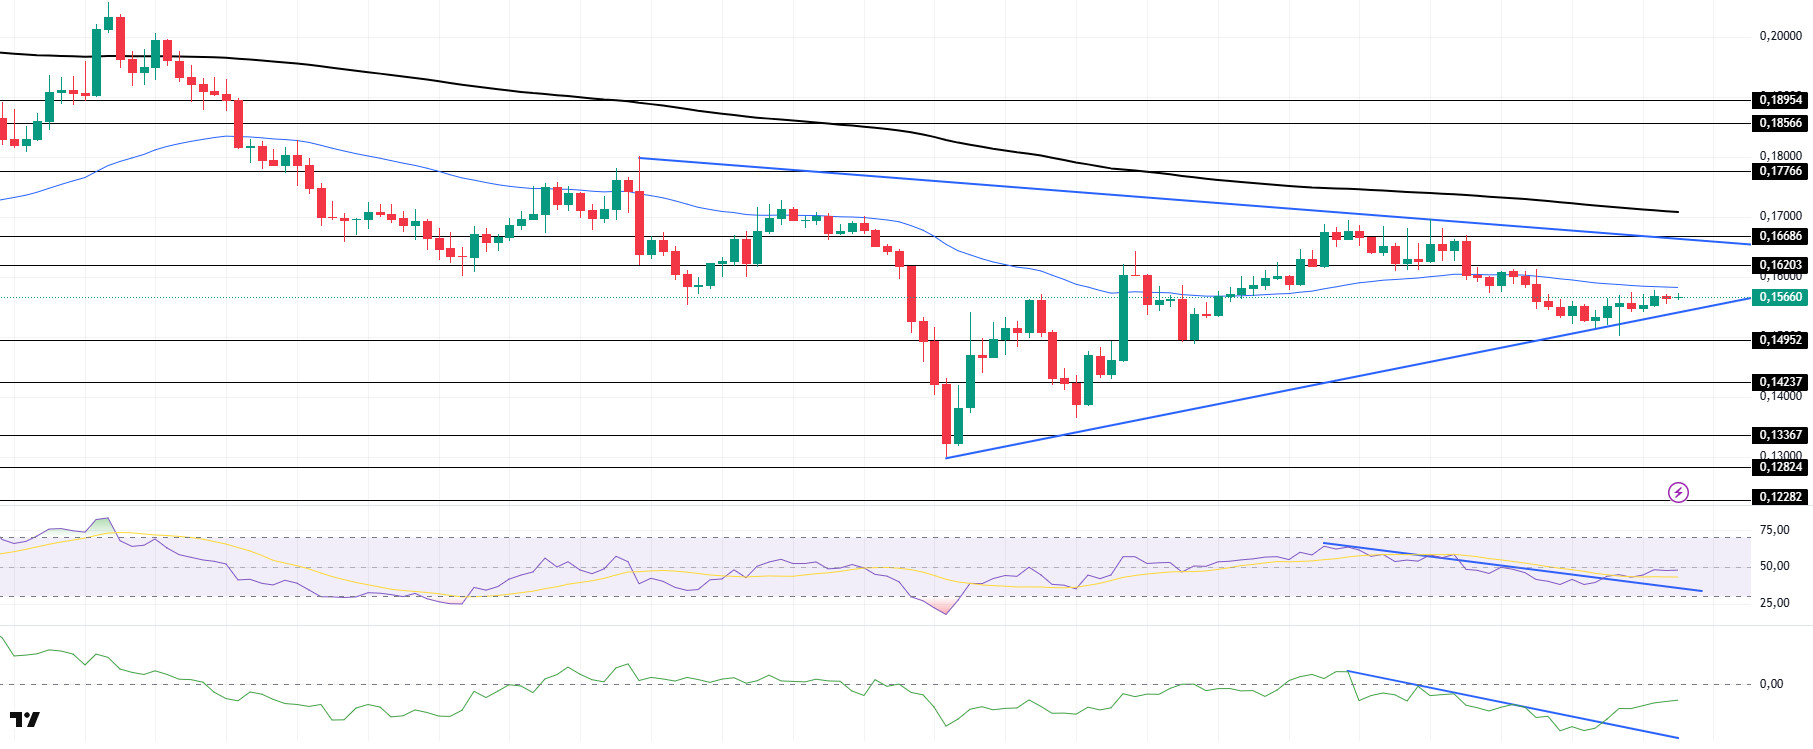
DOGE/USDT
DOGE continues to move within a symmetrical triangle pattern. The asset is poised to test the moving average of 50 EMA (Blue Line) as resistance. The slightly bearish price accelerated and turned bullish, taking support from the base level of the symmetrical triangle pattern. On the 4-hour timeframe, the 50 EMA (Blue Line) remains below the 200 EMA (Black Line). This may mean that the decline may continue in the medium term. However, the price continued to price below the two moving averages. This shows us that selling pressure continues. When we examine the Chaikin Money Flow (CMF)20 indicator, it continued to be in negative territory. In addition, the 24-hour volume is slightly positive. However, decreasing outflows and breaking the trend upwards may increase inflows. On the other hand, Relative Strength Index (RSI)14 is at neutral level and broke the downtrend that started on April 12. This could be a bullish harbinger. The $0.16686 level stands out as a very strong resistance point in the rises due to political reasons, macroeconomic data and innovations in the DOGE coin. In case of possible retracements due to political, macroeconomic reasons or due to negativities in the ecosystem, the $0.14952 level, which is a strong support place, is an important support place. If the price reaches these support levels, a potential bullish opportunity may arise if momentum increases.
Supports 0.14952 – 014237 – 0.13367
Resistances 0.16203 – 0.16686 – 0.17766
Legal Notice
The investment information, comments and recommendations contained herein do not constitute investment advice. Investment advisory services are provided individually by authorized institutions taking into account the risk and return preferences of individuals. The comments and recommendations contained herein are of a general nature. These recommendations may not be suitable for your financial situation and risk and return preferences. Therefore, making an investment decision based solely on the information contained herein may not produce results in line with your expectations.
