
TECHNICAL ANALYSIS
BTC/USDT
While US President Trump emphasized the importance of economic power in global negotiations by saying, “He who has the gold makes the rules,” this discourse triggered a 0.65% increase in gold prices. Japan-based Metaplanet bought another 330 BTC, increasing its holdings to 4,855 BTC. In addition, Senator Cynthia Lummis’ strategic Bitcoin reserve proposal could open the door to a new era in the US crypto reserve policy. Today, eyes will turn to Bitcoin purchases on the Crypto front, with MicroStrategy founder Michael Saylor sharing a new Bitcoin Tracker.
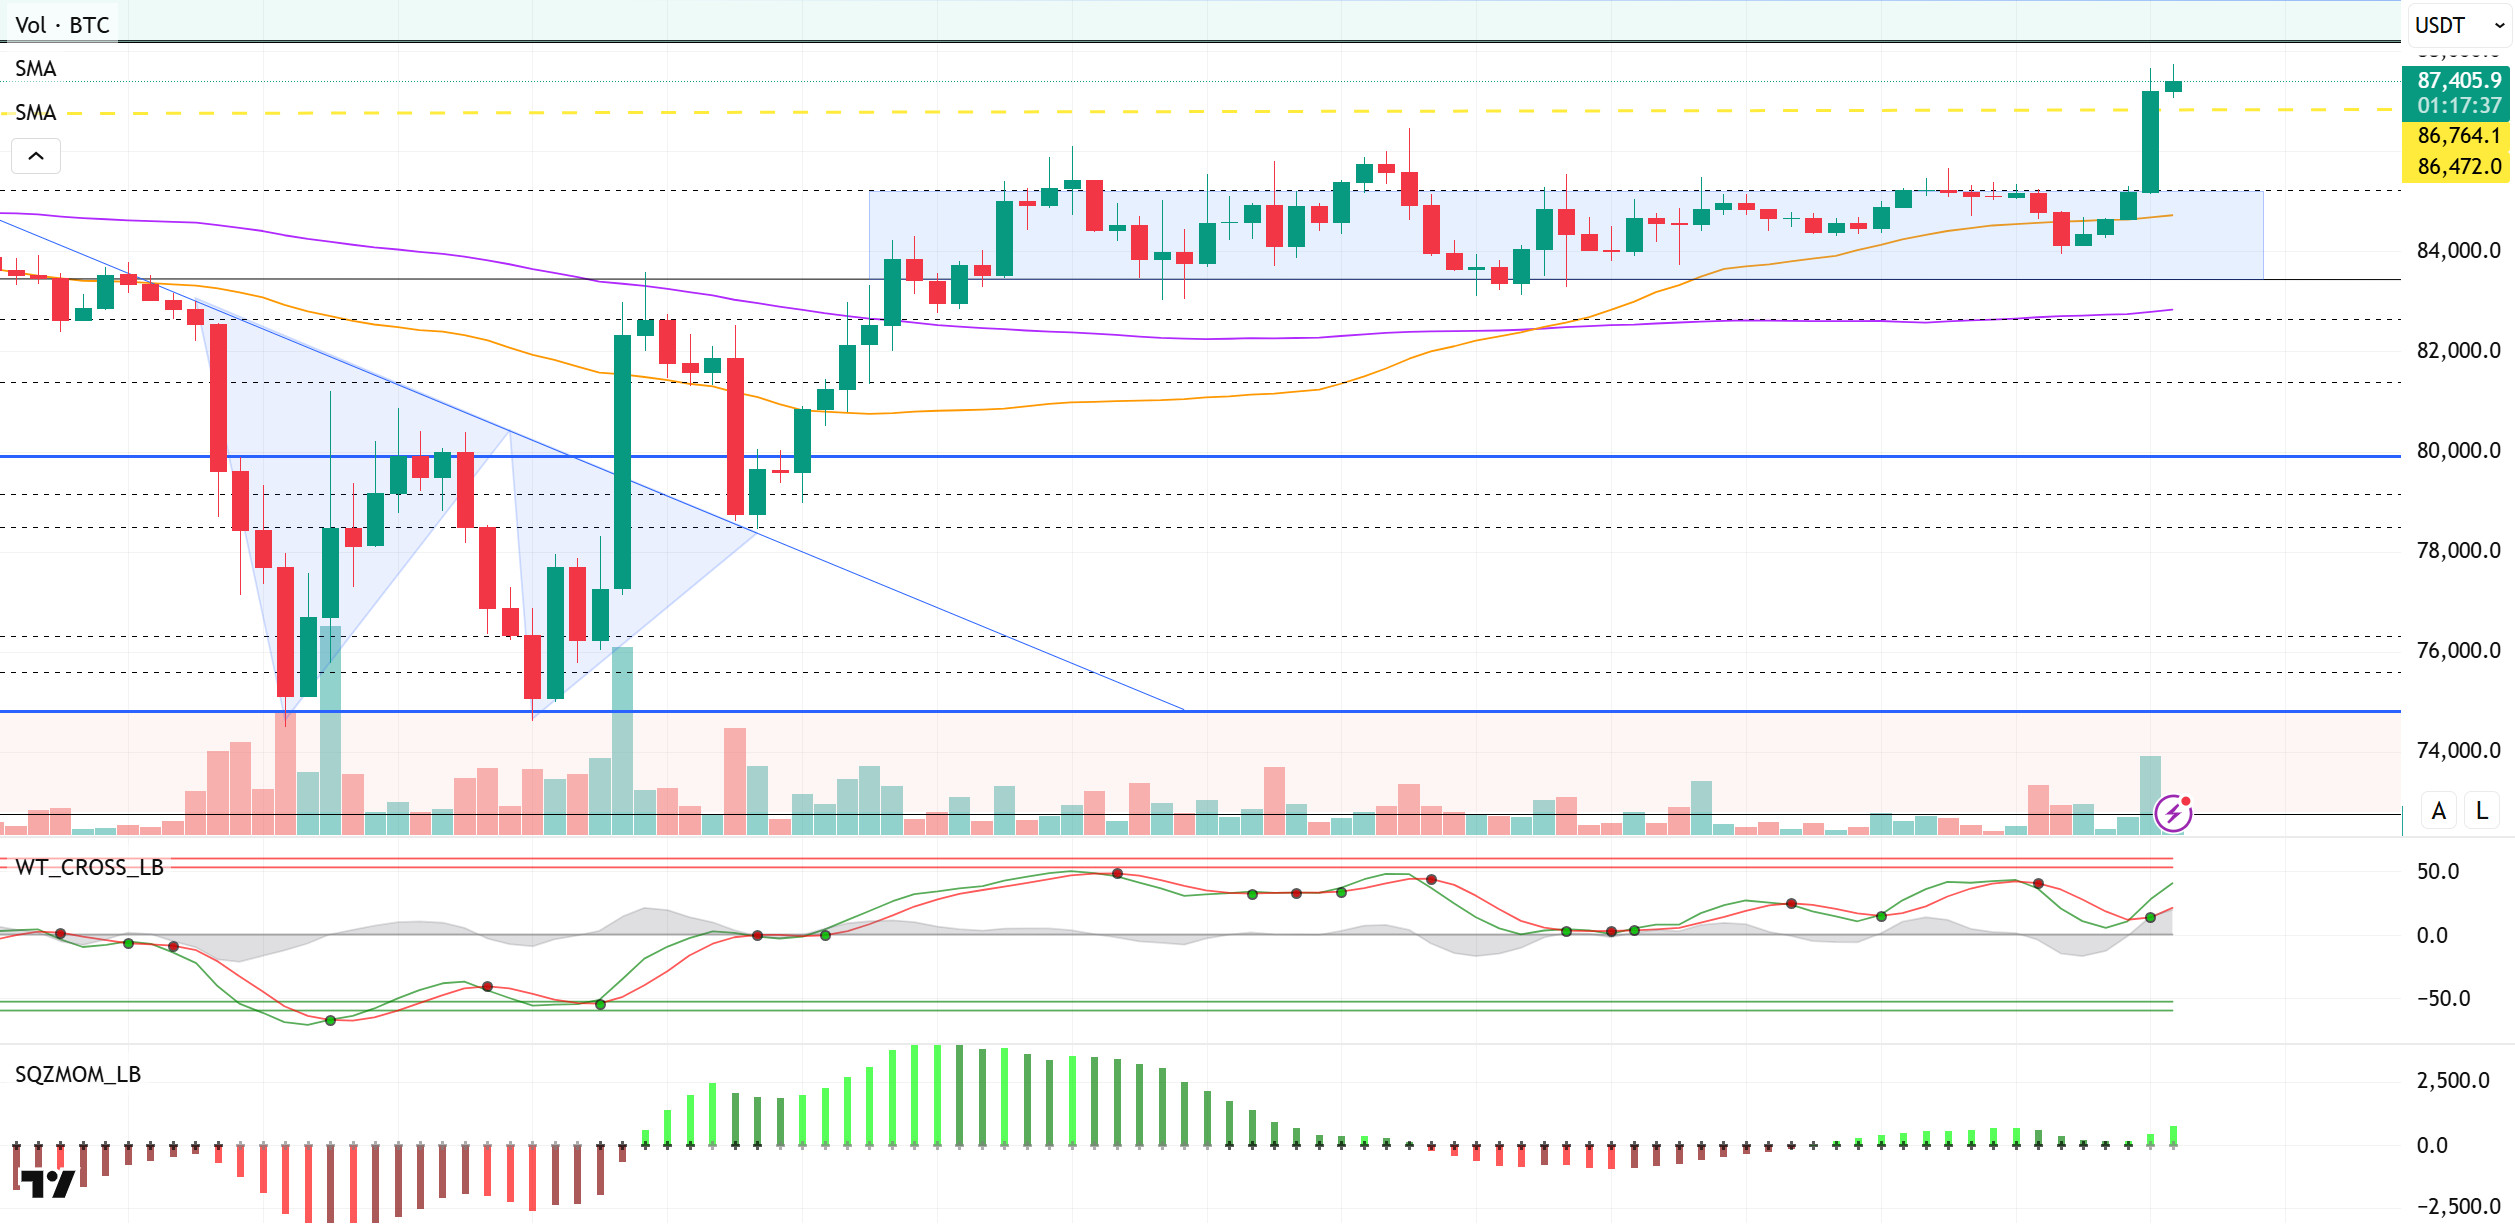
When we look at the technical outlook, we have stated in previous analyses that BTC has entered a consolidation phase in line with the high tight flag pattern. After completing this consolidation process over the weekend, BTC turned its direction upwards in line with the pattern. The 85,200 level, which has been acting as resistance for a long time, was crossed with a voluminous breakout as of last night and the price surpassed the liquidation levels in the 86,472 – 86,764 band and recorded a strong rise. At the time of writing, BTC is trading at 87,530. On the technical indicators, the Wave Trend Oscillator continues to maintain its buy signal, while momentum indicators are also gaining positive momentum. This indicates that the uptrend is technically supported in a healthy way. In the continuation of the rise, the next 88,000-89,000 range stands out as a strong resistance zone in the short term. If these levels are tested, profit selling and a correction can be expected as technical indicators reach saturation point. In such a scenario, the broken 86,600 level will be followed as the first strong support point. With this latest rise, it can be said that BTC has entered a medium-term uptrend and the tariff-related negative sentiment that has dominated the market in recent weeks has started to fade. On the fundamental side, trade talks between countries and mutual reconciliation expectations will continue to be on the agenda in the coming period. On the other hand, the Trump-Powell conflict should be carefully monitored as a new fundamental element that may affect market dynamics.
Supports 86,600 – 85,200 – 83,500
Resistances 88,100 – 89.000 – 91,800
ETH/USDT
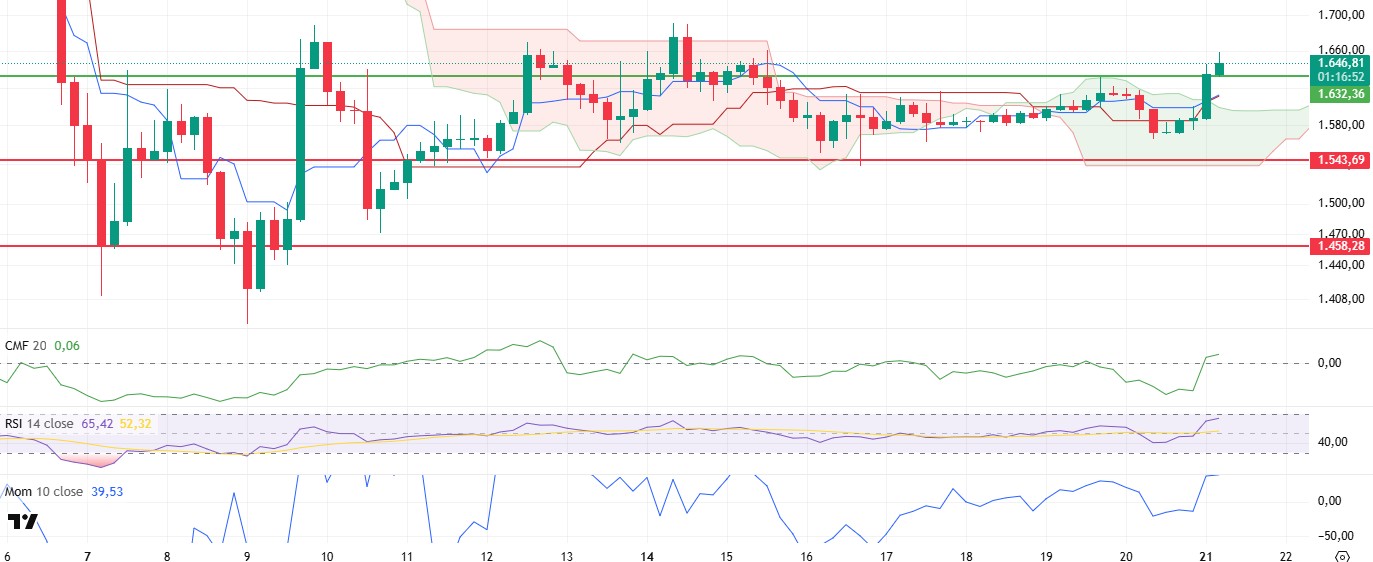
In parallel with the general bullish movement observed in the crypto market yesterday evening, ETH managed to break through the important resistance point at the level of $1,632. This move also led to significantly positive signals on the technical indicators.
In particular, the Chaikin Money Flow (CMF) indicator, which measures liquidity flow, accompanied this rise in price and moved into positive territory, indicating that the buy side is gaining strength in the market. CMF’s persistence in positive territory signals that investors’ interest in Ethereum is growing and capital inflows are continuing. Likewise, the Relative Strength Index (RSI) indicators, which assess momentum and the market’s overbought or oversold conditions, showed a strong upward momentum along with the price. The fact that there was no negative divergence during this rise, meaning that the indicators did not lag behind as the price increased, suggests that the technical outlook is on a healthy footing. The fact that the momentum is so strongly upward suggests that the appetite for buying may continue in the short term. The evaluation of the Ichimoku indicator also supports this positive picture. The fact that the price has risen above both the kumo cloud and the tenkan and kijun levels indicates that the market has overcome its short and medium-term resistance and the upward structure is strengthening. In particular, the fact that the tenkan level cuts the kijun level upwards is interpreted as a “bullish crossover” for Ichimoku, which supports that the trend may gain strength.
When the overall technical structure is evaluated, if the $1,632 level is broken upwards and this region becomes support, it is among the possible scenarios that the price will accelerate towards its next target of $1,756. However, maintaining this level is critical for the continuation of the short-term bullish structure. Otherwise, if the $1,632 level is breached downwards, there may be a potential for a retracement to the kumo cloud in the first place and then to the $1,543 level. Therefore, although positive signals are at the forefront of the short-term outlook, it should be carefully monitored whether the $1,632 zone is working as support.
Top of Form
Below the Form
Supports 1,632 – 1,543 – 1,458
Resistances 1,756 – 1,925 – 2,131
XRP/USDT
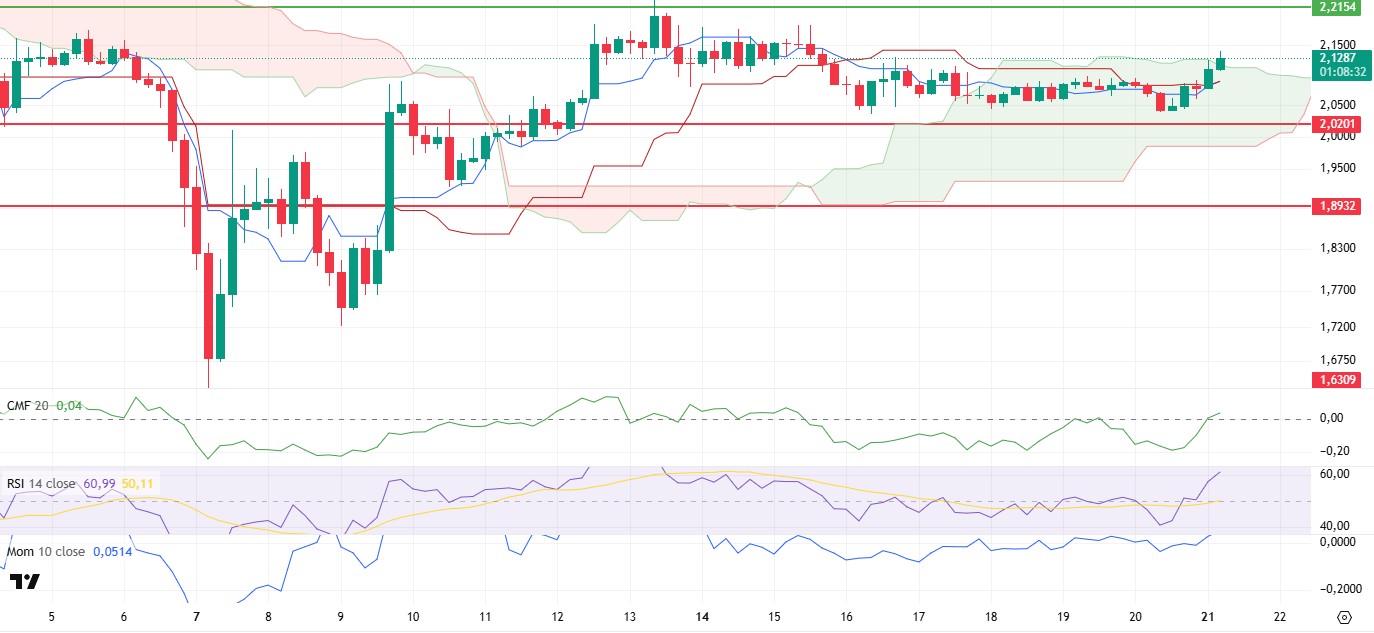
XRP made a very strong start to the week, breaking the $2.11 level, which is the sand cloud resistance. This move showed that the price, which has been moving horizontally in a narrow range for a long time, has exited the consolidation process, while paving the way for significant improvements in technical indicators.
The Chaikin Money Flow (CMF) indicator, which measures intra-market liquidity flow, moved back into positive territory with this rise. This indicates that capital inflows to the market accelerated, and buyers started to gain strength in spot markets. The persistence of CMF in the positive zone suggests that the rise is not just a short-term bounce, but also a structural strengthening on the buying side. The Ichimoku indicator is also generating important signals that support this technical bullishness. The fact that the price has broken above both the kumo cloud and the tenkan and kijun levels suggests that the short and medium-term resistances have been overcome to the upside and the positive trend is strengthening. From an Ichimoku perspective, breaking through these levels shows that the market is now generating buy signals even on higher timeframes. In particular, the re-crossing of the tenkan level to the upside of the kijun level is considered a bullish crossover, and this structure provides a strong technical argument for the continuation of the bullish momentum in the market. The synchronized positive reaction of momentum indicators to this upward movement is an additional confirmation of the technical outlook. An increase in momentum indicates not only that the price is moving higher, but also that there is an accelerating buying power behind the uptrend. This scenario supports expectations that the uptrend may continue on a more stable basis.
When evaluated within the framework of the general technical structure, it seems likely that the price will move towards the next resistance point of $2.21 if XRP passes the $2.11 level and maintains above this level. However, as a result of a profit sale that may occur in this region or selling pressure from resistance, it is also possible that the price may retreat towards the kumo cloud again. In the event of such a correction, the $2.02 level stands out as the most critical support area in both psychological and technical terms, and whether the price can maintain this level will be decisive in terms of the medium-term technical outlook.
Supports 2.0201- 1.8932 – 1.6309
Resistances 2.2154 – 2.3938 – 2.4721
SOL/USDT
Following SIMD-228’s failure to achieve consensus, Galaxy Research continues to push the MESA (Multiple Election Stake-Weight Aggregation) system, which aims to bring a more inclusive approach to the voting process. Breakpoint, Solana’s largest community event, will kick off on April 25th. Opensea, one of the largest nft marketplaces, opened SOL token trading. On the other hand, according to Foresight News, Galaxy Digital has withdrawn 606,000 SOL tokens worth about $79.7 million from exchanges in the last four days.
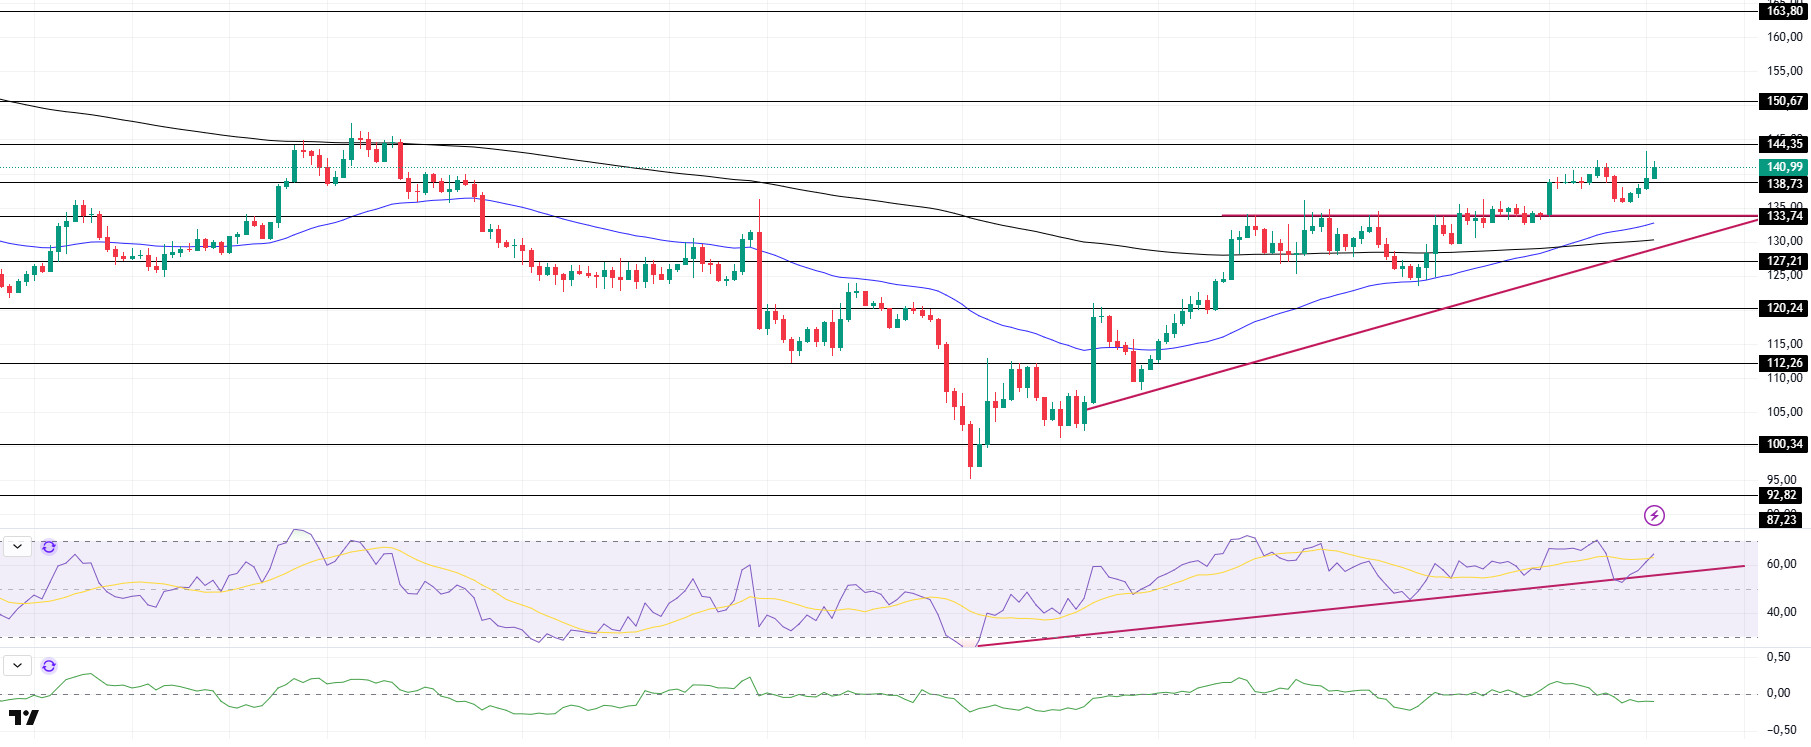
SOL continued its bullish run over the weekend. The asset broke the resistance of the ascending triangle pattern at $133.74, up about 5.5%, and continues to accelerate towards the strong resistance at $144.35. If it reaches this level, the double top pattern may work and cause a pullback. On the 4-hour timeframe, the 50 EMA (Blue Line) started to hover above the 200 EMA (Black Line). This could be a bullish start in the medium term. At the same time, the price continues to move above the two moving averages. This shows that there is buying pressure in the market. When we analyze the Chaikin Money Flow (CMF)20 indicator, it is at a negative level. However, the positive daily volume may move CMF to the positive area. Relative Strength Index (RSI)14, on the other hand, continued its upward trend that started on April 7. This may increase buying pressure. The $150.67 level appears as a resistance point in the rises driven by the upcoming macroeconomic data and the news in the Solana ecosystem. If it breaks here, the rise may continue. In case of retracements for the opposite reasons or due to profit sales, the support level of $ 133.74 can be triggered. If the price comes to these support levels, a potential bullish opportunity may arise if momentum increases.
Supports 138.73 – 133.74 – 127.21
Resistances 144.35 – 150.67 – 163.80
DOGE/USDT
Dogecoin holders celebrated Doge Day on April 20th, marking the meme coin’s unofficial holiday. Options volumes increased by 219% in the last 24 hours.
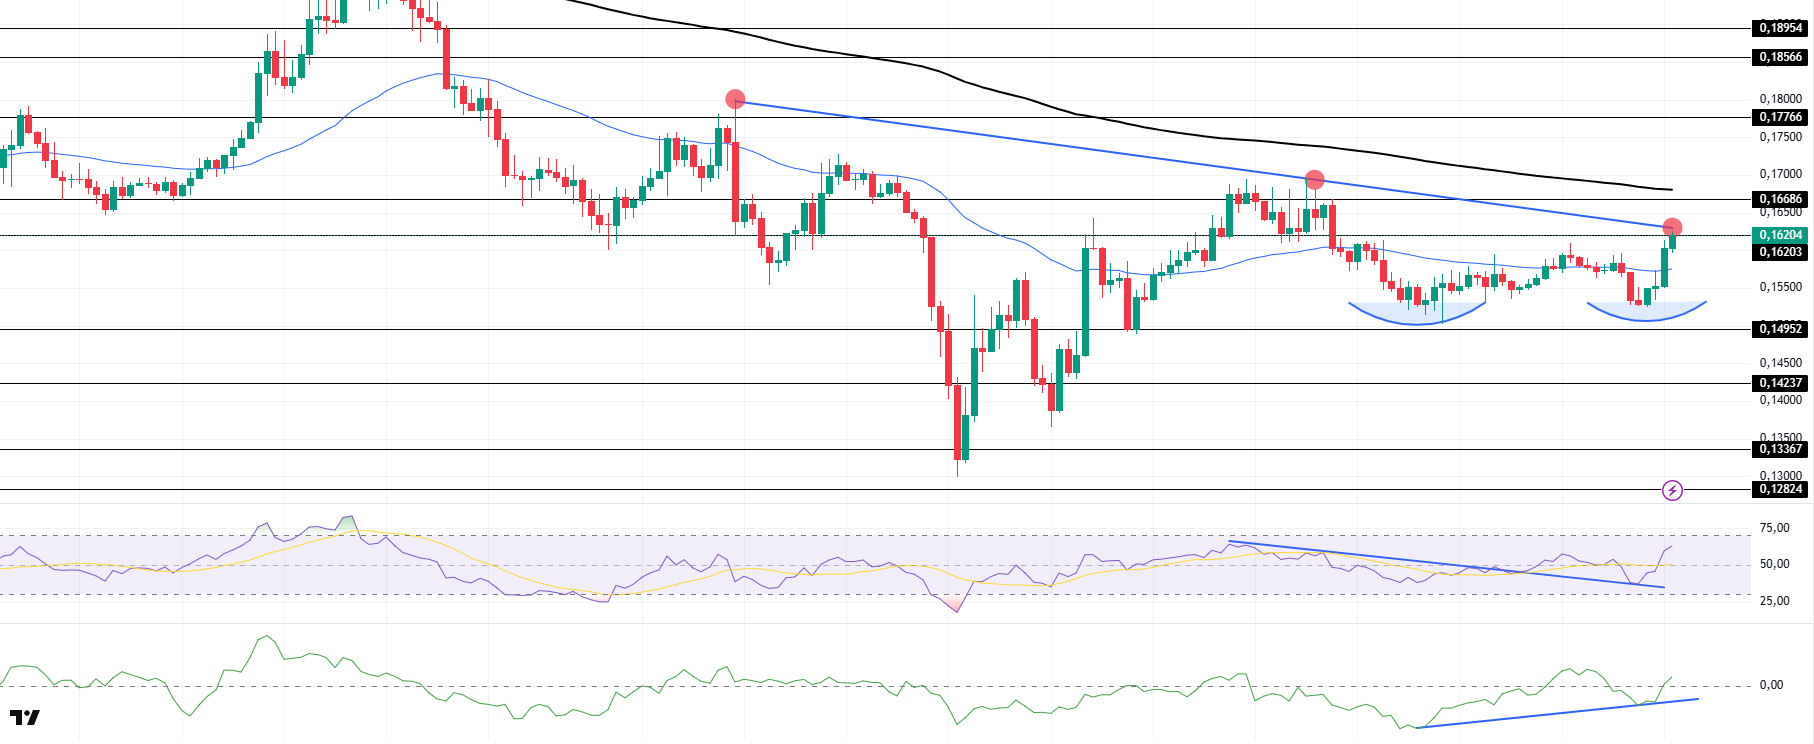
DOGE rallied by around 6% over the weekend. The asset is currently testing the downtrend that started on April 2. If it fails to break here, the $0.14952 level may test as support. If it breaks it, the 200 EMA (Black Line) may be triggered as resistance. In addition, a double bottom formation has formed. This should be taken into account. On the 4-hour timeframe, the 50 EMA (Blue Line) continues to be below the 200 EMA (Black Line). This may mean that the decline may continue in the medium term. However, the price started to price between two moving averages. This shows us that the price is in the decision phase. When we examine the Chaikin Money Flow (CMF)20 indicator, it moved into positive territory and continued the uptrend that started on April 16. In addition, the positive 24-hour volume may move CMF to higher levels. On the other hand, Relative Strength Index (RSI)14 moved into positive territory. On April 12, it broke the downtrend and tested the trend as a support and then rallied. The $0.16686 level stands out as a very strong resistance point in the rises due to political reasons, macroeconomic data and innovations in the DOGE coin. In case of possible retracements due to political, macroeconomic reasons or negativities in the ecosystem, the $0.14952 level, which is a strong support place, is an important support place. If the price reaches these support levels, a potential bullish opportunity may arise if momentum increases.
Supports 0.14952 – 014237 – 0.13367
Resistances 0.16203 – 0.16686 – 0.17766
Legal Notice
The investment information, comments and recommendations contained herein do not constitute investment advice. Investment advisory services are provided individually by authorized institutions taking into account the risk and return preferences of individuals. The comments and recommendations contained herein are of a general nature. These recommendations may not be suitable for your financial situation and risk and return preferences. Therefore, making an investment decision based solely on the information contained herein may not produce results in line with your expectations.
