
TECHNICAL ANALYSIS
BTC/USDT
Strategy bought 6,556 Bitcoin during the week of April 14-20 at an average price of $84.785. A total of $555.8 million was spent on this purchase, further strengthening the company’s BTC position. With purchases over the last two weeks, it reveals the continued demand on the institutional side and the company’s commitment to its long-term Bitcoin strategy.
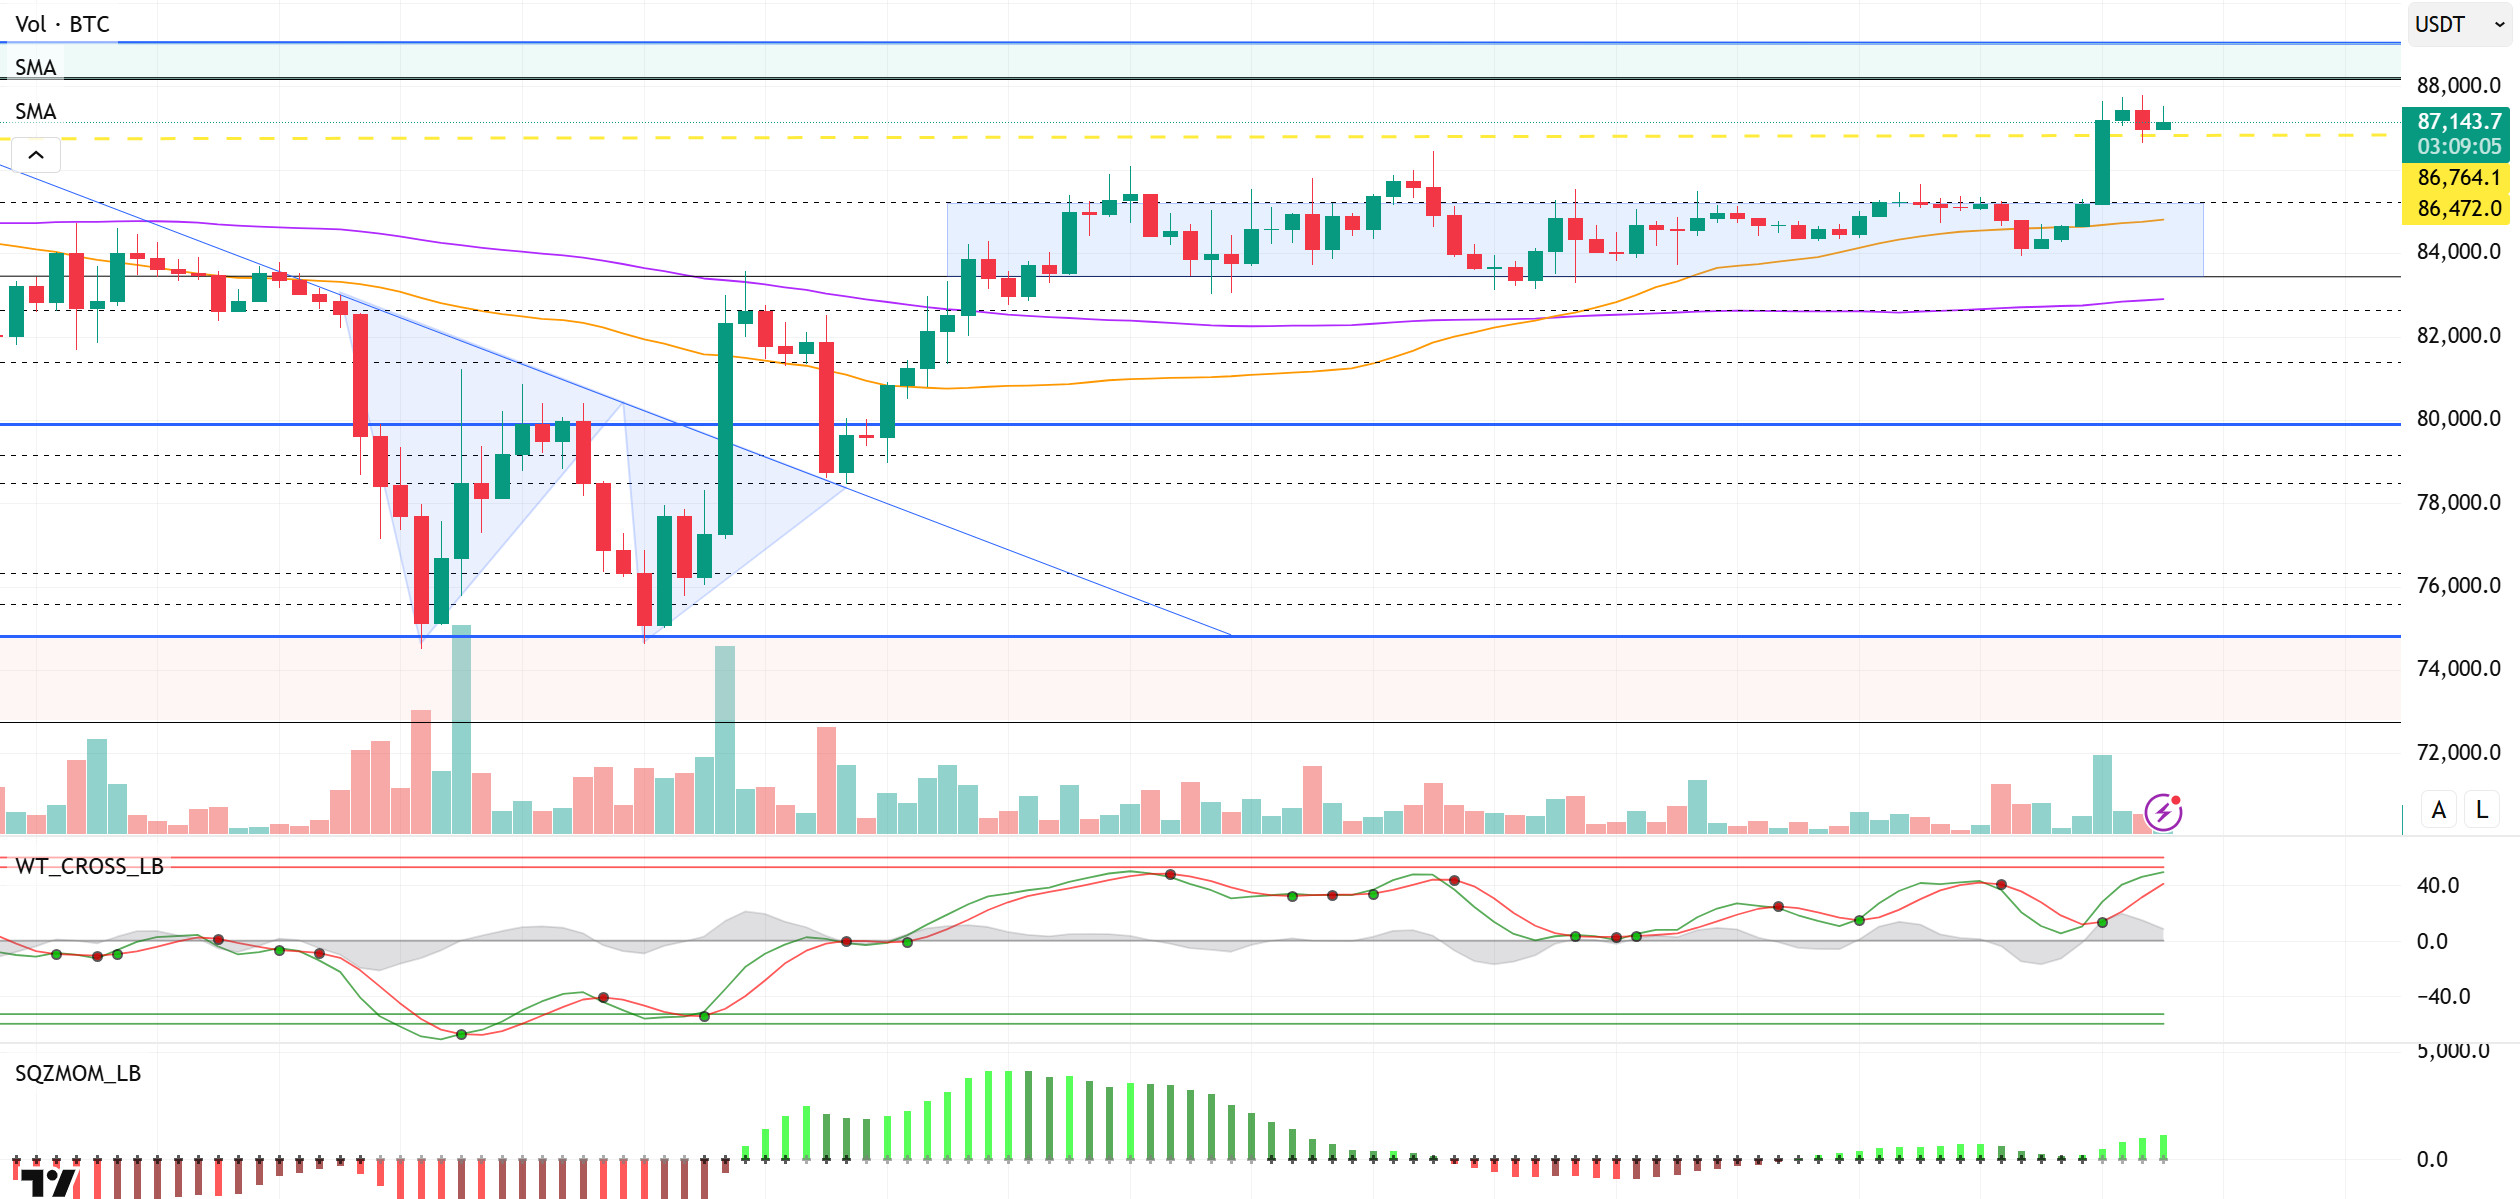
When we look at the technical outlook, BTC tested the 87,700 level during the day and then retreated a bit to the support level of 86,600. However, the price rebounded from this level and with the news of Stategy’s BTC purchase, it turned its direction upwards and is currently trading at 87,300. The Wave Trend Oscillator is producing a weakening buy signal in overbought territory, while the momentum indicator remains in positive territory. This suggests that upside potential remains in the short term but caution is warranted. BTC’s technical structure is still in line with the high tight flag pattern. With the breakout breaking above the breakout level, the price performed a liquidity cleanse by targeting liquidation zones. While this move shows a strong technical structure, it should be noted that the current uptrend may be nearing its limits. In the continuation of the rise, the 88,000-89,000 area, the green band range we pointed out earlier, appears as a strong resistance area. In the BTC price approaching this region, a selling pressure may occur due to profit realizations. In such a scenario, the 86,600-support level will again be followed as an important reference point. It can be said that fundamental developments will be the driving force for the price to exceed this resistance zone. In particular, trade talks between countries and signals of mutual compromise may positively affect market perception. On the other hand, the Trump-Powell political rivalry should be carefully monitored as a new fundamental element that may put pressure on market dynamics.
Supports 86,600 – 85,200 – 83,500
Resistances 88,100 – 89.000 – 91,800
ETH/USDT
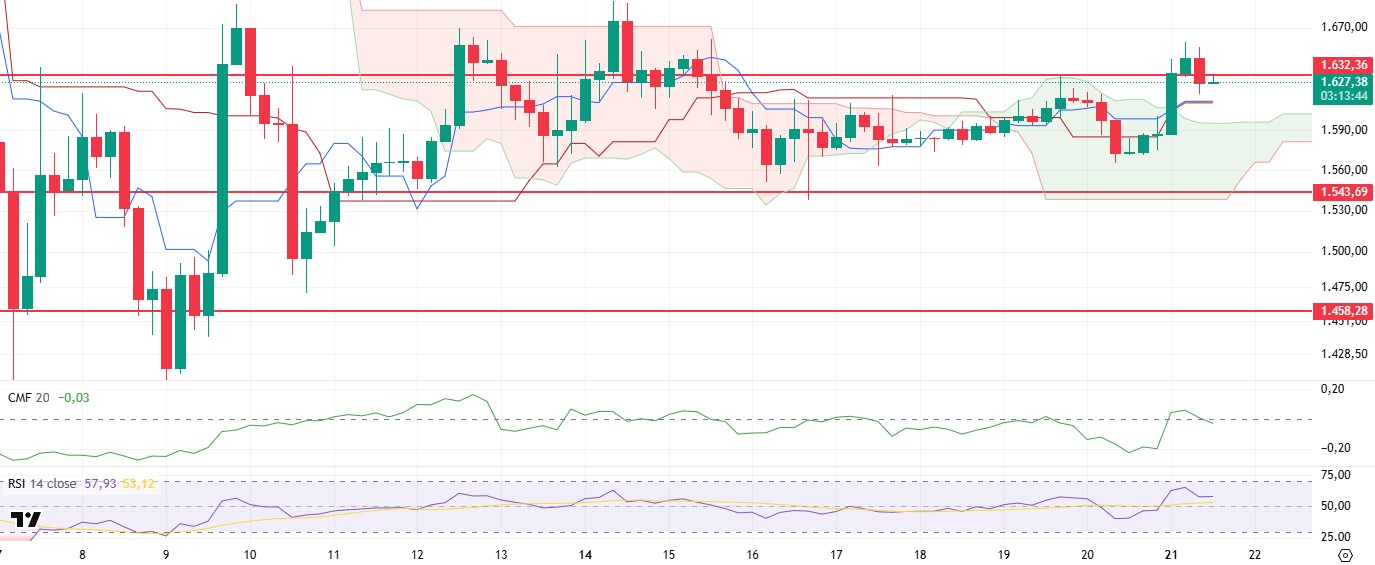
ETH retreated below the $1,632 level, affected by the weakness seen in the pre-market pricing of the US stock markets during the day. Although this decline led to a limited weakening in short-term technical indicators, it is observed that the positive structure continues in the overall technical outlook.
Especially in terms of the ichimoku indicator, the fact that the price continues to remain above both the tenkan and kijun levels indicates that the current structure maintains its upward trend. This suggests that despite short-term corrections, the market has found support and the upside potential continues. On the other hand, the Chaikin Money Flow (CMF) indicator weakened to zero after the bullish move in the morning hours. If CMF moves into the negative territory, this could confirm that liquidity entering the market is decreasing and there could be a potential change in direction. However, for the time being, the effort to stay above this level could be taken as a sign that the decline could be a temporary re-test move. In this context, it is critical that the indicator remains above zero. Relative Strength Index (RSI), on the other hand, continues to maintain its structurally positive zone despite the current correction. The fact that the RSI is still in an upward trend supports the possibility that the price may regain momentum. The fact that the indicator is far from the overbought or oversold zones indicates that the current movement is taking place within a balanced market structure.
When all this technical data is considered together, there is a strong possibility that ETH will continue its upward movement by regaining the $1,632 level later in the day. However, closes below this level may weaken the technical structure and cause the price to retreat to the next support area, the kumo cloud levels. In this scenario, the upper band of the cloud should be followed as an important reference point.
Supports 1,543 – 1,458 – 1,369
Resistances 1,632 – 1,756 – 1,925
XRP/USDT
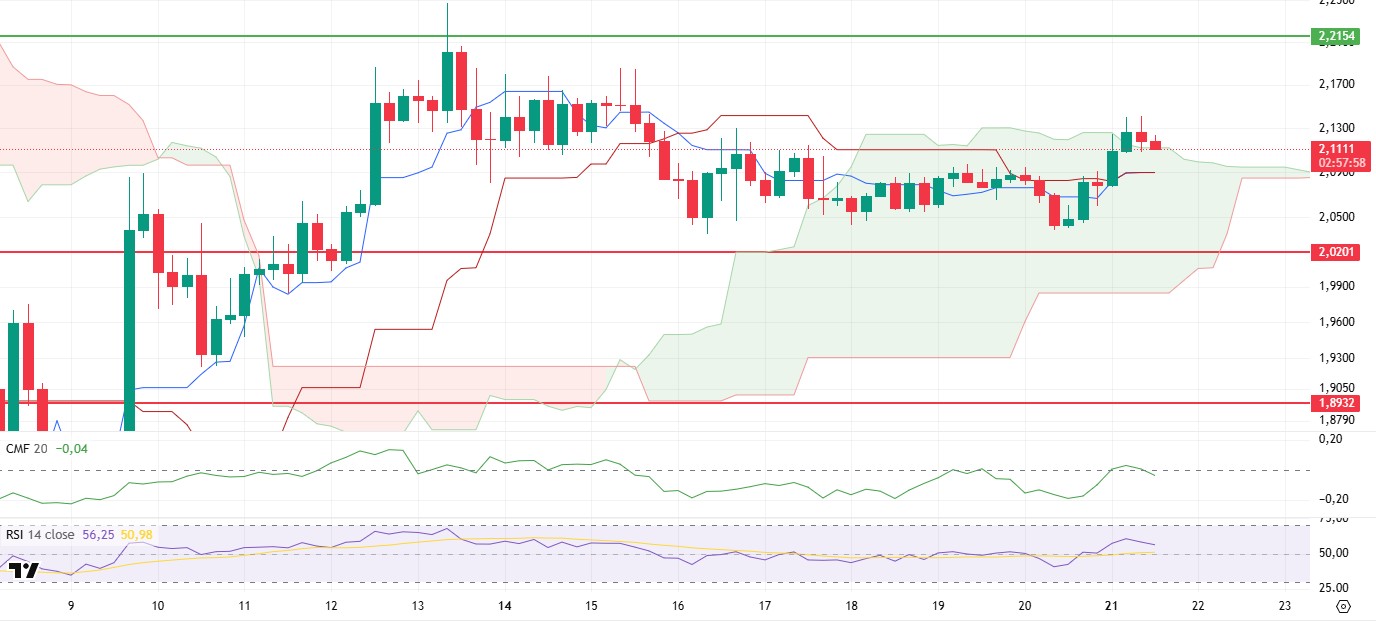
XRP managed to rise above the kumo cloud with the momentum it caught in the morning hours. While this rise stands out as a positive technical signal in the short term, with the slight pullback seen during the day, the price fell back to the border levels of the sand cloud. After this decline, the stabilization of the price in this region can be considered as a technical re-test and may form an important basis for the continuation of the upward movement. In particular, the upper band of the cloud stands out as the critical support level that will determine whether the current bullish structure will continue.
On the technical indicators side, Chaikin Money Flow (CMF) moved into positive territory in the morning hours, confirming the liquidity entering the market. However, the indicator shifted back to negative territory after the rally, suggesting that the market lost some liquidity during the day. The fact that CMF remains below the zero zone suggests that upside price action may remain under pressure. Weak liquidity flows may limit upside price reactions. In this context, it will be critical for CMF to move above zero again for a healthier uptrend. In terms of the Ichimoku indicator, the fact that the price is still above the kumo cloud indicates that the positive technical structure continues. The fact that the price did not close below the cloud suggests that short-term declines may only be a correction. This suggests that investor confidence is not completely lost and the market has not yet turned down.
Overall, XRP’s current pricing is taking place at the boundary levels of the cloud and whether this zone can be maintained will be decisive in the coming hours. If this region continues to work as support, it seems possible that the price could regain momentum and rise to the $2.21 level. On the other hand, a close below this level could confirm the weakening of the price and set the stage for a new pullback to the $2.02 band.
Supports 2.0201- 1.8932 – 1.6309
Resistances 2.2154 – 2.3938 – 2.4721
SOL/USDT
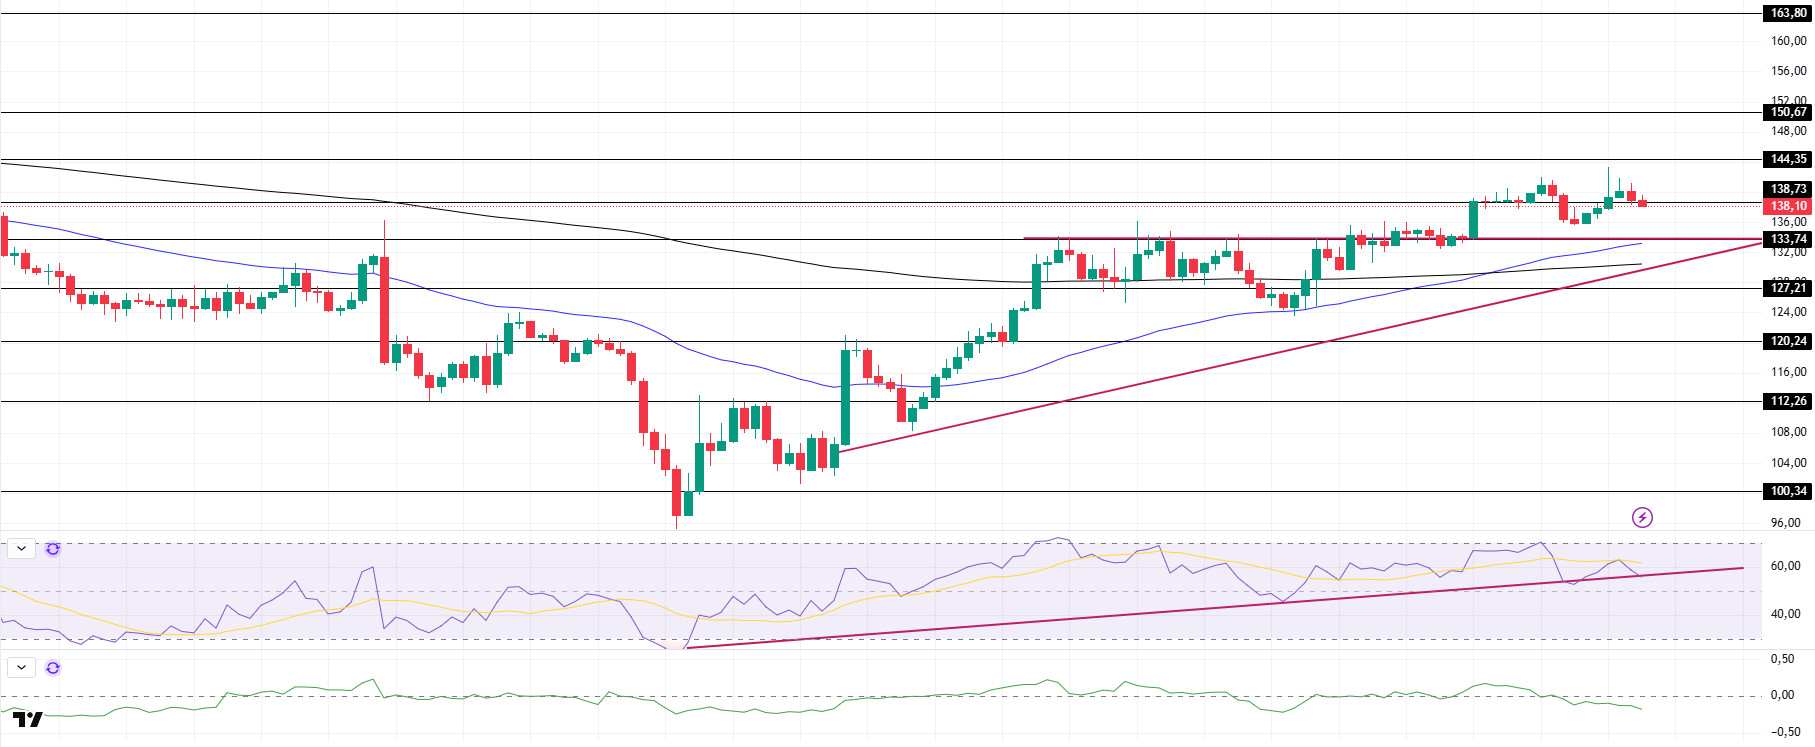
US Solana ETF has a 74% probability of approval by 2025, boosting institutional interest. Solana’s PumpSwap DEX increased its daily trading volume to $3.45 billion.
SOL moved sideways during the day. The asset broke the $133.74 level, the resistance of the ascending triangle pattern, and started to accelerate towards the $144.35 level. However, it lost momentum and retreated and is currently testing the $138.73 level as support. On the 4-hour timeframe, the 50 EMA (Blue Line) continues to hover above the 200 EMA (Black Line). This could be a bullish start in the medium term. At the same time, the price remained above the two moving averages. This suggests that there is buying pressure in the market. When we analyze the Chaikin Money Flow (CMF)20 indicator, it is at a negative level. However, positive daily volume may move CMF into positive territory. Relative Strength Index (RSI)14, on the other hand, continued its upward trend that started on April 7. It is currently testing this trend as support. If it breaks it, retracements may occur. The level of 150.67 dollars appears as a place of resistance in the rises due to the upcoming macroeconomic data and the news in the Solana ecosystem. If it breaks here, the rise may continue. In case of retracements for the opposite reasons or due to profit sales, the support level of $133.74 can be triggered. If the price comes to these support levels, a potential bullish opportunity may arise if momentum increases.
Supports 138.73 – 133.74 – 127.21
Resistances 144.35 – 150.67 – 163.80
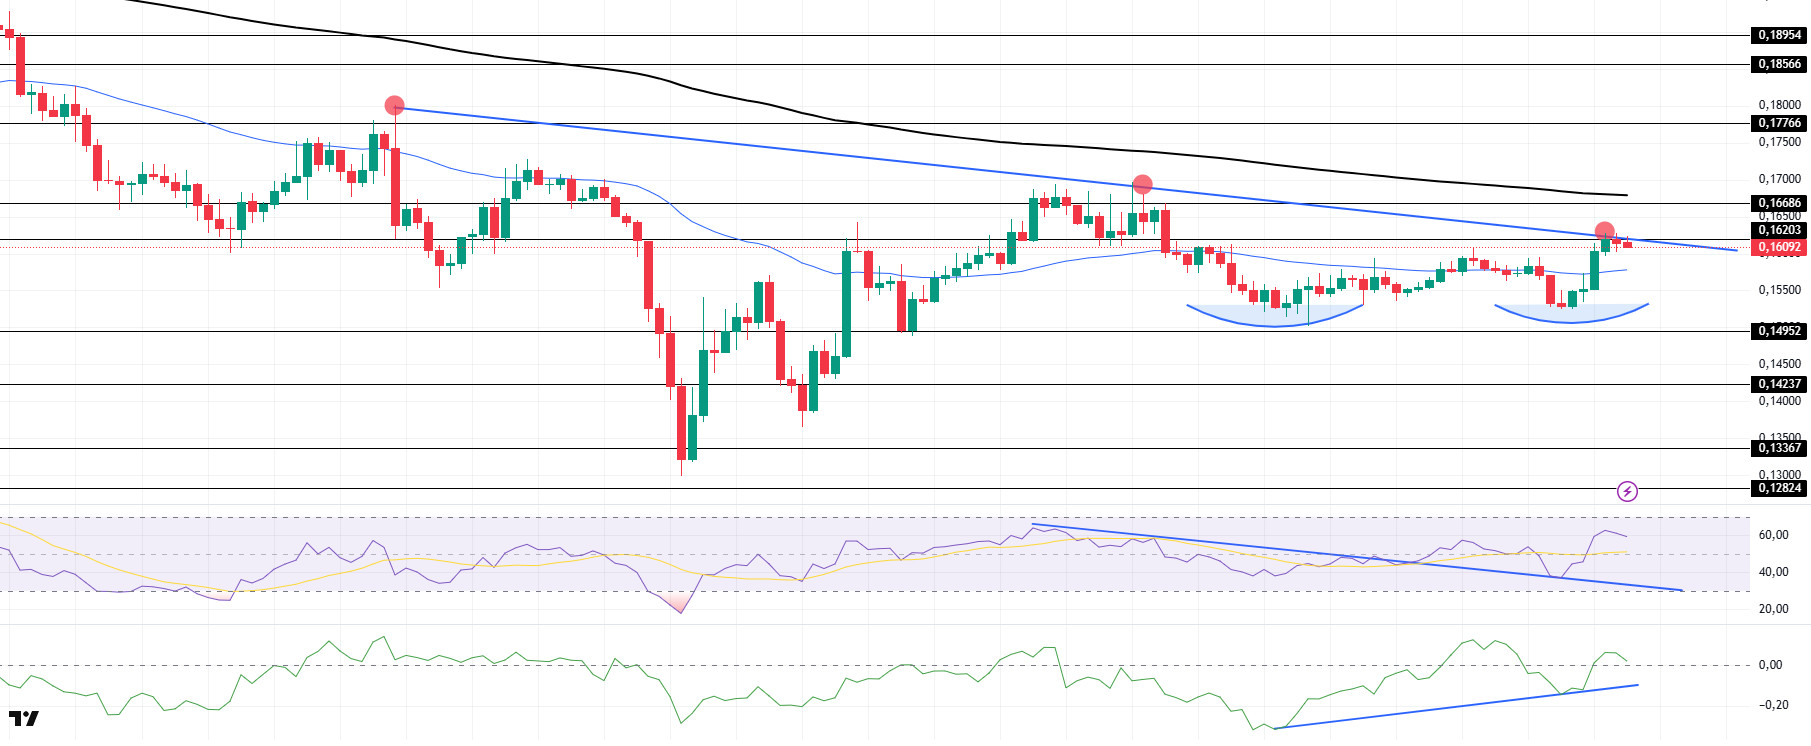
DOGE/USDT
DOGE moved sideways during the day. The asset is currently testing the downtrend that started on April 2. If it fails to break here, the $0.14952 level may test as support. If it breaks it, the 200 EMA (Black Line) may be triggered as resistance. In addition, a double bottom formation has formed. This should be taken into account. On the 4-hour timeframe, the 50 EMA (Blue Line) continues to be below the 200 EMA (Black Line). This may mean that the decline may continue in the medium term. However, the price started to price between two moving averages. This shows us that the price is in the decision phase. When we examine the Chaikin Money Flow (CMF)20 indicator, it moved into positive territory and continued the uptrend that started on April 16. In addition, the positive 24-hour volume may move CMF to higher levels. On the other hand, Relative Strength Index (RSI)14 moved into positive territory. With this move, it broke the downtrend on April 12 and tested this trend as support and experienced an uptrend . The $0.16686 level stands out as a very strong resistance point in the rises due to political reasons, macroeconomic data and innovations in the DOGE coin. In case of possible retracements due to political, macroeconomic reasons or negativities in the ecosystem, the $ 0.14952 level, which is a strong support place, is an important support place. If the price comes to these support levels, a potential bullish opportunity may arise if momentum increases.
Supports 0.14952 – 014237 – 0.13367
Resistances 0.16203 – 0.16686 – 0.17766
Legal Notice
The investment information, comments and recommendations contained herein do not constitute investment advice. Investment advisory services are provided individually by authorized institutions taking into account the risk and return preferences of individuals. The comments and recommendations contained herein are of a general nature. These recommendations may not be suitable for your financial situation and risk and return preferences. Therefore, making an investment decision based solely on the information contained herein may not produce results in line with your expectations.
