
TECHNICAL ANALYSIS
BTC/USDT
As the tension between Trump and Powell increased, Trump reiterated his call for an interest rate cut for the Fed, saying “inflation is almost non-existent”. Arguing that high interest rates could suppress economic growth, he criticized Fed Chairman Jerome Powell once again. The other development of yesterday was a strong net inflow of 381 million dollars into Bitcoin spot ETFs. While this development indicates that the interest of institutional investors has regained, there is also an important development on the SEC side. Paul Atkins, known for his crypto-friendly statements, is expected to be sworn in as SEC Chairman today.
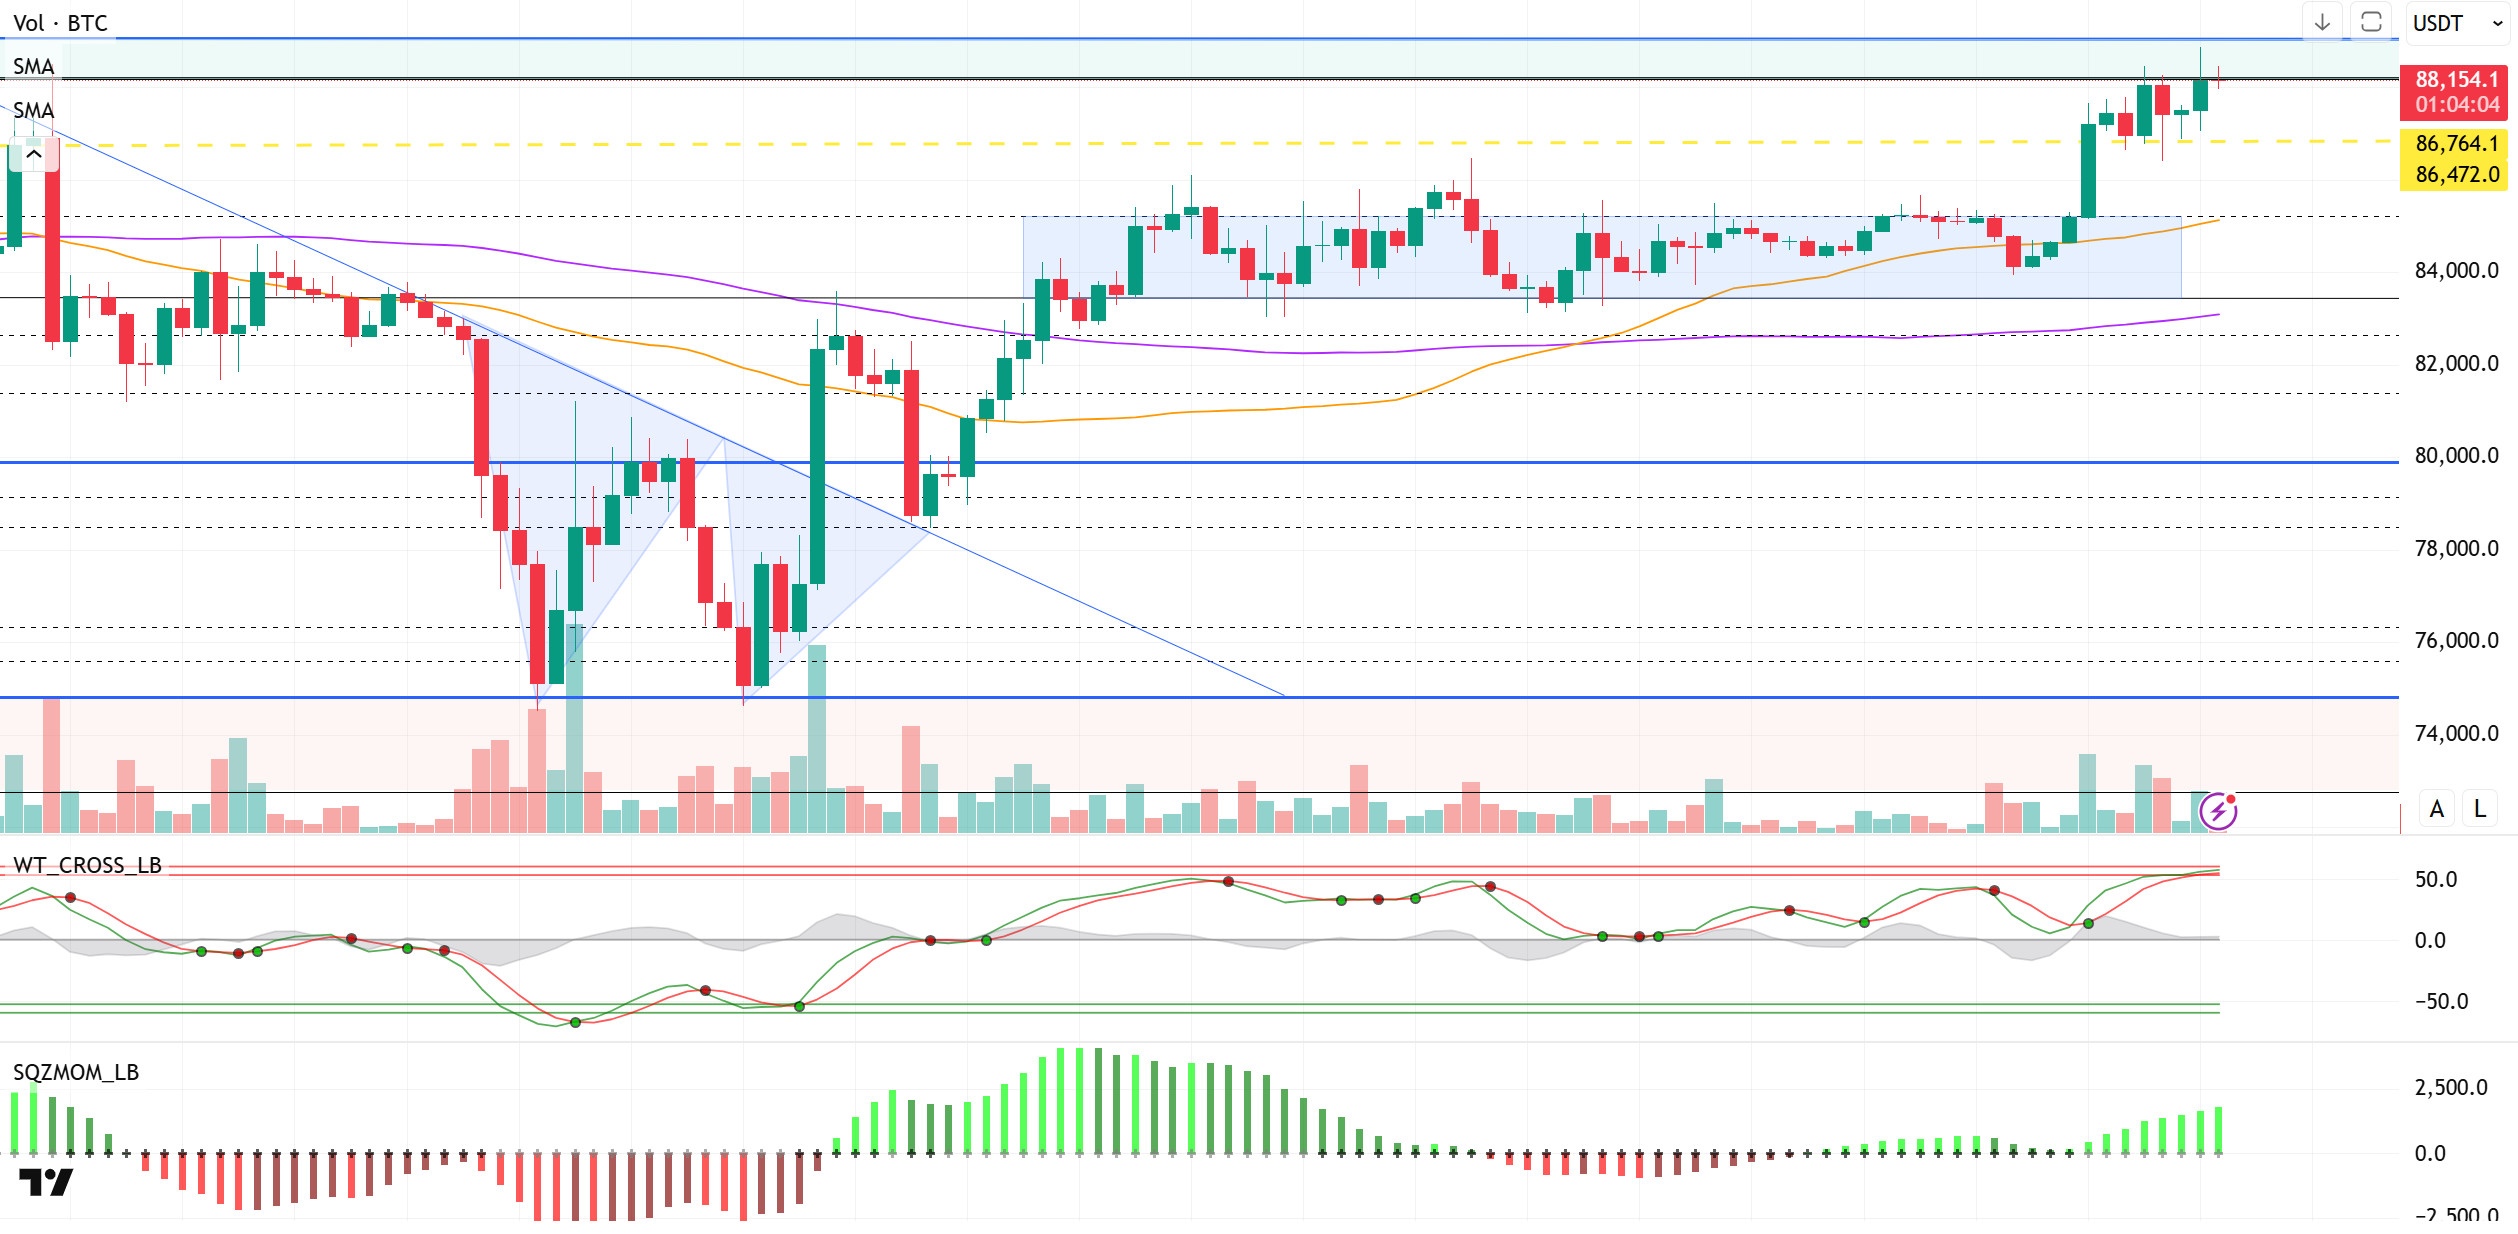
Looking at the technical outlook, the scenario we highlighted in the previous analysis that the 88,000-89,000 band is a strong resistance zone worked. After BTC touched this zone, it faced selling pressure and made a short-lived pullback to 86,300. During this move, the Wave Trend Oscillator generated a sell signal. However, later in the day, it was observed that the indicator started to give a buy signal again. The liquidation of long positions concentrated at the 86,400 level during this decline shows that the price has started to move in line with its technical dynamics again. BTC, which recovered after the liquidations, started trading in the 88,000 band, once again accumulating above 86,600 support. Hourly closes in this region can be considered as a positive technical parameter for the market, but it should be noted that technical oscillators are approaching the overbought zone and the buy signal is starting to weaken. This points to a period in which the rise may be limited and profit sales may be on the agenda. On the other hand, momentum indicators continue to gain strength, indicating that market sentiment has recovered with the increase in risk appetite and the revival of ETF inflows. Accordingly, it can be said that technical indicators have reached saturation point and there is limited room for upside in the short term. However, in case of a new upward move with increasing risk appetite and fundamental supportive developments, the 90,000 band may be on the agenda for the first time since March 8. On the other hand, a short-term technical correction is also on the table. In this scenario, the price could be expected to pull back towards 86,600 support.
Supports 86,600 – 85,200 – 83,500
Resistances 88,100 – 89.000 – 91,800
ETH/USDT
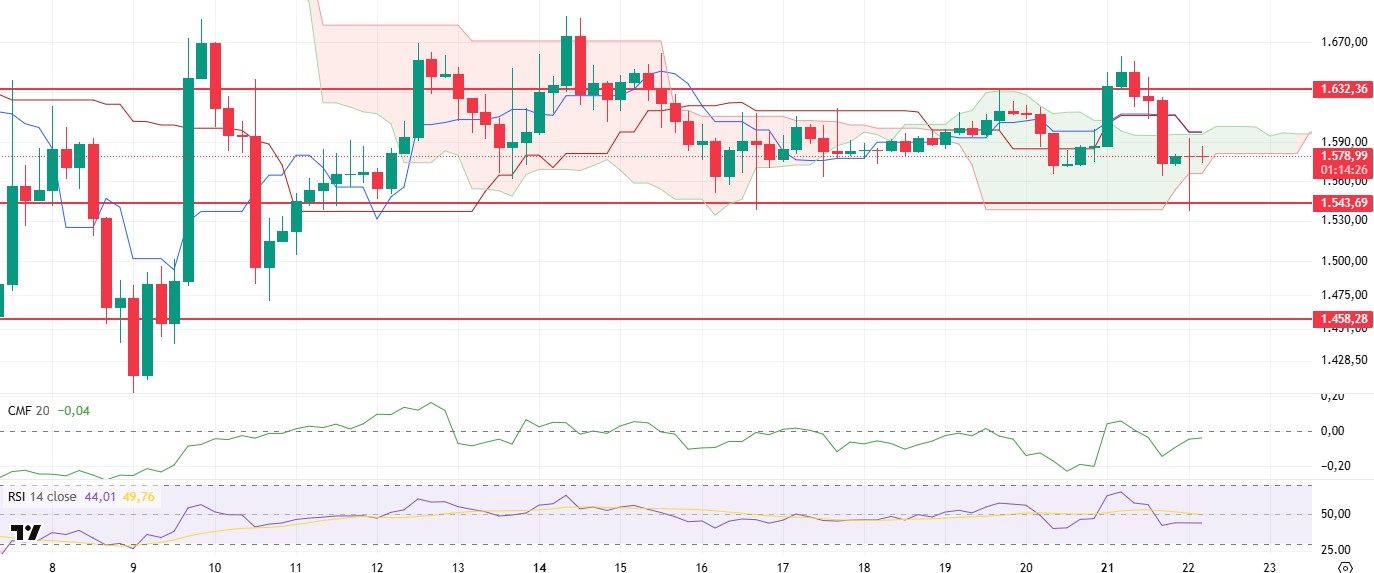
ETH retested the $1,632 level yesterday evening but failed to break through it permanently and faced selling pressure. This pullback resulted in the loss of the upper band of the kumo cloud and the tenkan and kijun levels, which are important support elements in the price’s ichimoku indicator. With the break of the support levels, the decline accelerated and the price fell as low as $1,543 support in the morning hours. However, buying from this level allowed the market to make a short-term reaction and ETH was able to re-enter the kumo cloud.
In terms of technical indicators, the Chaikin Money Flow (CMF) indicator retreated into negative territory during the downtrend. However, reaction buying in the morning hours caused CMF to move upwards again. Although CMF is still in negative territory, if it transitions to positive territory during the day, this may indicate that an upward momentum may continue in the market. On the other hand, the Relative Strength Index (RSI) indicator also fell below 50 amid selling pressure and formed a double bottom pattern at 41. While the RSI maintaining the 41 level indicates a technical bottoming process, it suggests that the price may try to take a position on the kumo cloud again with this support. On the Ichimoku indicator, although the price has broken the tenkan level downwards, it is still pricing within the boundaries of the kumo cloud. In addition, the fact that the tenkan and kijun levels are close to each other and have not yet shown a clear divergence indicates that there is no clear sell signal in the market. However, if the price sags below the kumo cloud again, this may be considered as a sell signal in technical analysis.
As of the general outlook, it can be predicted that if the price manages to stay within the limits of the kumo cloud during the day, it may follow a slightly positive and horizontal course. On the other hand, a breach below the kumo cloud may cause selling pressure to increase again and cause the price to retreat back to the $1.543 support.
Top of Form
Below the Form
Supports 1,543 – 1,458 – 1,369
Resistances 1,632 – 1,756 – 1,925
XRP/USDT
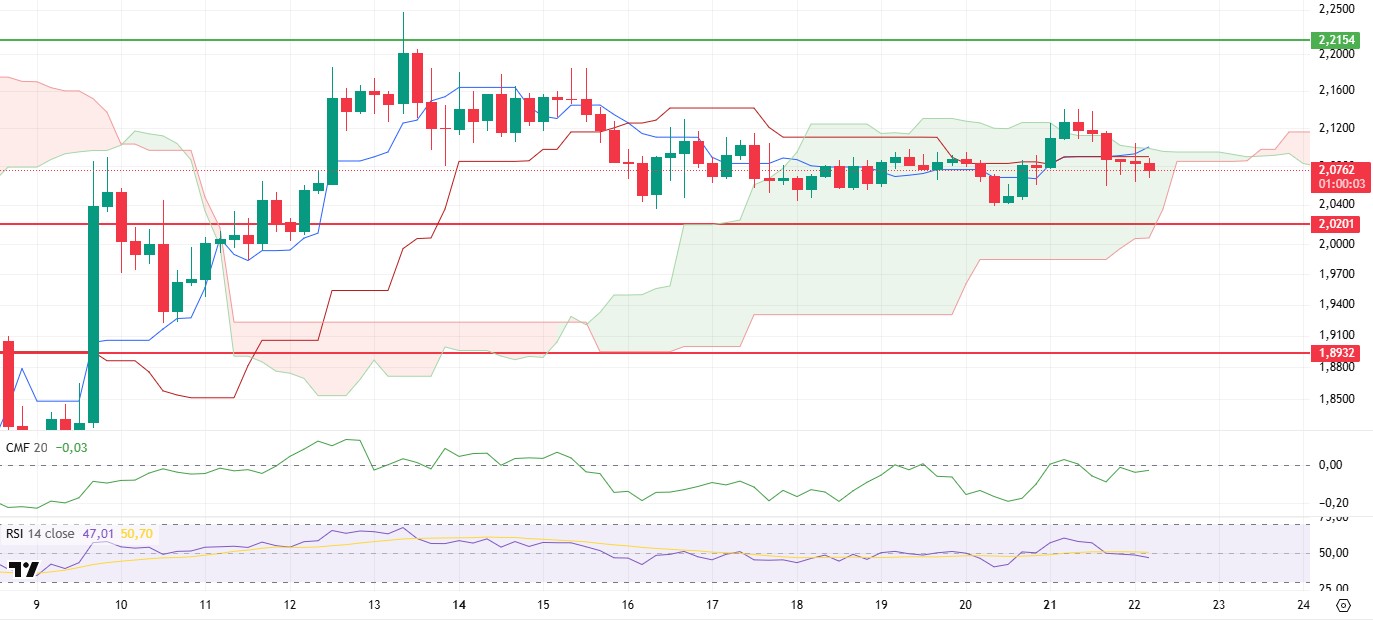
After breaking through the upper band of the kumo cloud yesterday, XRP retreated back into the cloud, affected by the general weakness in the cryptocurrency market. During this retreat, not only did it fail to break out of the kumo cloud, but also the tenkan and kijun levels were broken downwards. The selling pressure from the upper band of the kumo cloud, especially since yesterday evening, caused the price to open lower in the first hours of the day and strengthened the signals of short-term weakness in the market.
Analyzing the technical indicators, the downward movement of the Chaikin Money Flow (CMF) indicator, which rejected the zero level, reveals that the selling pressure in the market is still strong. The fact that CMF continues to deepen in the negative area indicates that the downward pressure on the price may continue for a while. The Relative Strength Index (RSI) indicator also confirms the weakness in the price action. The fact that the RSI lost its momentum by breaking below the based MA line suggests that buyers are weakening and selling continues to have an impact on the price. In the context of the Ichimoku indicator, although the tenkan line crossing the kijun line upwards is considered a positive technical development, this positive signal is overshadowed by the fact that the price is still in the kumo cloud. While the price movements in the cloud increase the uncertainty of direction, the market’s inability to determine a clear direction suggests that caution should be exercised in short-term transactions.
In general, the technical outlook indicates that selling pressure may continue in the short term due to weaknesses in indicators and the unstable movement of the price in the cloud. The $2.02 level stands out as a critical support in this process. A downward break of this level may cause selling pressure to increase significantly and the price to retreat sharply. On the other hand, if the price breaks the kumo cloud boundaries upwards again, a new upward movement that could last up to $2.21 levels seems technically possible with the surpassing of this resistance zone.
Supports 2.0201- 1.8932 – 1.6309
Resistances 2.2154 – 2.3938 – 2.4721
SOL/USDT
GSR to help consumer products firm Upexi build SOL treasury with $100 million private investment. Galaxy Digital attracted $95 million in SOL from exchanges. Astra Fintech committed $100 million for Solana’s expansion in Asia.
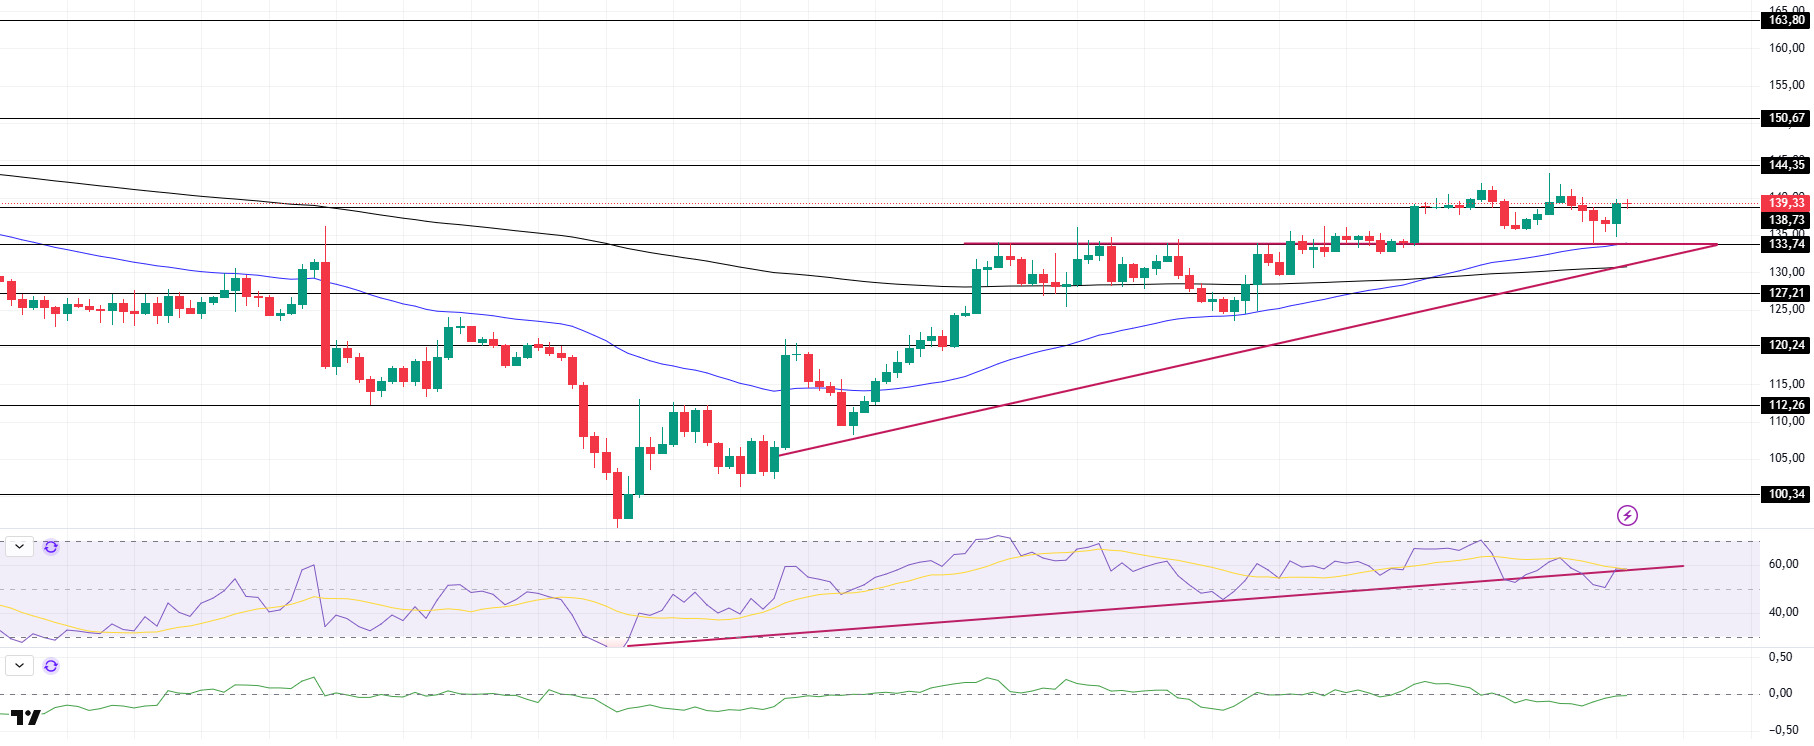
SOL continued to move in a narrow band. The asset regained momentum and rallied from the resistance of the ascending triangle pattern at $133.74. It is currently testing the strong support at $138.73. On the 4-hour timeframe, the 50 EMA (Blue Line) continues to hover above the 200 EMA (Black Line). This could be a bullish start in the medium term. At the same time, the price continued to be above the two moving averages. This suggests that there is buying pressure in the market. When we analyze the Chaikin Money Flow (CMF)20 indicator, it is at a negative level. However, positive daily volume may move CMF into positive territory. Relative Strength Index (RSI)14 broke the downward uptrend that started on April 7. This may cause pullbacks. The $150.67 level appears as a resistance point in the rises driven by the upcoming macroeconomic data and the news in the Solana ecosystem. If it breaks here, the rise may continue. In case of retracements for the opposite reasons or due to profit sales, the support level of $133.74 can be triggered. If the price comes to these support levels, a potential bullish opportunity may arise if momentum increases.
Supports 138.73 – 133.74 – 127.21
Resistances 144.35 – 150.67 – 163.80
DOGE/USDT
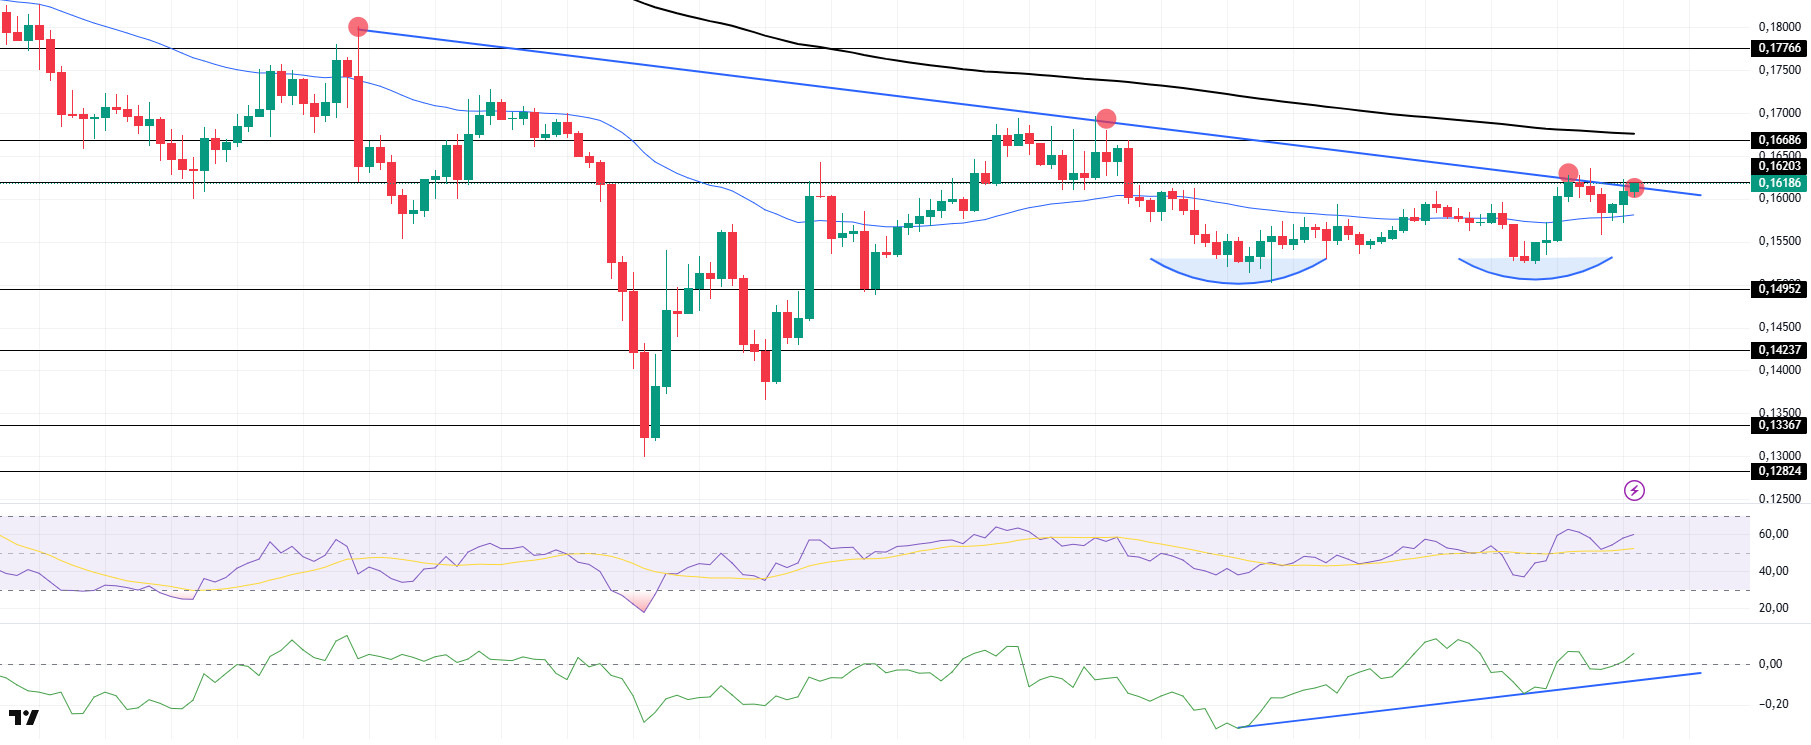
DOGE continued its sideways movement. The asset tested the downtrend that started on April 2 for the first time but failed to break it. Supported by the 50 EMA (Blue Line), the price is again testing the downtrend as resistance. If it fails to break here, the $0.14952 level may test as support. If it breaks it, the 200 EMA (Black Line) may be triggered as resistance. In addition, a double bottom formation has formed. This should be taken into account. On the 4-hour timeframe, the 50 EMA (Blue Line) continues to be below the 200 EMA (Black Line). This may mean that the decline may continue in the medium term. However, the price started to price between two moving averages. This shows us that the price is in the decision phase. When we examine the Chaikin Money Flow (CMF)20 indicator, it moved into positive territory and continued the uptrend that started on April 16. In addition, the positive 24-hour volume may move CMF to higher levels. On the other hand, Relative Strength Index (RSI)14 continued to be in positive territory. The $0.16686 level stands out as a very strong resistance point in the rises due to political reasons, macroeconomic data and innovations in the DOGE coin. In case of possible retracements due to political, macroeconomic reasons or negativities in the ecosystem, the $0.14952 level, which is a strong support place, is an important support place. If the price reaches these support levels, a potential bullish opportunity may arise if momentum increases.
Supports 0.14952 – 014237 – 0.13367
Resistances 0.16203 – 0.16686 – 0.17766
Legal Notice
The investment information, comments and recommendations contained herein do not constitute investment advice. Investment advisory services are provided individually by authorized institutions taking into account the risk and return preferences of individuals. The comments and recommendations contained herein are of a general nature. These recommendations may not be suitable for your financial situation and risk and return preferences. Therefore, making an investment decision based solely on the information contained herein may not produce results in line with your expectations.
