
TECHNICAL ANALYSIS
BTC/USDT
US President D.Trump stated that he does not plan to dismiss Fed Chairman J.Powell and reiterated that interest rates should be lowered. Trump signaled that tariffs imposed on China could be reduced and emphasized that he is open to lowering the tone of trade wars. New SEC Chairman Paul Atkins said in his first statement that a clear regulatory framework for digital assets is among his priorities. These statements were interpreted as a positive signal for Bitcoin by names such as MicroStrategy founder Michael Saylor. On the other hand, according to Bloomberg, details of Trump’s strategic Bitcoin reserve plan are expected to be announced in the next two weeks. On the market front, there was a total net inflow of $936 million into Bitcoin spot ETFs on April 22. This led to a significant rise in the fear and greed index and helped the market reach the greed level.
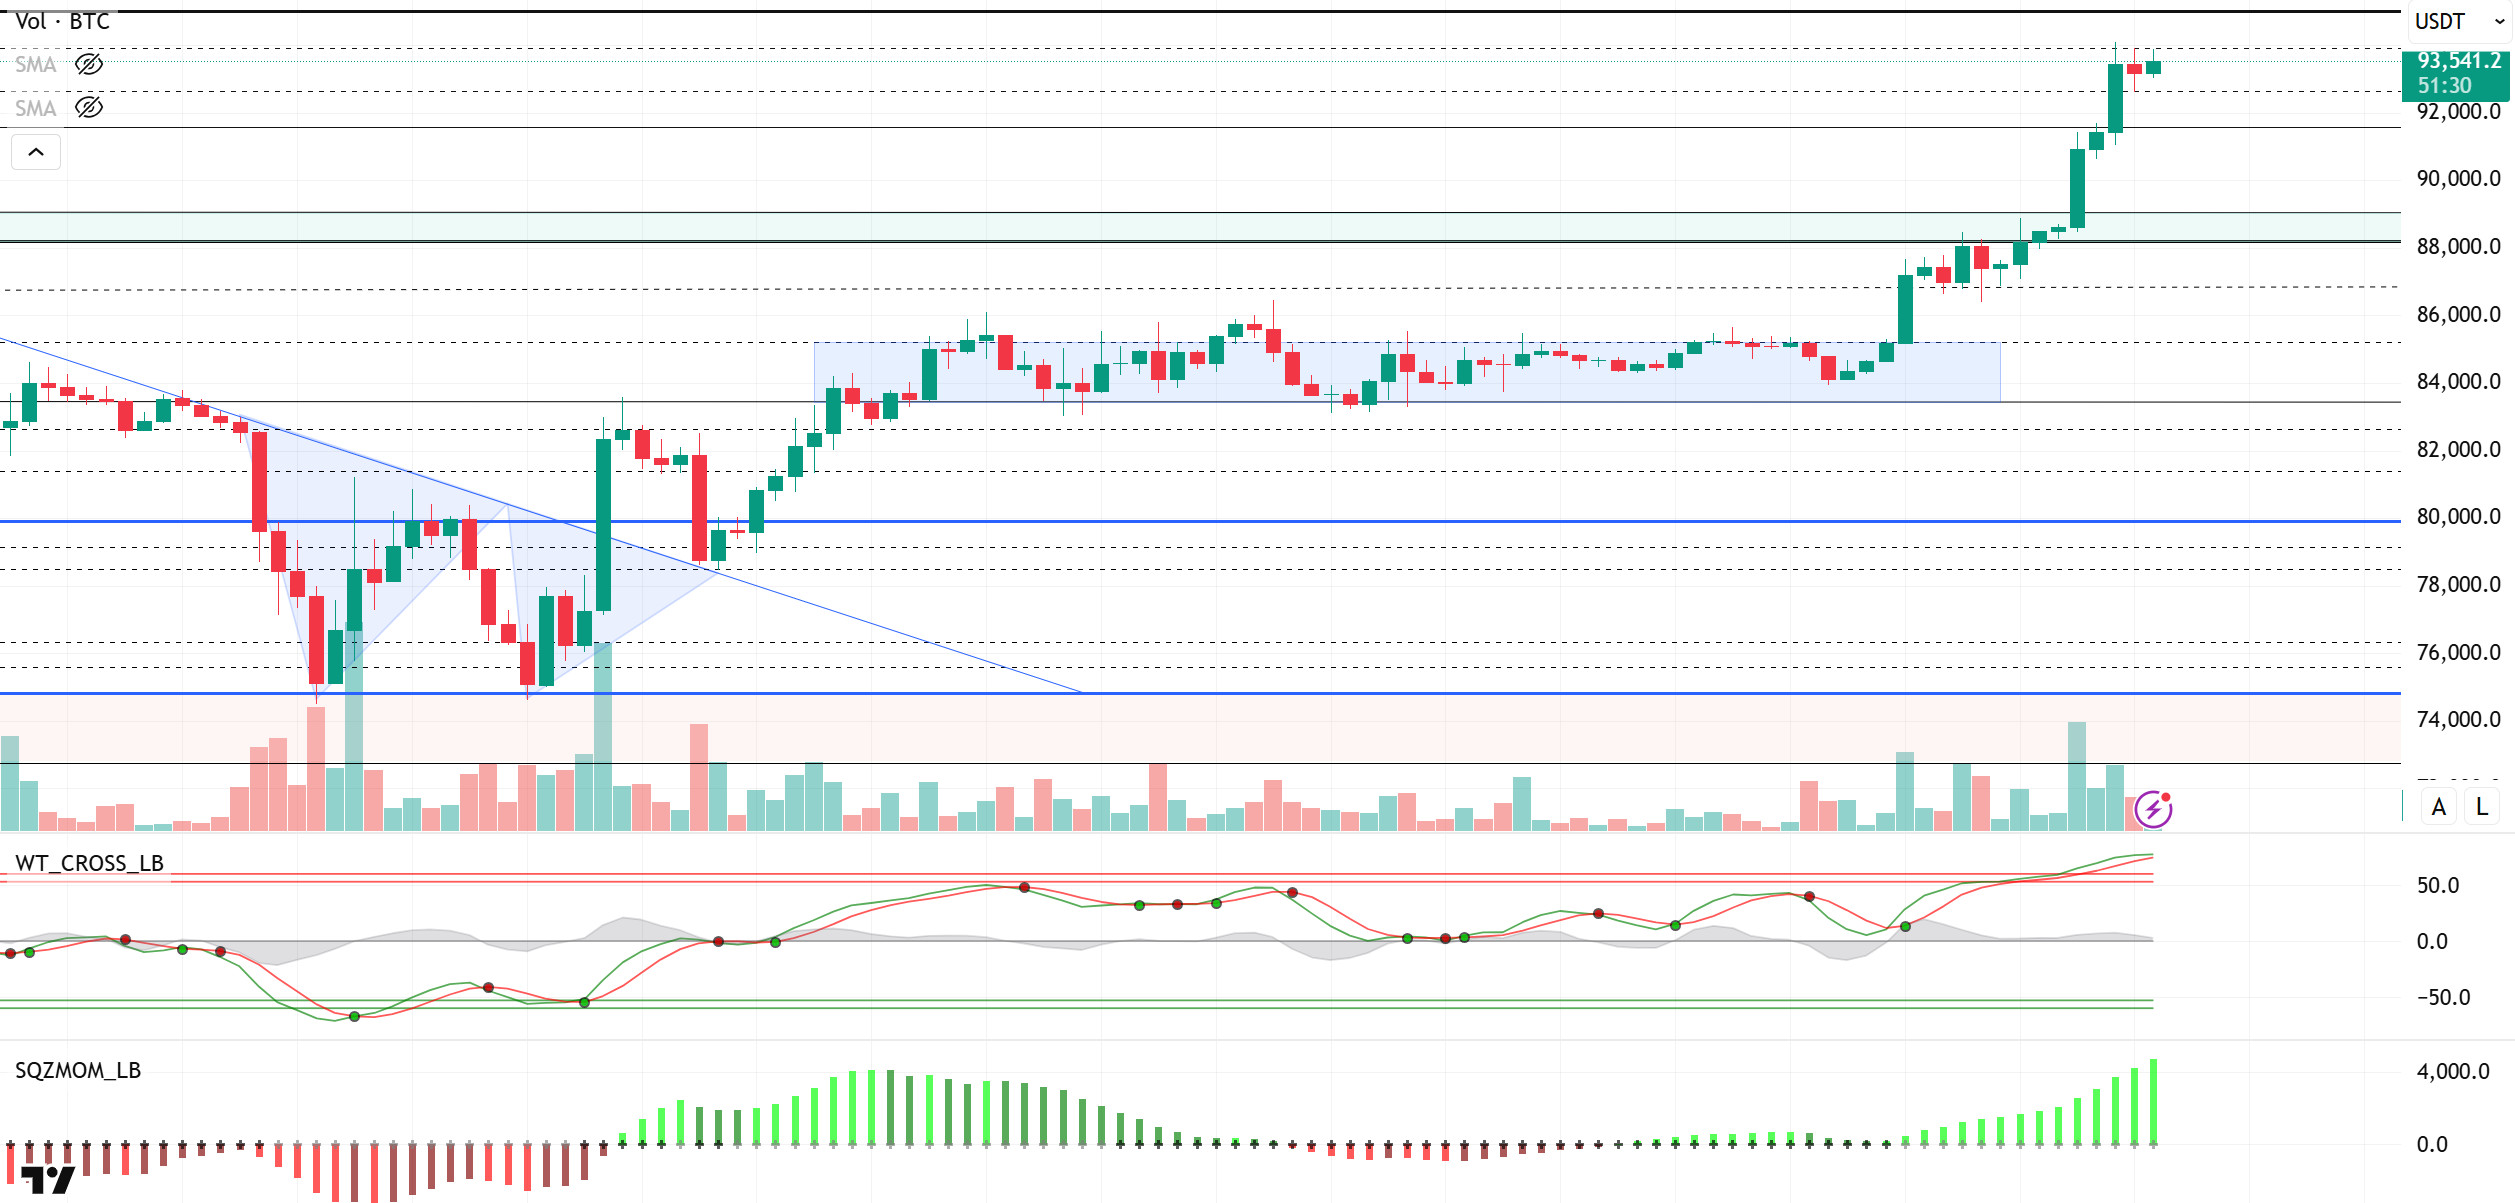
Looking at the technical outlook, as we highlighted in the previous analysis, BTC technically had room to test the 91,800 level. Indeed, BTC, which accumulated around this level, rose sharply after Trump’s optimistic statements and tested the seven-week high of $ 94,000. At the time of writing, BTC is trading at $93,700, holding on to all of its gains. Looking at the technical indicators, the Wave Trend Oscillator has moved above the overbought zone, suggesting a short-term saturation and possible correction. However, the momentum indicator has maintained its positive momentum, indicating that the market still has a high risk appetite. Although technical indicators point to the need for a correction, strong fundamentals outweigh these technical signals and continue to be the driving force behind the price. The improvement in market sentiment, especially with Trump’s statements, continues to support BTC’s rise. With this rise, it can be said that BTC has opened the door to new highs in the market. In this process, the 95,000 level remains the reference point, which has been tested many times before and is a critical threshold for the price. If this level is exceeded, psychological expectations for the 100,000 level may be revived. On the other hand, in case of a possible technical correction, the 92,800 level will be followed as the first strong support. If it sags below this level, rebalancing can be seen in the 91,800-90,400 band.
Supports 92,700 – 91,800 – 90,400
Resistances: 94,000 – 95,000 – 97,000
ETH/USDT
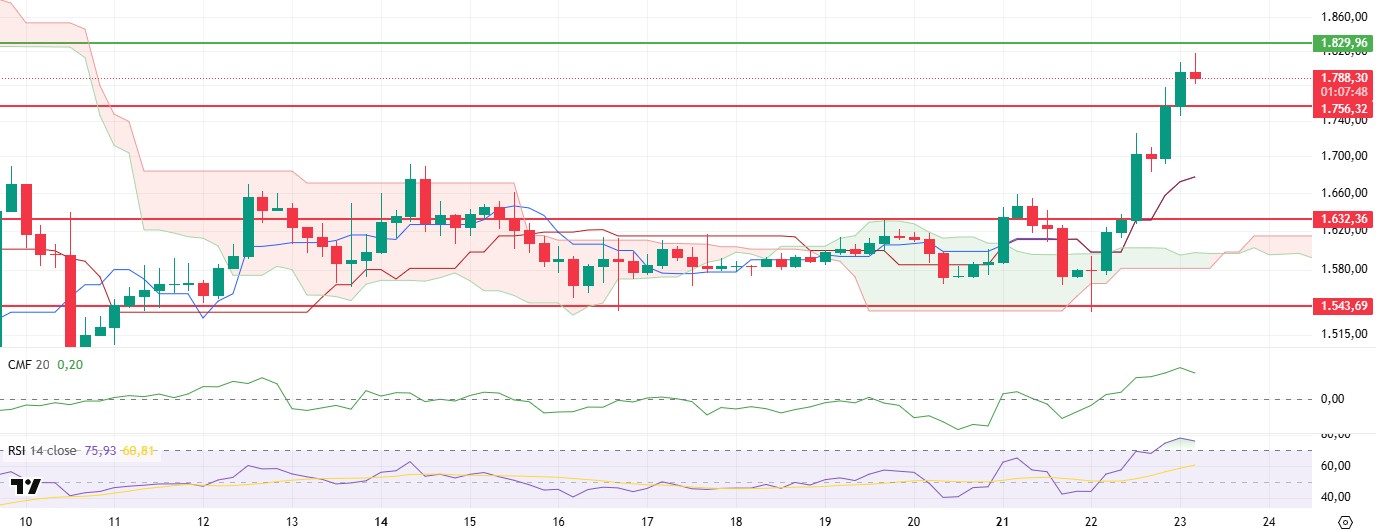
ETH made a strong exit from the consolidation zone where it has been stuck for a long time by gaining the $ 1,632 level yesterday evening and rose as high as $1,756 as predicted. While this resistance zone was also broken upwards with the effect of momentum, the price’s effort to hold the $1,800 band is noteworthy. This movement indicates that the short-term technical structure is gaining strength and market participants’ appetite for buying is high.
Analyzing the technical indicators, Chaikin Money Flow (CMF) indicator remained in positive territory and maintained its upward trend. This indicates that the buying pressure in the spot market is strengthening and the current uptrend is taking place on a solid liquidity backdrop. On the Ichimoku indicator, the thinning of the kumo cloud and the strong settlement of the price above the cloud support that the current trend is upward and the short-term price structure is not deteriorating. On the other hand, although the Relative Strength Index (RSI) continues to be structurally in positive territory, it is noteworthy that it is in overbought territory. This increases the likelihood that the price may face a correction in the short term. Especially if it fails to persist above the $1,800 level, a retracement to the $1,756 level can be observed in the first place. This level stands out as an important support both technically and psychologically. With the support to be taken from here, the price can be expected to regain an upward momentum and continue the trend. However, a close below the $1,756 level could deepen the correction and risk a pullback towards the $1,700 level.
In summary, although technical indicators show that the uptrend continues on a healthy and buying ground, the RSI is in the overbought zone, raising the risk of a short-term correction. In this scenario, the $1,756 level is critical both as an intermediate support and in terms of determining the possible direction. In the upside scenario, exceeding the $1,829 level could accelerate the price and bring about sharper and more voluminous rises.
Top of Form
Below the Form
Supports 1,756 – 1,632 – 1,543
Resistances 1,829 – 1,925 – 2,131
XRP/USDT
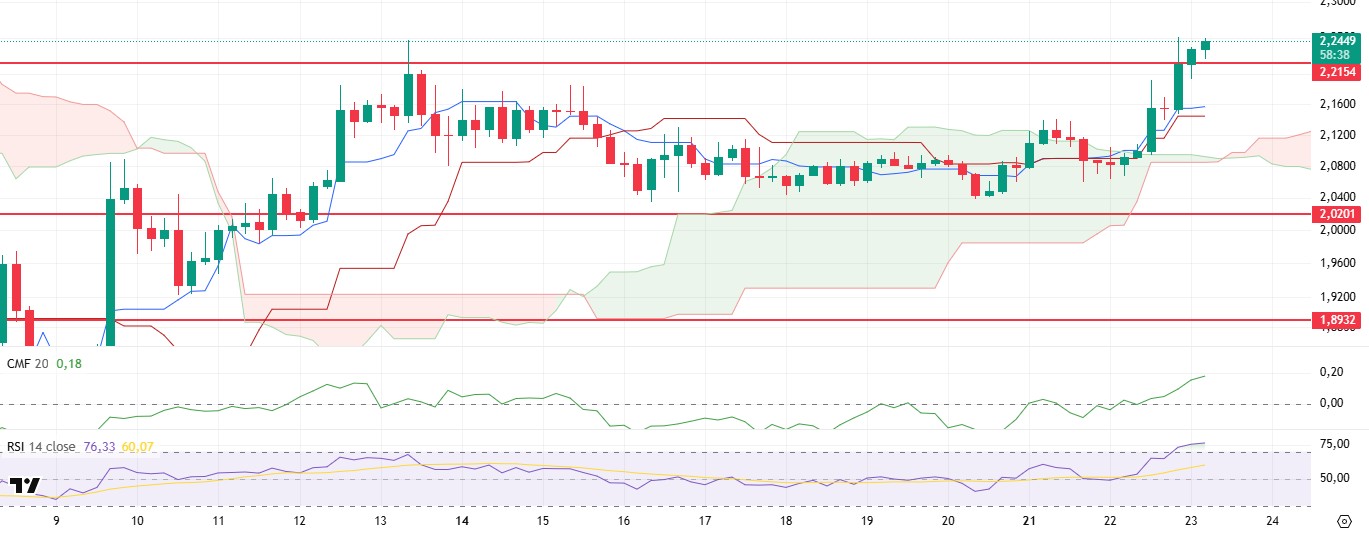
XRP left behind an important resistance level by breaking the $2.21 level, which it had been testing for a long time but struggled to break through yesterday evening. While this break is considered as a very critical threshold in technical terms, the price’s persistence above this level paves the way for the bullish scenario to strengthen. As of now, the price action is stabilized above this level and the positive outlook in technical indicators supports this situation.
The Chaikin Money Flow (CMF) indicator made a sharp breakout to the upside as of yesterday, after having been flat around the zero line for a long time. This move indicates that the buying volume in the spot market has increased significantly and liquidity inflows to the market have accelerated. CMF’s continued uptrend in positive territory suggests that the uptrend has a strong foundation not only technically but also in terms of market dynamics and may continue. Such a move is important as it indicates that investor confidence is on the rise and buyers are positioning more aggressively. The Relative Strength Index (RSI) indicator has started to follow a horizontal trend after entering the overbought zone. This structure suggests that the price tends to take a breather for a while but still has upside potential. Although the stabilization of the RSI in this region postpones the risk of a possible correction to some extent, it also reveals that volumetric support is required for the upward momentum to continue.
As a result, if XRP continues to stay above the $2.21 level, the bullish trend can be expected to continue during the day. This level stands out as both a technical support and a psychological threshold. However, a close below this level could signal short-term weakness and pull the price back to the kijun support at $2.14. Such a correction can be considered healthy in terms of rebalancing the technical structure; however, persistence below the $2.14 level may lead to a deepening of the bearish scenario.
Supports 2.2154- 2.0201 – 1.8932
Resistances 2.3938 – 2.4721 – 2.8347
SOL/USDT
Janover bought another $11.5 million in SOL. The Nasdaq-listed company has over $36 million in SOL since adopting a Solana treasury strategy earlier this month. Canadian SOL ETFs experienced inflows of 120 million Canadian dollars in first-week trading. Solayer introduces crypto card for chain payments.
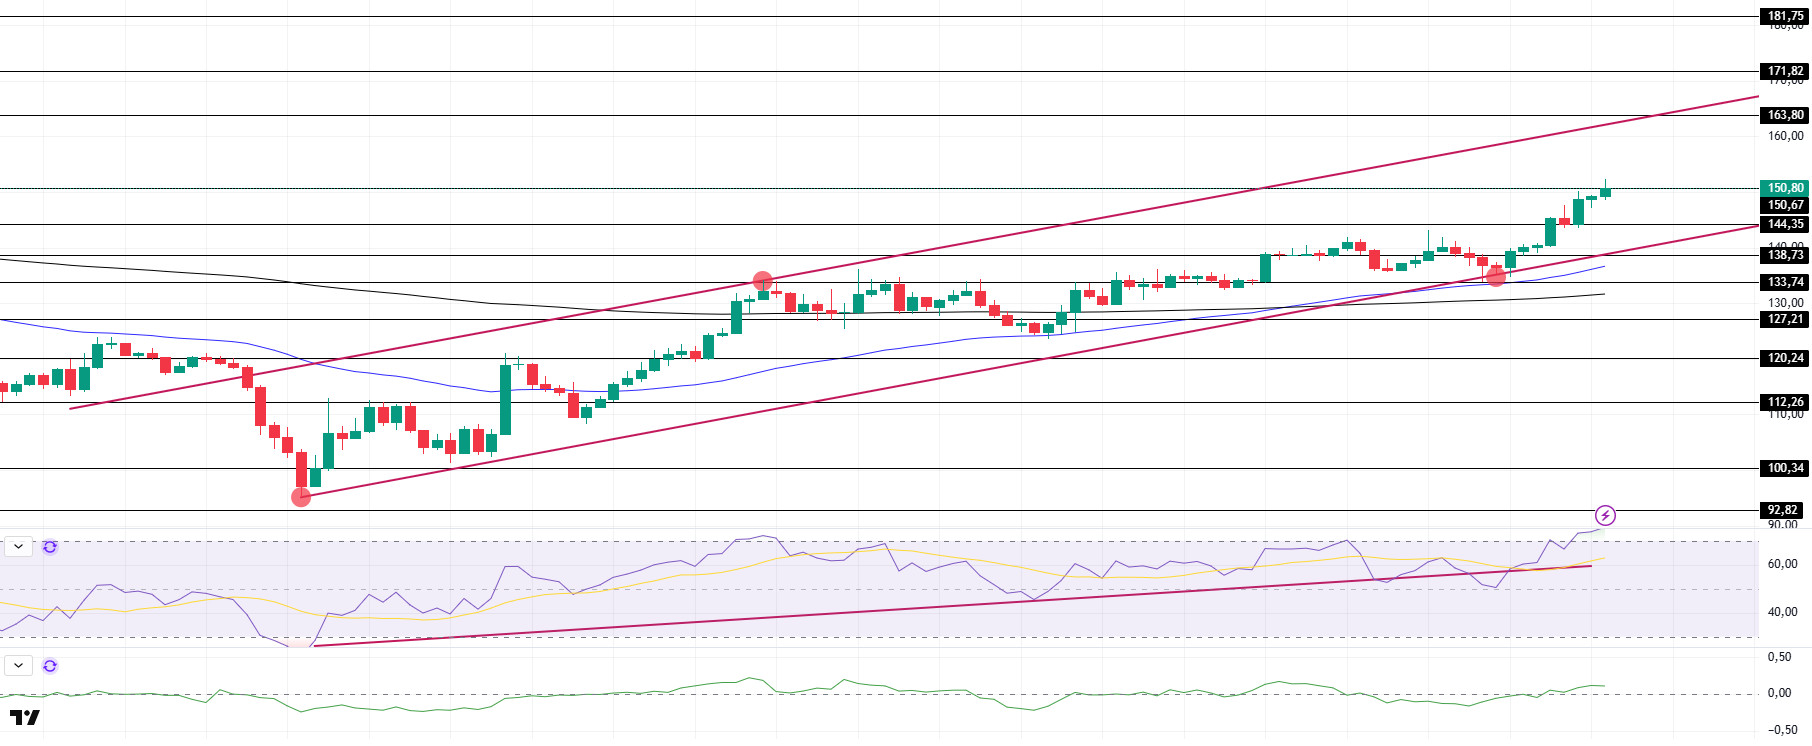
SOL has been bullish, keeping pace with the crypto market. The asset gained nearly 13%, gaining momentum from the bottom of the uptrend that started on April 7 and the 50 EMA (Blue Line) and is currently testing the strong support at $150.67 as resistance. On the 4-hour timeframe, the 50 EMA (Blue Line) continues to hover above the 200 EMA (Black Line). This could be a bullish start in the medium term. At the same time, the price remained above the two moving averages. This indicates that there is buying pressure in the market. When we examine the Chaikin Money Flow (CMF)20 indicator, it moved into the positive zone. The positive daily volume may move CMF to the upper levels of the positive area. Relative Strength Index (RSI)14 continues to be above the uptrend that started on April 7. At the same time, being in the overbought zone may bring profit sales. The level of 163.80 dollars appears as a place of resistance in the rises driven by the coming macroeconomic data and the news in the Solana ecosystem. If it breaks here, the rise may continue. If there are pullbacks for the opposite reasons or due to profit sales, the support level of 138.73 dollars may be triggered. If the price hits these support levels, a potential bullish opportunity may arise if momentum increases.
Supports 144.35 – 138.73 – 133.74
Resistances 150.67 – 163.80 – 171.82
DOGE/USDT
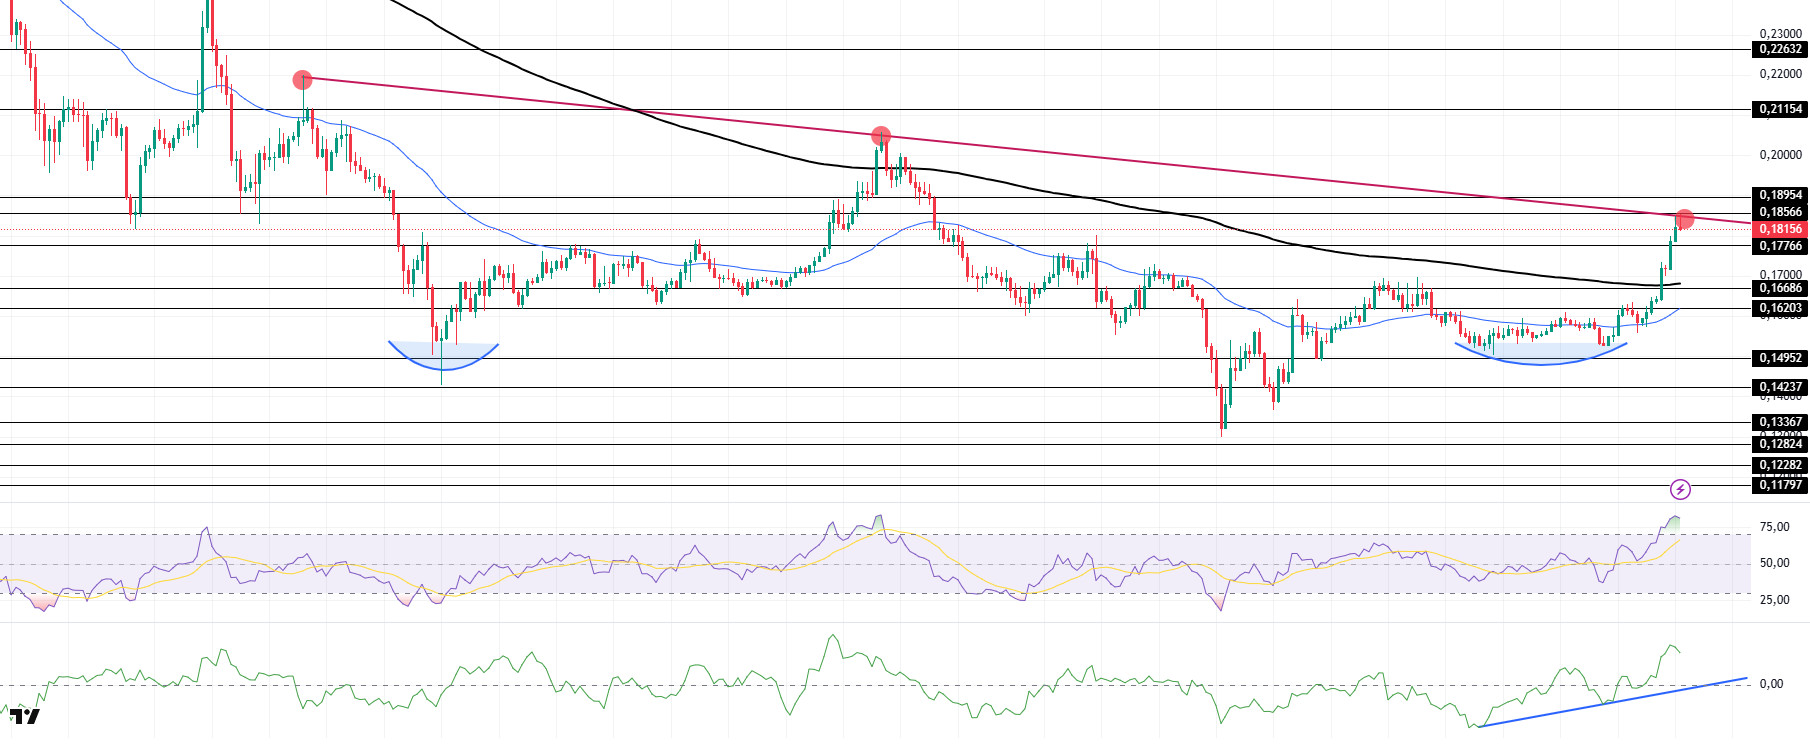
DOGE has kept pace with the crypto market, rallying nearly 12%. The asset is testing the downtrend that started on March 6 and the strong resistance at $0.18566. If it breaks here, the $0.18954 level may be triggered. The double bottom formation worked. On the 4-hour timeframe, the 50 EMA (Blue Line) continues to be below the 200 EMA (Black Line). This could mean that the decline could continue in the medium term. However, the price started to price above two moving averages. This indicates that buying pressure is building. When we examine the Chaikin Money Flow (CMF)20 indicator, it continued to rise in the positive zone and continued the uptrend that started on April 16. In addition, the positive 24-hour volume may push CMF to higher levels. On the other hand, the Relative Strength Index (RSI)14 continued to be in the positive zone, but its presence in the overbought zone may bring profit sales. The $0.21154 level is a very strong resistance point in the uptrend due to political reasons, macroeconomic data and innovations in the DOGE coin. In case of possible retracements due to political, macroeconomic reasons or negativities in the ecosystem, the $ 0.17766 level, which is a strong support place, is an important support place. If the price hits these support levels, a potential bullish opportunity may arise if momentum increases.
Supports 0.17766 – 0.16686 – 0.16203
Resistances 0.18566 – 0.18954 – 0.21154
Legal Notice
”
The investment information, comments and recommendations contained herein do not constitute investment advice. Investment advisory services are provided individually by authorized institutions taking into account the risk and return preferences of individuals. The comments and recommendations contained herein are of a general nature. These recommendations may not be suitable for your financial situation and risk and return preferences. Therefore, making an investment decision based solely on the information contained herein may not produce results in line with your expectations.
