
BTC/USDT
Bitcoin and crypto markets have gained positive momentum in recent days, with both increased institutional interest and news flow on the global economy front. Developments such as US President Trump’s decision to suspend tariffs for 90 days and the expected establishment of a strategic Bitcoin reserve in the US continue to strengthen Bitcoin’s role as a long-term store of value. Accordingly, institutional investor interest has increased significantly. MicroStrategy’s subsidiary Strategy’s new purchase of 6,556 BTC and Japan’s Metaplanet’s increase of Bitcoin assets to over 5,000 BTC reveal that the number of companies adopting crypto as a reserve asset is rapidly increasing. Bitcoin ETF data was another important development that marked the week with a weekly inflow of more than 3 billion dollars. This week, US growth data, unemployment claims, PCE data and non-farm payrolls data will be in the spotlight ahead of the FED May interest rate decision.
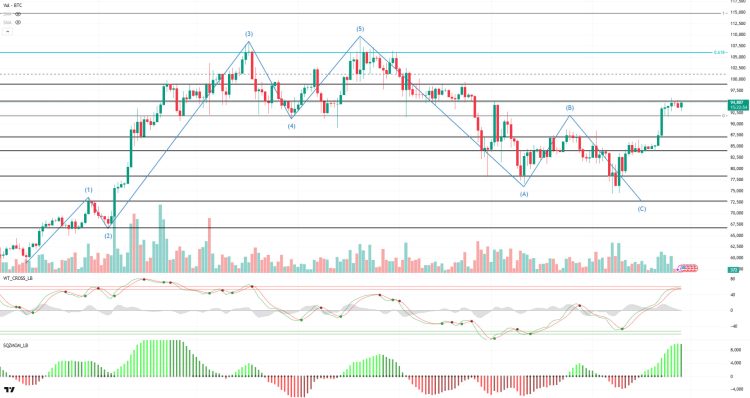
When we look at the technical outlook, it is seen that BTC, which has recorded a steady growth, has left behind a week in which it gained bullish momentum. While BTC started the week at the 88,000 level, it has risen above the 95,000 level during the week, recording a value increase of approximately 11.21%. In line with the Elliott Wave theory we analyzed in previous weeks, BTC completed its movement towards point C and tested the 74,600 level twice, which is the bottom level in line with the pattern. With strong buying from this level, BTC turned its direction upwards and reached 95,000 resistance, continuing to maintain its uptrend without correction. The Wave Trend Oscillator has reached the overbought zone on the daily chart and is about to generate a sell signal. Momentum indicators are showing a weakening trend after a significant increase. Looking at the technical structure, it can be said that BTC’s correction may be an expected move, but the price is now more sensitive to fundamental developments and macro data. Liquidation data shows that on a weekly basis, short positions are sparse, whereas long positions are gaining weight in BTC. Although this shows that investors continue to believe in the medium-term rise, it should be noted that excessive long accumulation may pose a risk for a reverse price movement in the future. The overall technical structure is not positive compared to the previous week. While technical indicators signal a slowdown, the price seems to maintain its upward momentum with the support of fundamental developments. In particular, trade tensions between the US and China and the clash of rhetoric between Trump and Powell stand out as important headlines that could put pressure on crypto markets next week. In addition, macro developments will play a decisive role on BTC price this week. With all these developments, it is worth mentioning that if the rise continues, six-digit levels are now only 5% away. Fundamental developments and persistence above 95,000 will continue to be critical for the direction of the market.
Supports 92,000 – 87,000 – 84,000
Resistances 95,000 – 99,000 – 101,400
ETH/USDT
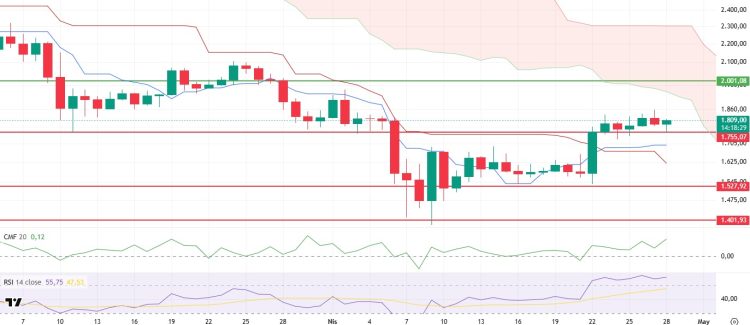
Last week, the ongoing trade tensions between the US and China began to ease, creating a significant relief in global markets. Especially with the increase in risk appetite, the rises seen in stock markets were reflected positively on the cryptocurrency market. In light of these developments, the ETH price managed to break through the $1,755 resistance level, which it had been struggling to overcome for a while, and then rose to the $1,850 level with a strong momentum. This price action has set the stage for significant changes not only in the spot markets but also in Ethereum’s on-chain data. When on-chain data is analyzed in detail, it is observed that there is a significant increase in the total amount of ETH staked. This increase shows that investors’ long-term confidence in Ethereum has increased and they have developed a more permanent commitment to the network. This increase in the amount staked also has the effect of taking supply out of circulation, reducing the selling pressure in the market. In addition, the recovery in transaction volumes in the NFT market and the increase in the number of transactions on Layer 2 solutions are among the important indicators that the usage areas of the Ethereum ecosystem are expanding.
When technical indicators are analyzed, there was an extremely critical development in the ichimoku indicator. A strong buy signal was generated when the tenkan level crossed the kijun level upwards on the daily timeframe. This crossover is considered one of the most reliable signals in traditional technical analysis, indicating that the trend will continue upwards. The fact that the price is momentarily positioned above the next lower band of the Ichimoku kumo cloud makes it clear that the uptrend is strengthening and supporting the overall positive outlook of the market. Buyers can be expected to maintain their dominant position in the market as long as the lower band of the Kumo cloud persists above it. Cumulative Volume Delta (CVD) analysis reveals that the rally was mainly driven by the spot markets, while the futures market saw an increase in selling positions. This suggests that the rally was supported by healthy, real buying demand and was driven by direct spot buying, not leveraged positions. Despite the sell-off in the futures markets, the upward movement of the price implies that short positions are being squeezed and a potential short squeeze is on the agenda . The Chaikin Money Flow (CMF) indicator also continues its upward momentum, crossing into positive territory in line with the price action. This strong positive momentum in CMF confirms that liquidity in the spot market continues to increase and market participants are clearly taking buy positions. This data gives a strong signal, especially regarding the sustainability of upward movements. Momentum indicators are also showing a significant strengthening. Upward trends in indicators such as RSI, Stochastic RSI and MACD are correlated with the price. This increase in momentum is another factor that supports the possibility that the price rise is not just a short-term reaction movement but a structural trend formation. There are also structural changes in the options market that generate positive signals for Ethereum. Especially in the last few days, there has been a significant increase in the number of open positions in call options with strike prices of $2,000 and $2,200. This indicates that market players have increased expectations that the price could rise above $2,000 in the coming weeks. The downtrend in the put-call ratio (PCR) in the last few days is also a data set that confirms that the risk appetite in the market has increased and investors prefer bullish positions. In addition, on the implied volatility (IV) side, the rise in the implied volatility of call options indicates that higher premiums are being paid for upward movement and the market has started to price upside risks.
All in all, the common language of technical and on-chain data paints a very strong positive scenario for Ethereum. Under this outlook, ETH is likely to spend the week maintaining its bullish trend. In the short term, the $2,000 level stands out as an important psychological and technical resistance point. The price can be expected to make a bullish move towards the $2,000 level. However, profit realizations in this region and the possibility of profit traders turning to sales should not be ignored. On the other hand, the $1,755 level is the most critical support in terms of downside risks. Daily closes below this region may weaken the uptrend and cause increased selling pressure. For this reason, the $1,755 level should be closely monitored; if this level is maintained, the uptrend can be expected to continue towards higher targets.
Supports 1,755 – 1,527 – 1,401
Resistances 2,001 – 2,203 – 2,589
XRP/USDT
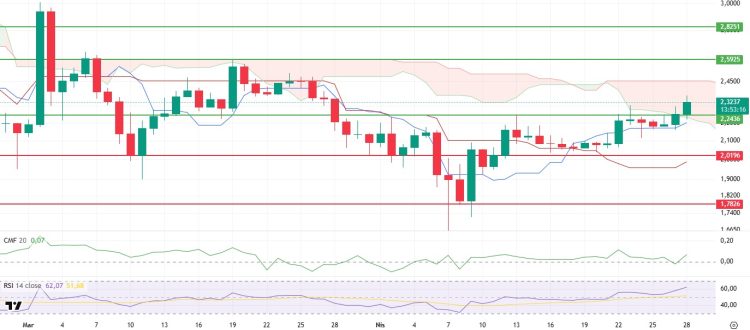
The increased risk appetite and positive sentiment in global markets last week was strongly reflected in the cryptocurrency market. With the direct impact of these developments, Ripple (XRP) achieved a significant technical success by breaking the $2.24 resistance level and the kumo cloud lower band on the ichimoku indicator upwards. In addition to this strengthening in price action, there was also an important development for Ripple on the fundamental side. Ripple’s new stablecoin, RLUSD, which is fully backed by dollar deposits and short-term US Treasury bonds, went live on the Aave V3 Ethereum market, rapidly increasing its adoption rate within the ecosystem. RLUSD’s strong fundamentals are an important step towards Ripple’s goal of merging traditional finance and decentralized finance, and may indirectly support XRP use cases in the long term.
When the technical data is analyzed in detail, the strong buy signal formed by the Tenkan level crossing the Kijun level upwards in the ichimoku indicator, which formed last week and continued its effect this week, draws attention. This crossover continues to form the basis of the upward trend in XRP, as it is a very reliable leading indicator in trend changes. The fact that the price has now entered the sand cloud and is moving towards the upper band of the cloud at the level of $2.45 indicates that buyers continue to dominate the market and the price is likely to test this important resistance in the short term. The increase in volume, especially in the movements within the kumo cloud, should be considered as another important factor indicating that this rise is supported by the market. Looking at the Chaikin Money Flow (CMF) indicator, it is observed that the structure that has been fluctuating in the negative zone for a long time has ended and a transition to the positive zone has been made. The upward movement of CMF in the positive zone confirms that the net liquidity entering the market is increasing and the buy side is gaining strength. This data is an important factor that supports the sustainability of the upward movement by showing that there is a real demand behind the price rise. Momentum indicators have also gained strength in line with the price action. Upward trends are clearly observed in indicators such as Relative Strength Index (RSI), Stochastic RSI and MACD. In particular, the RSI’s progression towards the overbought zone supports the fact that the main trend is upward and the price is on a strong footing, although there is a risk that the price may enter a resting phase in the short term. This structure of momentum indicators suggests that XRP’s rise is not just a short-term speculation, but a structural strengthening.
As a result, in the light of technical indicators and fundamental developments, it is clear that XRP started the week with a strong bullish momentum. Under this outlook, it seems quite likely that the price will attempt to exceed the upper band of the kumo cloud at the level of $2.45 in the short term and if it successfully crosses this level, it will continue to rise up to the main resistance level of $2.59. The $2.59 level is a critical threshold, and a breakout of this region on volume could allow the medium-term positive trend in XRP to establish a much stronger footing. On the other hand, in possible pullbacks, the $2.24 level is now a critical level that has experienced a strong support-resistance transformation. In case of a downward break of this region, a correction of the price towards the Kijun level and a retreat to the inner borders of the kumo cloud should be considered within the possibilities. Therefore, while the upside potential continues, careful risk management around the $2.24 level is of great importance.
Supports 2.2436 – 2.0196 – 1.7826
Resistances 2.5925 – 2.8251 – 3.1969
SOL/USDT
Last week in the Solana ecosystem;
- Following the failure of SIMD-228 to achieve consensus, Galaxy Research continues to keep the MESA (Multiple Election Stake-Weight Aggregation) system on the agenda, which aims to bring a more inclusive approach to the voting process.
- Breakpoint, Solana’s biggest community event, was held on April 25th.
- Opensea, one of the largest nft marketplaces, has opened SOL token trading.
- GSR will support consumer products firm Upexi to build a SOL treasury with a $100 million private investment.
- Astra Fintech has committed $100 million for Solana’s expansion in Asia.
- Janover bought another $11.5 million in SOL. The Nasdaq-listed company has over $36 million in SOL since adopting a Solana treasury strategy earlier this month.
- Solayer introduces crypto card for chain payments.
- The Solana Foundation has launched a new policy aimed at strengthening decentralization in its network. This change is said to be designed to reduce reliance on foundation delegation, encourage community-supported validators and provide a more efficient and decentralized network.
- Sol Strategies secured a $500 million convertible bond loan from ATW Partners, the largest financing deal in the Solana ecosystem.
- Robinhood will remove Solana fees by June 9th.
On the onchain side;
- Whale wallets increased from 4,943 to 5,019.
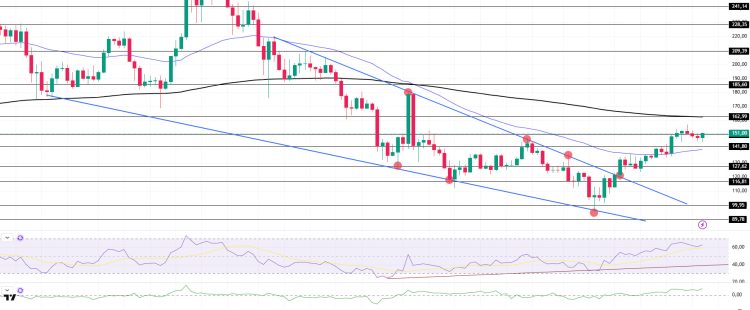
With these developments, when we look technically at SOL, the local token of the network, it has risen by about 10.68% since last week. Breaking the downtrend that formed on March 3 on our daily chart, the asset managed to hold above the 50 EMA (Blue Line) and continued to rise, gaining momentum from here. It is currently testing the $150.23 level, which is a strong resistance. If it breaks here , it may test the $162.99 level and the 200 EMA (Black Line). Otherwise, the $127.62 level should be followed. The asset is located between the 50 EMA (Blue Line) and the 200 EMA. This shows us that the asset is in the decision phase. However, the 50 EMA (Blue Line) continues to be below the 200 EMA (Black Line). With the death cross, the downward momentum may continue and cause the asset to fall further in the medium term. Relative Strength Index (RSI)14 remained in positive territory. The uptrend that started on February 26 continues. This may cause the price to rise further. Chaikin Money Flow (CMF)20 indicator is in positive territory. The negative daily volume may lower the CMF slightly. If the positive results in macroeconomic data and positive developments in the ecosystem continue, it may test the first major resistance level of $162.99. In case of negative macroeconomic data or negative news in the Solana ecosystem, the $116.81 level can be followed and a buying point can be determined.
Supports 141.80 – 127.62 – 116.81
Resistances 150.23 – 162.99 – 185.60
DOGE/USDT
Dogecoin holders celebrated Dogeday on April 20th, marking the meme coin’s unofficial holiday. Dogecoin’s open interest surpassed the $2 billion mark after a steady increase over the last month. Coeptis Therapeutics and Z Squared merge with a focus on Dogecoin mining. The companies aim to create the largest publicly traded Dogecoin miner through the merger.
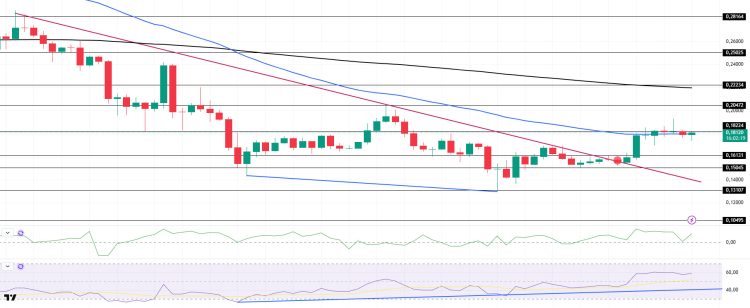
If we analyze DOGE from a technical point of view, when we look at the daily chart, the price has increased by about 14.13% since last week. On our daily chart, the downtrend that started on February 14 was broken to the upside with a bullish candle and is currently testing the 50 EMA (Blue Line) as resistance. On the other hand, the 50 EMA (Blue Line) remained below the 200 EMA (Black Line). In addition, the death cross pattern shows us that the downtrend continues. When we look at the Chaikin Money Flow (CMF)20 indicator, money inflows have increased and the indicator has turned positive. The positive money inflows during the day indicate that price increases may start and CMF may move to the upper levels of the positive zone. Relative Strength Index (RSI)14 remained in positive territory. At the same time, there is a positive divergence and the uptrend that has been going on since April 7 continues. In case of possible macroeconomic conditions and negative developments in the ecosystem, the 0.16131 dollar level can be followed as a strong support place. In case the retracement ends and the rises begin, the 0.22234 dollar level should be followed as a strong resistance.
Supports 0.16131 – 0.15045 – 0.13107
Resistances 0.18224 – 0.20472 – 0.22234
TRX/USDT
Last week, another 2 billion USDT was minted on the Tron network, bringing the amount of USDT in circulation on the network to $70.7 billion. A total of 47.46 million TRX were burned during the week of April 21 – 27, creating a deflationary effect on Tron supply. It was announced by Tron founder Justin Sun 2 weeks ago that the total number of accounts on the Tron network reached 300 million. This number increased to 302.8 million within 2 weeks. In addition, the total revenue of the Tron network last week was 10.4 million dollars and maintained its first place among all networks with this revenue.
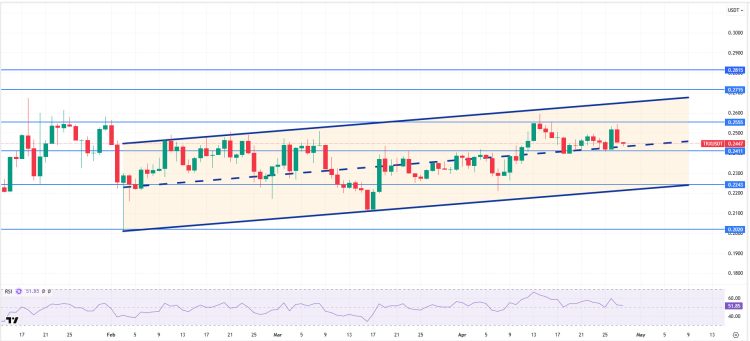
TRX, which started last week at 0.2437, rose about 0.5% during the week and closed the week at 0.2453. TRX, which is currently trading at 0.2447, continues its movement within the bullish channel on the daily chart and is in the middle band of the channel. With a Relative Strength Index (RSI) value of 51, it can be expected to rise slightly from its current level and move towards the upper band of the channel. In such a case, it is expected to test the 0.2555 resistance. If it closes daily above the 0.2555 resistance, it may continue its rise and may want to test the 0.2715 resistance. If it fails to close daily above the 0.2555 resistance, it may decline with the possible sales reaction that may occur. In such a case, it may test 0.2243 support. As long as it stays above 0.2020 support on the daily chart, the bullish demand can be expected to continue. If this support is broken, selling pressure may increase.
Supports 0.2411 – 0.2243 – 0.2020
Resistances 0.2555 – 0.2715 – 0.2815
AVAX/USDT
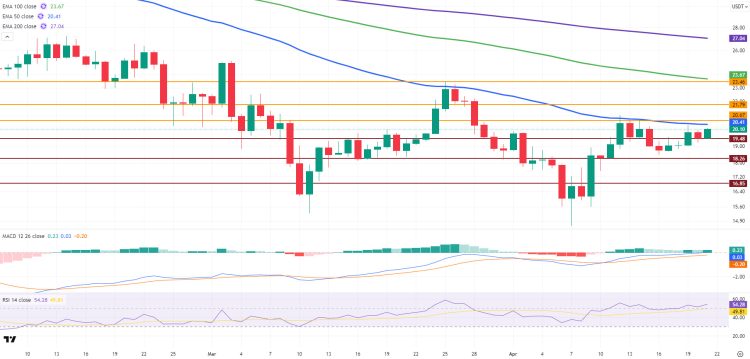
AVAX, which started last week with an increase from $19.49, continued to rise up to $23.07 during the week. After declining with the sales at this level, it was traded in a horizontal band between 21.70 and 22.30 dollars throughout the week. With the decline on the last day of the week, the weekly closing was realized at $21.69. AVAX, which started the new week with a decline, fell to the 50-period Exponential Moving Average (EMA50) level. However, it recovered with purchases from this level and started to rise again and continues to be traded above the resistance level of $21.79. Although a slowdown in positive momentum is observed, momentum is still in the positive zone.
On the daily chart, the MACD (Moving Average Convergence/Divergence) line is above the signal line and in positive territory. This structure suggests that momentum is on the upside. AVAX is currently above the EMA50 but faces significant resistance at the EMA100 level. Technically, momentum continues to move in a positive direction within the bullish channel.
If a daily close above the $21.79 resistance level is realized in AVAX, the first target will be the EMA100 and the $23.46 level. Breaking these levels could lead to a rise to $25.12 and then to $27.02, respectively. Positive MACD outlook and recovering RSI values support this scenario. However, a daily close below the $21.79 resistance level and a subsequent AVAX break below the EMA50 level could trigger a pullback towards the $19.48 and $18.26 support levels.
(EMA50: Blue Line , EMA100: Green Line , EMA200: Purple Line)
Supports 20.67 – 19.48 – 18.26
Resistances 23.46 – 25.12 – 27.02
SHIB/USDT
The Shiba Inu (SHIB) ecosystem has seen an increase in whale activity, a sharp rise in daily burn rates and a growing TVL on the Shibarium network in recent weeks. Transactions over $1 million have regained momentum, while SHIB’s daily burn rate increased by 926%, signaling a strong supply contraction. At the same time, Shibarium’s total locked value reached nearly $3 million, confirming the acceleration in network utilization. These developments suggest a more solid foundation for SHIB beyond speculative interest.
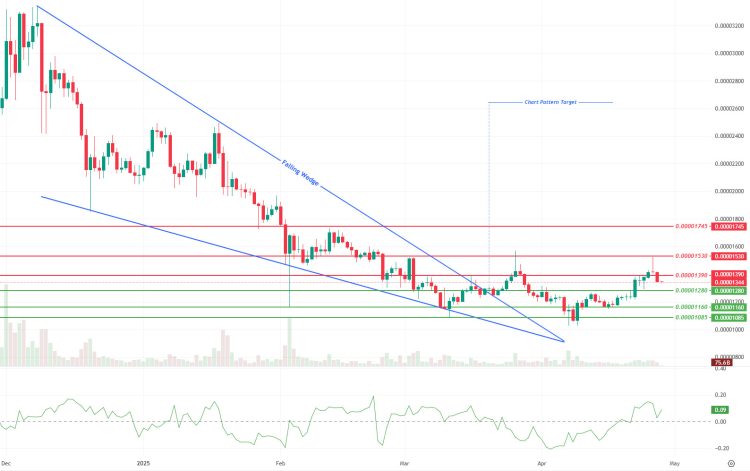
This week, the Shiba Inu chart shows that the momentum indicator has strengthened further while trading volume has declined significantly, suggesting that the bullish move is not supported by broad participation. On the other hand, the increase in market volatility suggests that the price is vulnerable to sudden fluctuations in the short term. Last week’s bullish attempt ended with resistance at $0.00001530 and the price is currently retreating towards critical support around $0.00001280. The Chaikin Money Flow (CMF) indicator is still in positive territory, indicating that there is still a net inflow of capital and investor confidence is maintained. If the $0.00001280 support can be maintained, buyers are likely to regain weight and target the first resistance zone around $0.00001390 and then the tested $0.00001530 level. However, if this critical support is broken, the selling pressure will accelerate and the next strong zone will be $ 0.00001160, and if this zone is lost, the level of $ 0.00001085 may indicate a new search for a new base.
Supports 0.00001280 – 0.00001160 – 0.00001085
Resistances 0.00001390 – 0.00001530 – 0.00001745
LTC/USDT
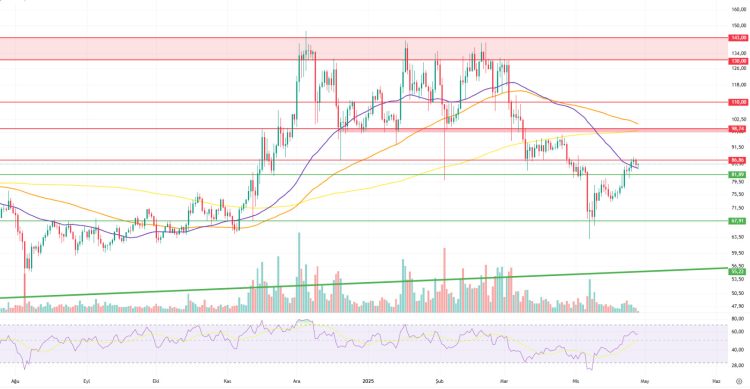
Litecoin started this week at 85.39, up 9.77% over the past week. In this process, it lost 0.33% compared to Bitcoin. While its current market capitalization hovered around $6.395 billion, it maintained its 21st place in the crypto market rankings last week. The amount of open interest in futures increased by $26 million compared to last week and started the week with an open interest of $238 million, while funding rates turned negative.
The price breaking above the 50-day moving average can be considered as a positive signal. However, the fact that the price is still below the 100 and 200-day moving averages and the open positions in futures are predominantly short indicates that it may be too early for a rapid rise.
In case of general pullbacks in the market, the first important support for Litecoin is at 81.89. Below this, the 67.91 level, which has been tested in recent weeks and stands out as a local bottom, is another critical horizontal support. Finally, the 55.22 level, where the rising trend line crosses, should be followed as another important support where reaction buying may come in possible sharp declines.
In the event of a general upward movement in the market, Litecoin can be expected to follow suit. In this scenario, the price is likely to struggle first at the resistance zone at 86.86. Then, the main resistance point at 98.74 stands out as a critical level where selling pressure may increase in upward movements. If the uptrend continues, the major resistance area at 110.00 should be followed. If this level is exceeded, a stronger momentum may be captured and new uptrends may be possible.
Resistances 86.86 – 98.74 – 110.00
Supports 81.89 – 67.91 – 55.22
LINK/USDT
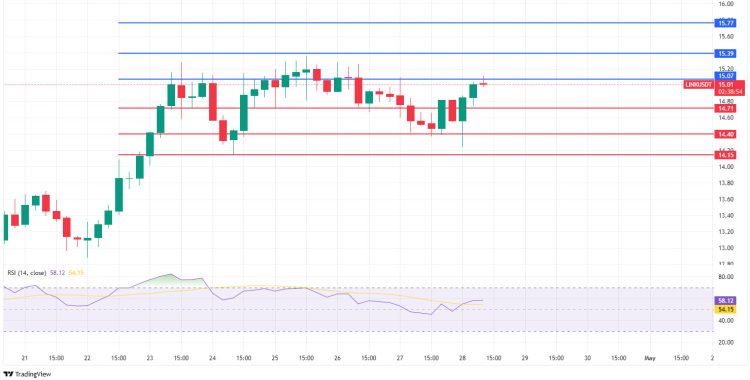
LINK reached the target price level of the descending wedge pattern we mentioned last week, reaching $15.00, and started to exhibit horizontal movements at this level. The fact that it did not face hard sales after reaching the target strengthened the price’s willingness to move upwards by signaling new formation in the $15.00 to $14.00 band. In particular, a possible double bottom formation formed in the $14.00 band and the bull flag appearance starting from the $12.80 band attract attention.
If the price closes above $15.00 on a daily basis, it will first point to $16.20, which is the target of the double bottom pattern, while $17.00 levels can be targeted if the bull flag pattern works. In order for these two positive scenarios to be realized, two main resistance lines must first be overcome: $15.07 and $15.39. On the support side, if the price falls back to $14.00, it may lead to a weakening of the $16.20 target. Our primary expectation is that the price will find support at $14.71 on possible declines and overcome the sequential resistance zones to reach the $16.00 band, which is the first target.
On the other hand, the Relative Strength Index (RSI) indicator is in positive territory, making the current momentum strong. However, if the RSI dips below the 50 level, it has the potential to increase the selling wave by causing a loss of strength. In the current situation, the $14.15 level should be carefully monitored; closes below this level may lead to increased selling pressure. On the upside, closes above $15.39 will cause the $16.20 and $17.00 levels to come to the fore as target prices for this week.
Supports 14.71 – 14.40 – 14.15
Resistances 15.07 – 15.39 – 15.77
‘
BNB/USDT
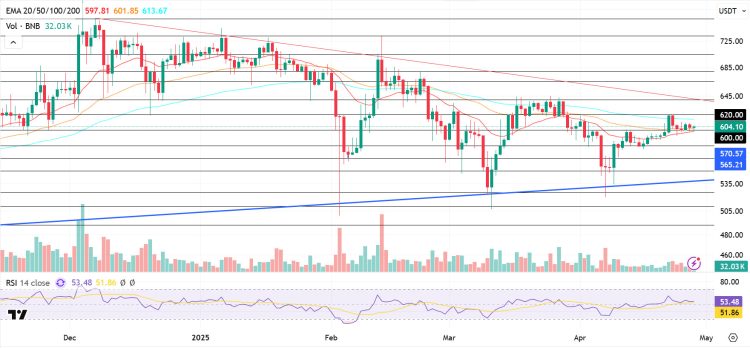
In technical terms, BNB/USDT, which accelerated positively with the support it received from the EMA 20 (red line) level at the beginning of last week (Monday, April 21), rose to the $620 level. However, seeing resistance from this region, the asset entered a new suppression process and retreated to the EMA 20 and $600 level. Despite this pullback, the asset managed to hold above the EMA 20 (red line) and the $600 level. With the general positive trend observed in the markets at the beginning of the new week, BNB/USDT is pricing on the positive side.
BNB/USDT, which is currently trading in the $600-620 band, exhibits a generally negative and weak outlook in the last week, especially on the volume side, when analyzed in terms of technical indicators. This indicates that there is some willingness to sell on the asset. On the other hand, the RSI indicator continues to remain above the 50 level and the average. The course of the RSI in this region indicates that the upward positive momentum may continue.
Within the framework of the current technical outlook, if the positive trend continues, the price is expected to rise to $620 in the first place. If this level is broken upwards, the $640 and $665 levels stand out as the next resistance zones, respectively. On the other hand, if the $620 level is not exceeded and selling pressure occurs, it is possible that the price may retreat to the $600 level. If the $600 support is broken downwards, the levels of $ 580 and $ 565 should be monitored as support zones.
Supports 600 – 580 – 565
Resistances 620 – 640 – 665
ADA/USDT
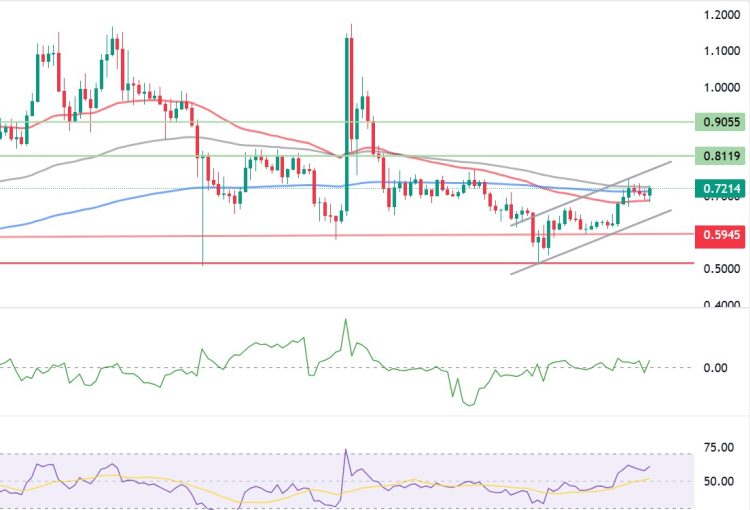
Cardano has gained 11.99% since the beginning of the week, rising to 0.7248. This week, Trump’s statements regarding the adjustment of tariffs on China and the reduction of retaliatory measures created optimism and were positively received by the market.
Looking at the technical chart, ADA entered an upward trend as of April 21, alongside efforts to further strengthen the long-term value storage role of cryptocurrencies, as stated by Trump. During the week, the price rose above the 200-period Exponential Moving Average (200 EMA – Blue Line) level on the daily chart, gaining upward momentum. At the same time, the Relative Strength Index (RSI) 14 indicator rose, breaking through the critical level of 55 to reach 61. The Chaikin Money Flow (CMF) retreated to the zero line and then continued to accelerate in the positive zone in line with the upward movement. This indicates that liquidity flow is moving in a positive direction again and buyers are gaining strength. As long as the price remains within the upward channel formed on the chart, momentum may continue upward, supporting a rise to the 0.7929 level. If the upward trend continues, resistance levels at 0.8069 and 0.8519 could be tested. This week, ahead of the Fed’s May interest rate decision, attention will be on US growth data, jobless claims, PCE data, and non-farm payrolls. If market volatility and uncertainty increase in light of these macroeconomic data, the support levels of 0.5804 and 0.5125 should be monitored. If these support levels are broken, the decline could deepen.
Supports 0.4917 – 0.5125 – 0.5910
Resistances 0.8069 – 0.8519 – 0.9055
LEGAL NOTICE
The investment information, comments and recommendations contained in this document do not constitute investment advisory services. Investment advisory services are provided by authorized institutions on a personal basis, taking into account the risk and return preferences of individuals. The comments and recommendations contained in this document are of a general type. These recommendations may not be suitable for your financial situation and risk and return preferences. Therefore, making an investment decision based solely on the information contained in this document may not result in results that are in line with your expectations.