
TECHNICAL ANALYSIS
BTC/USDT
Policy and institutional moves from the US and Brazil are taking interest in Bitcoin to a new level. The US Secretary of Commerce’s open support for the mining sector and Arizona’s passage of the Bitcoin Reserve Act are accelerating crypto adoption at the state level. At the same time, Brazilian bank Itaú’s $210 million Bitcoin reserve initiative and a 7-year low in stock market supply show that institutional investors continue to embrace BTC as a strategic asset.
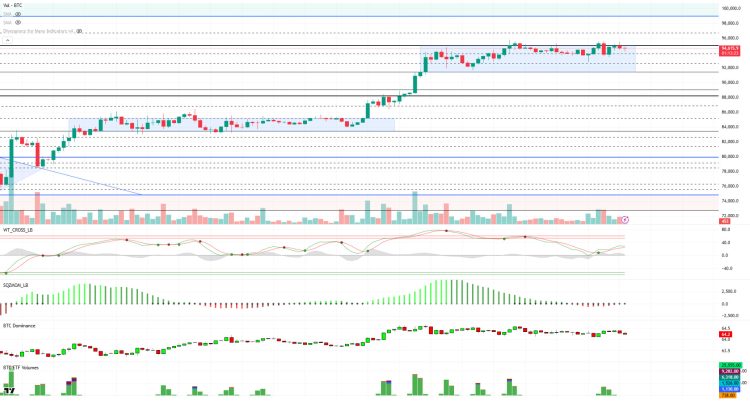
When we look at the technical outlook, it is seen that BTC price exhibited a fake breakout despite exceeding the 95,000 level as we mentioned in the previous analysis, and the accumulation of selling positions increased after this move. We stated that unless the breakout is supported by momentum support, the technical structure is not ready for a fully healthy rise. Indeed, despite a buy signal on the wave trend oscillator, the price experienced a limited pullback after breaching the 95,000 level and then retested this level once again without the necessary momentum. At the time of writing, BTC continues to trade at 94,700. The Wave trend oscillator is generating a weak buy signal, while BTC dominance stands at 64%. When we look at indicator mismatches, it is noteworthy that indicators such as RSI, Stochastic, Momentum and VWMACD gave a mismatch signal in the previous 95,000 attempt. This supports that the BTC price still needs a correction in technical terms. On the fundamental side, there is an optimistic mood. With ETF inflows reaching $591 million yesterday, the increase in volume on the ETF side indicates that institutional investor interest continues. This suggests that BTC maintains its bullish potential with fundamental support despite the need for technical correction. Accordingly, the 95,000 level will remain a critical reference point for BTC. If the momentum is supported by volume, BTC may be able to start a new uptrend towards six-digit prices. However, if the correction deepens, 94,000 intermediate support and then 92,800 levels will be critical follow-up points. In the event that selling pressure increases and 92,800 support is lost, the 89,000 level will come to the fore as the area where buying positions are concentrated.
Supports 94,000 – 92,800 – 91,450
Resistances 95,000 – 97,000 – 98,000
ETH/USDT
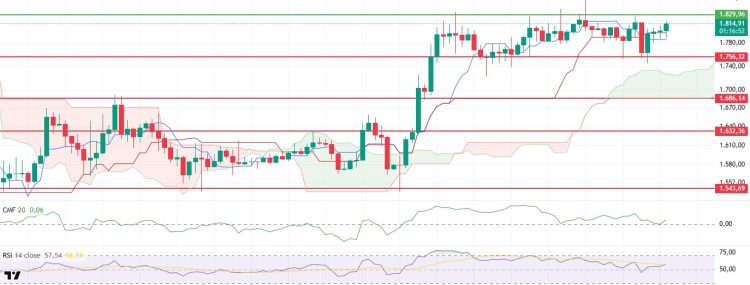
As mentioned in the previous evening’s analysis, after retreating to the important support point at the $1,756 level, ETH managed to rise above the $1,800 level again with the reaction it received from this region. This recovery also led to some remarkable changes in technical indicators.
Especially when the ichimoku indicator is analyzed, it is seen that a classic sell signal is formed when the tenkan level cuts the kijun level downwards. However, the strength of this signal is limited because the price is still hovering above the kumo cloud, indicating that the downward momentum is weak and the trend remains intact. In addition, the Chaikin Money Flow (CMF) indicator, which fell all the way down to the zero line amid yesterday’s selling pressure, is now back in positive territory after holding the zero line. This development is important in terms of indicating that market liquidity is working in the direction of buying again and buyer interest has started to increase on the spot side. This transformation in liquidity flow may have played an important role in the recent rise in the price. On the other hand, the Relative Strength Index (RSI) indicator is also showing a positive outlook. The RSI has crossed the based MA line to the upside without generating any negative mismatch signals. This crossover supports the strength of the price action and the possibility that the momentum may continue upwards.
In light of all these technical developments, it seems likely that the resistance point at $1,829 will be retested during the day. If this level is clearly exceeded, it may be possible to trigger more aggressive and harsh bullish movements. On the other hand, if the price retreats, the $1,786 level stands out as an intermediate support point. The fact that this level also overlaps with the tenkan level makes this region even more critical in technical terms. If persistence cannot be achieved at this support level, there may be a risk that the price may retreat to the level of $1,756 again.
Supports 1,756 – 1,686 – 1,632
Resistances 1,829 – 1,925 – 2,131
XRP/USDT
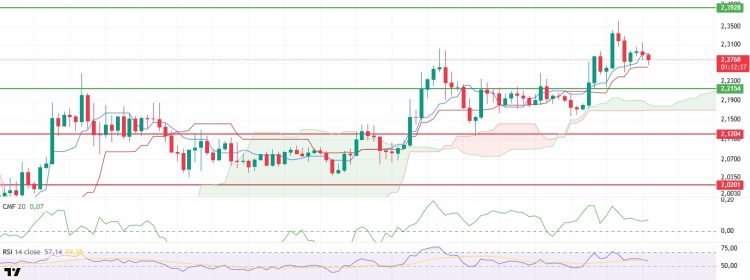
XRP retreated to the tenkan point at the $2.26 level in line with expectations in the previous evening hours. This region serves as an important support for the short-term outlook. Technical indicators on behalf of XRP, which is trying to hold on by getting a reaction from this level momentarily, continue to draw a weak picture in general.
Especially when the Relative Strength Index (RSI) indicator is analyzed, it is seen that the downward trend continues and there is a significant weakening in terms of buying momentum. The current position of the RSI indicates that the market is still under pressure and there is not enough momentum for an upside breakout. The Chaikin Money Flow (CMF) indicator, on the other hand, has started to recover slightly after a significant decline with yesterday’s depreciation. However, the fact that the indicator is still in negative territory indicates that liquidity outflow from the market continues. This is noteworthy as it indicates that investor confidence has not fully returned and the buy side has not yet come on board strongly. This weakness in liquidity flow may put pressure on short-term price movements. On the Ichimoku indicator side, there is a more neutral-positive picture. The fact that the tenkan level is still above the kijun level continues to generate positive signals in terms of trend. This structure shows that although the price is under pressure, the possibility of recovery in the short term has not completely disappeared. As long as the tenkan level remains above the tenkan level within the Ichimoku structure, the potential for upward price reactions is maintained.
In the light of all these technical data, falling below the kijun support at the level of $2.26 during the day and persistence in this region may cause the price to retreat to $2.21. In this case, selling pressure may increase again and the short-term negative structure may deepen. On the other hand, if the price holds above the $2.26 level and exceeds the tenkan level upwards, it may become possible for the price to recover towards the $2.39 levels again despite the weakness in technical indicators. In this scenario, buying momentum can be expected to regain strength.
Supports 2.2154 – 2.1204 – 2.0201
Resistances 2.3938 – 2.4721 – 2.8347
SOL/USDT
Marinade Finance has just announced the “Instant Unstake” feature, allowing staking users to shoot without waiting.
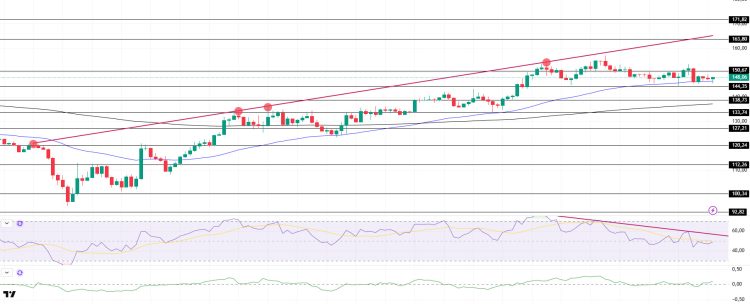
SOL continued its sideways movements. The asset remains below the downtrend that started on April 6. The price is currently testing the 50 EMA (Blue Line) as support. If it breaks down here, the $138.73 level should be followed. On the 4-hour timeframe, the 50 EMA (Blue Line) continues to hover above the 200 EMA (Black Line). This could mean a bullish continuation in the medium term. At the same time, the price remained above the two moving averages. This suggests that there is buying pressure in the market. The Chaikin Money Flow (CMF)20 indicator is in positive territory. At the same time, positive daily volume could push CMF higher. Relative Strength Index (RSI)14, on the other hand, continued to be below the downtrend that started on April 23 and continued the selling pressure. The $163.80 level appears as a resistance point in the rises driven by the upcoming macroeconomic data and the news in the Solana ecosystem. If it breaks here, the rise may continue. In case of retracements for the opposite reasons or due to profit sales, the support level of $138.73 can be triggered. If the price comes to these support levels, a potential bullish opportunity may arise if momentum increases.
Supports 144.35 – 138.73 – 133.74
Resistances 150.67 – 163.80 – 171.82
DOGE/USDT
Elon Musk shared a Doge-themed post from the X platform.
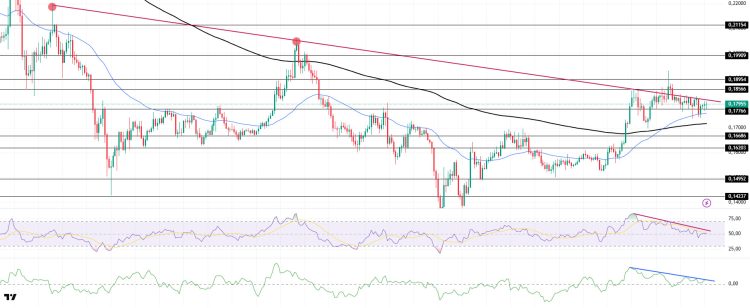
DOGE continued its sideways movement and is currently testing the downtrend as resistance. If it breaks it could trigger the strong resistance at $0.18954 again. The asset tested the 50 EMA (Blue Line) as support and accelerated from there. The asset is stuck between the resistance point of the downtrend and the 50 EMA. On the 4-hour timeframe, the 50 EMA (Blue Line) continues to be above the 200 EMA (Black Line). However, the price is pricing above two moving averages. These suggest that the asset may be in a bullish phase in the medium term. When we examine the Chaikin Money Flow (CMF)20 indicator, it is in positive territory and money inflows have started to increase. At the same time, the downtrend that started on April 22 continues, but it is currently testing this as resistance. On the other hand, Relative Strength Index (RSI)14 is at neutral level and the upward momentum seems to have diminished. At the same time, the downtrend that started on April 23 continues. The $0.18954 level stands out as a very strong resistance in the uptrend due to political reasons, macroeconomic data and innovations in the DOGE coin. In case of possible retracements due to political, macroeconomic reasons or due to negativities in the ecosystem, the $ 0.16686 level, which is a strong support place, is an important support place. If the price comes to these support levels, a potential bullish opportunity may arise if momentum increases.
Supports 0.17766 – 0.16686 – 0.16203
Resistances 0.18566 – 0.18954 – 0.19909
Legal Notice
The investment information, comments and recommendations contained herein do not constitute investment advice. Investment advisory services are provided individually by authorized institutions taking into account the risk and return preferences of individuals. The comments and recommendations contained herein are of a general nature. These recommendations may not be suitable for your financial situation and risk and return preferences. Therefore, making an investment decision based solely on the information contained herein may not produce results in line with your expectations.


