
TECHNICAL ANALYSIS
BTC/USDT
US Secretary of Commerce Howard Lutnick stated that Bitcoin will be a priority agenda item in the coming period, while the South Korean ruling party’s plan to legalize spot crypto ETFs and stablecoin regulations also strengthens state support for the sector. On the other hand, with the rise in Bitcoin prices, Strategy’s floating profit from its assets reached $ 14.8 billion, revealing the profitability of institutional Bitcoin investments.
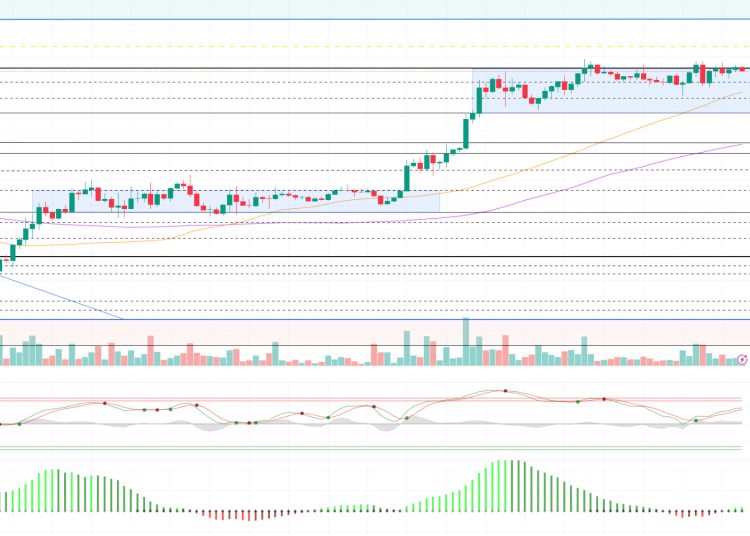
Looking at the technical outlook, BTC continues to push the 95,000 level compared to the previous analysis. It is noteworthy that the buy signal on the Wave trend oscillator remains intact and the momentum indicator has moved into positive territory. BTC continues to move in accordance with the high tight flag pattern once again, exhibiting low volatility within a narrow band range without giving any buying opportunity. Looking at the liquidation data, short positions accumulated above the 96,700 level. This indicates that the 96,700 region may become the first target if the 95,000 level is broken with volume. While the technical structure suggests that there is a favorable backdrop for a bullish move, there is still a lack of a strong driving catalyst on the fundamental side to support this move. Continued positive inflows on the spot ETF side have kept the price consolidated at these levels, preventing a possible correction. On the other hand, the uptrend that started when the SMA 50 crossed the SMA 100 to the upside seems to be continuing technically. Currently, the 50-day moving average is near 93,000 and the 100-day moving average is near 90,000, indicating that BTC continues to support the medium-term uptrend. On the other hand, although the technical bullishness is expected to continue, the 94,000 level will be the first support point in a possible correction, while below this level, the 92,800 level will be followed as another important support.
Supports 94,000 – 92,800 – 91,450
Resistances 95,000 – 97,000 – 98,000
ETH/USDT
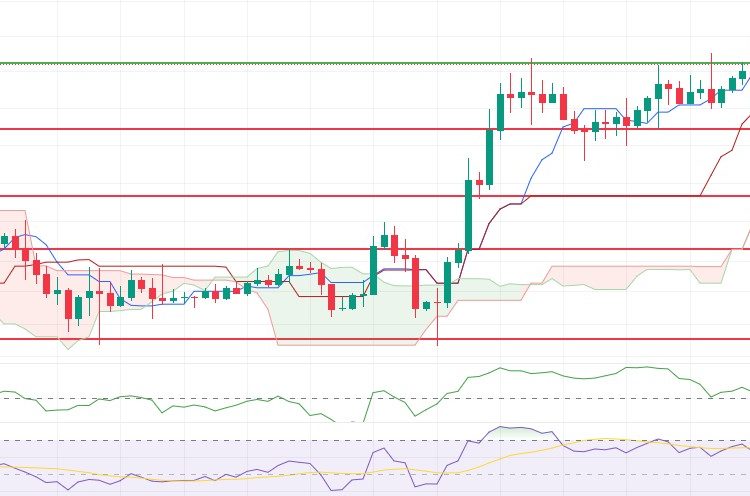
ETH rose to the important resistance point of $1,829 during the day, in line with expectations. However, with the selling pressure from this region, the price retreated a little. This price action also caused some changes in technical indicators.
The slight pullback observed in the Chaikin Money Flow (CMF) indicator as the price reached the $1,829 level suggests that investors are acting more cautiously at this level and that there has been limited liquidity outflows from the market. This suggests that market participants may have turned towards profit realization at this resistance zone. Similarly, the Relative Strength Index (RSI) indicator is also trending downwards, signaling a weakening in short-term momentum. The loss of momentum suggests that the price may struggle to hold at this level. The fact that the sell signal on the ichimoku indicator, which was also emphasized in the analysis made in the morning, is still valid, stands out as a factor that supports the need to be careful in terms of the general outlook.
Against this technical backdrop, the possibility of a short-term correction should not be ruled out, with the price facing strong resistance at $1,829 and some indicators signaling weakness. In such a scenario, the area around $1,800 between the tenkan and kijun levels could be considered as the first intermediate support. However, a downside break of this level could cause the correction to deepen and the price to retreat back down to the $1,756 level. On the other hand, if the price achieves a permanent close above the $1,829 level, the negative technical outlook may become invalid and the uptrend may continue once this resistance zone is breached.
Supports 1,756 – 1,632 – 1,543
Resistances 1,829 – 1,925 – 2,131
XRP/USDT
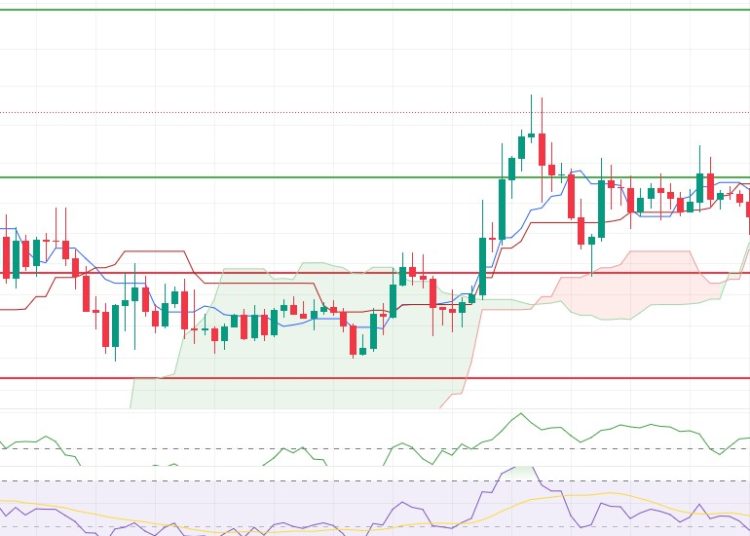
XRP has struggled to establish a clear direction during the day, trading sideways in a narrow price range. The price, which is momentarily trading between the tenkan and kijun levels, is stuck between these two levels, causing indecision among market participants. This narrow band movement creates an uncertain backdrop for the short-term direction.
When technical indicators are analyzed, the upward trend of the tenkan level in the ichimoku indicator can theoretically be considered as a positive signal. However, the fact that the price is still below this level prevents the confirmation of a possible positive scenario and causes the current uncertainty to persist. This suggests that the market has yet to find the confidence to support an upward momentum. On the other hand, the Chaikin Money Flow (CMF) indicator remained flat throughout the day, indicating that there is a state of equilibrium between buyers and sellers and that there is no clear directional preference in the market. This pause in investor behavior may pave the way for the price to persist at current levels. In this context, the most striking technical indicator is the Relative Strength Index (RSI). The continued downward movement of the RSI indicates that the weakening in market momentum is increasing and selling pressure may be at the forefront in the short term.
Taking all the technical data together, it seems likely that if the price loses the kijun support at $2.26 in the short term, the downward movement may gain momentum and drag XRP into a scenario where it may retreat towards the strong support zone at $2.21. However, if the price breaks above the tenkan level and maintains above this level, the current negative technical outlook may be invalidated. In this case, with the upside potential coming back into play, it may become possible for the price to move towards the resistance zone at the $2.39 level.
Supports 2.2154 – 2.1204 – 2.0201
Resistances 2.3938 – 2.4721 – 2.8347
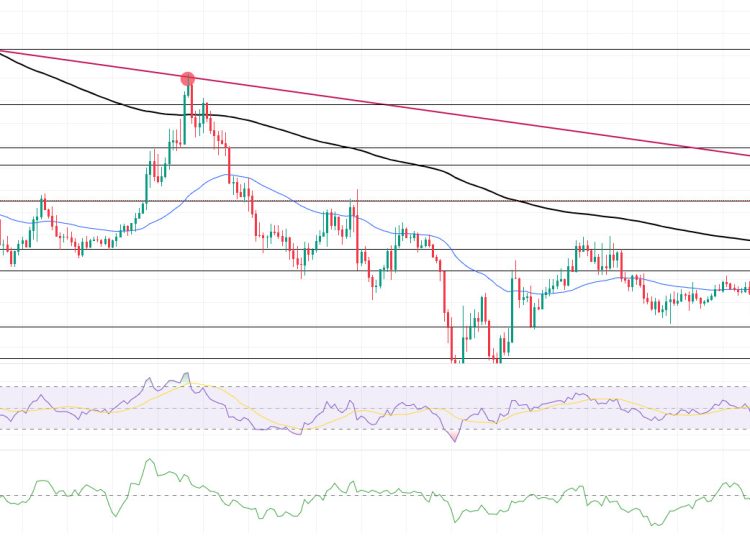
SOL/USDT
1inch launched on Solana plans a cross-chain swap for more than 1 million Solana tokens.
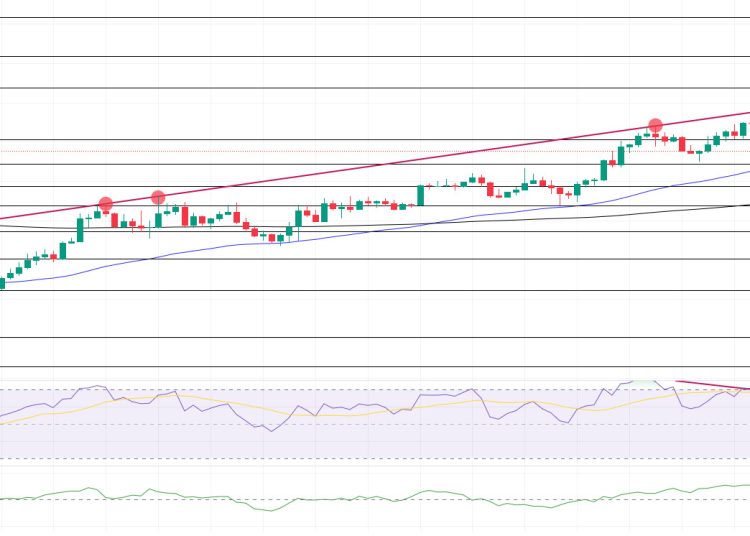
SOL continued to move sideways during the day. The asset remains below the downtrend that started on April 6. The price is currently close to the 50 EMA (Blue Line). If it breaks downwards here, the $138.73 level should be followed. On the 4-hour timeframe, the 50 EMA (Blue Line) continued to remain above the 200 EMA (Black Line). This could mean a bullish continuation in the medium term. At the same time, the price remained above the two moving averages. This suggests that there is buying pressure in the market. The Chaikin Money Flow (CMF)20 indicator is in positive territory. At the same time, positive daily volume could push CMF higher. Relative Strength Index (RSI)14, on the other hand, continued to be below the downtrend that started on April 23rd and switched to the negative zone by maintaining the selling pressure. The $163.80 level appears as a resistance point in the rises driven by the upcoming macroeconomic data and the news in the Solana ecosystem. If it breaks here, the rise may continue. In case of retracements for the opposite reasons or due to profit sales, the support level of $138.73 can be triggered. If the price comes to these support levels, a potential bullish opportunity may arise if momentum increases.
Supports 144.35 – 138.73 – 133.74
Resistances 150.67 – 163.80 – 171.82
DOGE/USDT
DOGE fell slightly during the day. Starting on March 6, it tested the downtrend as resistance and failed to break it and retreated slightly. It is currently testing the 50 EMA (Blue Line). If it breaks, it may test the 200 EMA (Black Line) as support. On the 4-hour timeframe, the 50 EMA (Blue Line) remains above the 200 EMA (Black Line). However, the price is pricing above two moving averages. These suggest that the asset could be in a bullish phase in the medium term. When we examine the Chaikin Money Flow (CMF)20 indicator, it is in positive territory and money inflows have started to increase. At the same time, it has broken the downtrend that started on April 22 upwards. This may continue the uptrend. On the other hand, Relative Strength Index (RSI)14 is at neutral level and the bullish momentum seems to have diminished. At the same time, the downtrend that started on April 23 continues. The $0.18954 level stands out as a very strong resistance point in the rises due to political reasons, macroeconomic data and innovations in the DOGE coin. In case of possible retracements due to political, macroeconomic reasons or due to negativities in the ecosystem, the $ 0.16686 level, which is a strong support place, is an important support place. If the price comes to these support levels, a potential bullish opportunity may arise if momentum increases.
Supports 0.17766 – 0.16686 – 0.16203
Resistances 0.18566 – 0.18954 – 0.19909
Legal Notice
The investment information, comments and recommendations contained herein do not constitute investment advice. Investment advisory services are provided individually by authorized institutions taking into account the risk and return preferences of individuals. The comments and recommendations contained herein are of a general nature. These recommendations may not be suitable for your financial situation and risk and return preferences. Therefore, making an investment decision based solely on the information contained herein may not produce results in line with your expectations.

