
TECHNICAL ANALYSIS
BTC/USDT
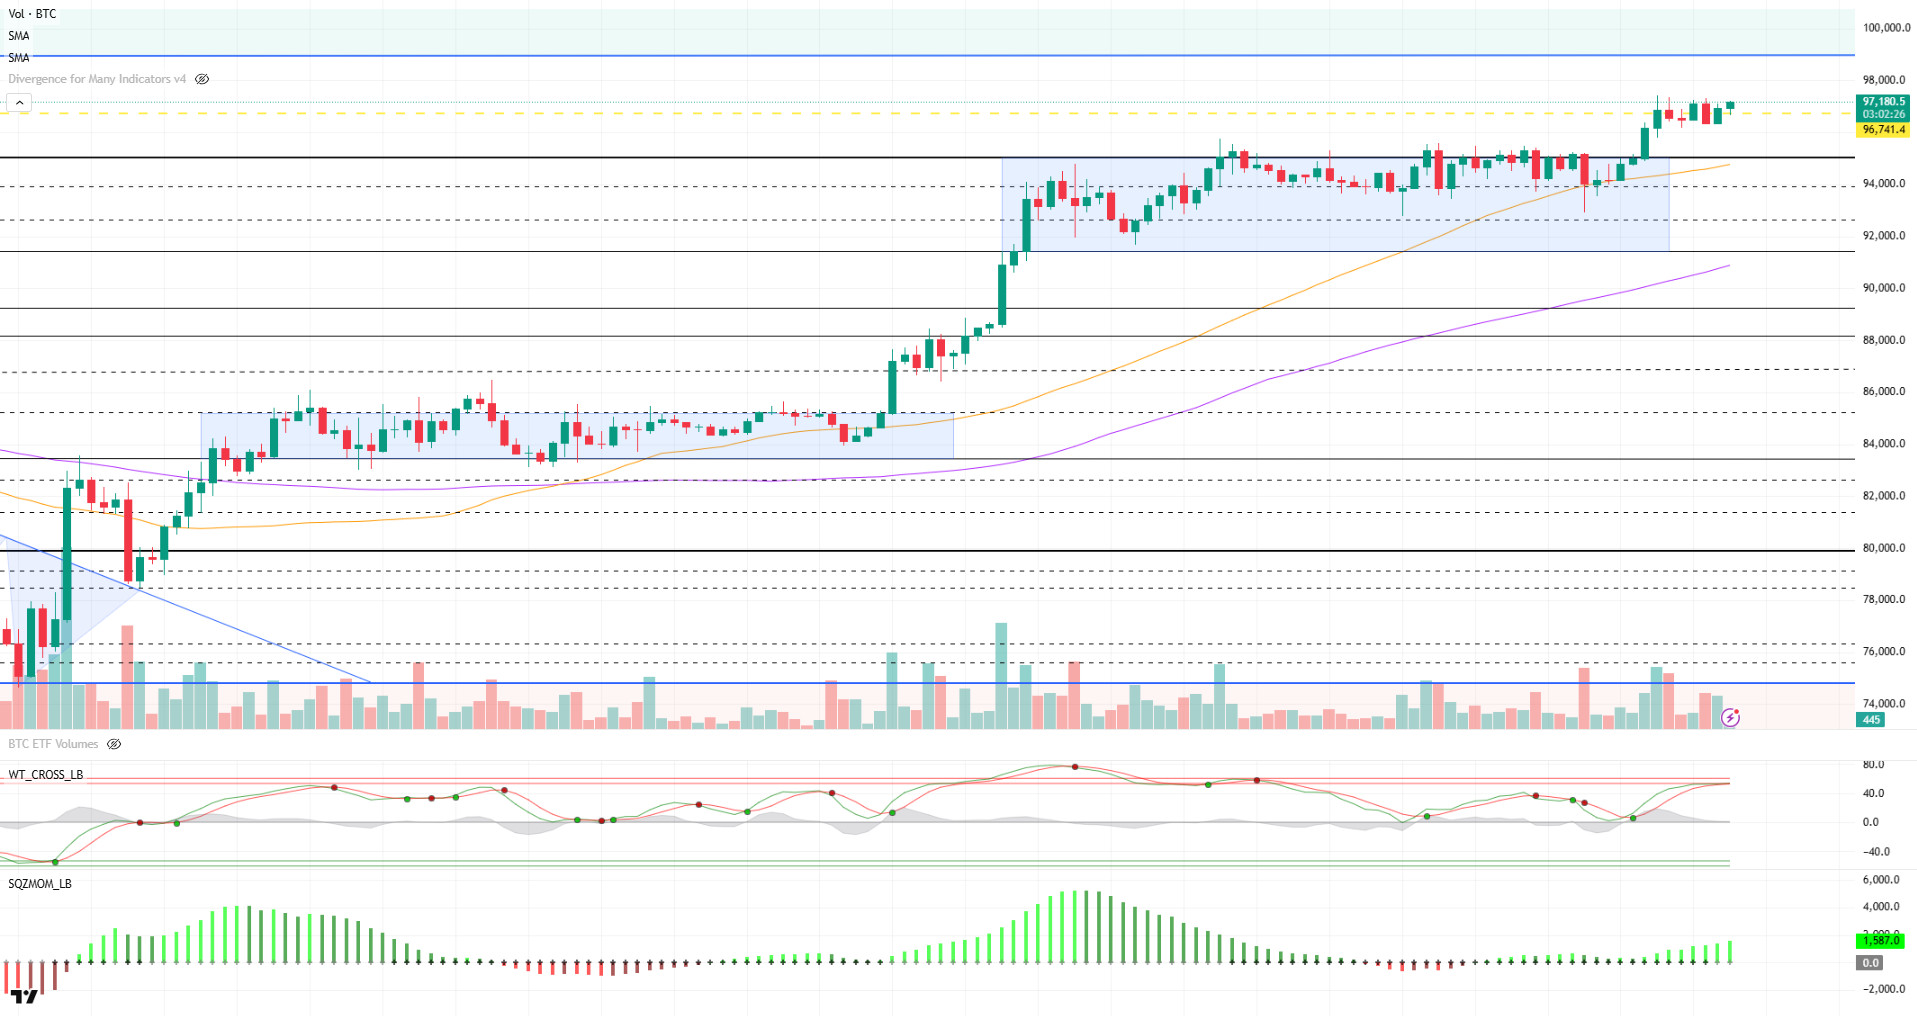
Strong non-farm payrolls data from the US (177K, expected: 138K) and the unemployment rate (4.2%) showed continued resilience in the labor market. On the crypto front, Jack Dorsey’s company Block is preparing to launch its US-made Bitcoin mining chip called “Proto” this year. At the same time, Goldman Sachs announced that it will increase its investments in digital assets; El Salvador added 9 BTC to its Bitcoin reserve. On the other hand, the UK has put on the agenda the regulation that will prohibit consumers from buying crypto with debt.
Looking at the technical outlook, BTC, which retreated to 96,400 during the day, started to push the 97,000 level again after the macroeconomic data. In terms of technical structure, a similar outlook to the previous analysis is maintained. The Wave Trend oscillator has reached the overbought zone and momentum indicators are still low, indicating that a possible correction in BTC continues to strengthen technically. BTC’s strong correlation with the US stock markets suggests that there is some room for further upside in the short term, especially with the futures market remaining positive. However, technically, the 97,000 – 98,000 band remains a strong resistance zone. Failure to exceed this zone may cause the price to reject here and cause a pullback towards the 95,000 level again. If the 97,000 – 98,000 range is broken to the upside, the 99,100 level stands out as the next key resistance point. If this level is tested, it could serve as the first retest area for six-digit levels. On the other hand, if a possible correction starts before these levels are tested, the loss of 95,000 support may increase the technical pressure and cause 94,000 and then 92,800 levels to come back on the agenda.
Supports 95,000 – 94,000 – 92,800
Resistances 97,000 – 98,000 – 99,100
ETH/USDT
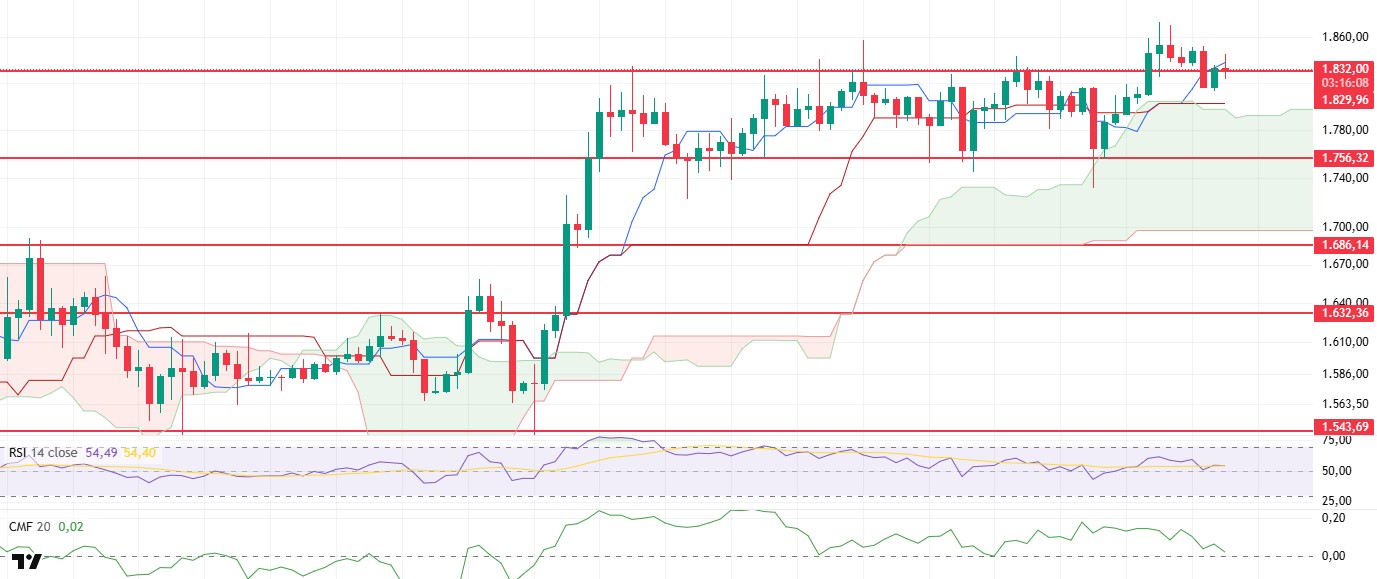
ETH experienced a short-term pullback after breaking its support at the $1,829 level downwards during the day. However, the price rebounded back above $1,829 amid buying from this level. Although this recovery shows that buyers are still active in the market to a certain extent, weakness in some technical indicators raises questions about the price’s permanence at these levels.
Chaikin Money Flow (CMF) has continued its decline and is very close to the zero line. This outlook suggests that net money inflows to the market have decreased and liquidity outflows have become dominant. This weakness in CMF suggests that investor confidence is fragile and bullish moves are not supported by strong volume. When the Ichimoku indicator is analyzed, it is noteworthy that the price cannot persist above the tenkan level. While this situation is an obstacle to turning the short-term direction upwards, it shows that a weak momentum is effective in the overall structure of the market. The fact that the price remains below the tenkan indicates that the negative technical outlook has become evident.
Therefore, a close below the $1,829 level, especially in the evening hours, could increase selling pressure and set the stage for a pullback towards the sand cloud resistance at $1,798 and then towards the main support zone at $1,756. Both levels are technically critical. In particular, a break below $1,756 could trigger a broader correction. Both the weakness in liquidity indicators and the technical fragility signaled by the ichimoku indicator reinforce this possibility.
Supports 1,829 – 1,756 – 1,632
Resistances 1,925 – 2,029 – 2,131
XRP/USDT
After retreating to the lower band of the kumo cloud during the day, XRP managed to rise above the $2.21 level again with reaction purchases from this level. However, this recovery movement offers an outlook that is not fully supported by technical indicators. In particular, negative mismatches in some indicators show that the rise is not on a healthy and sustainable ground.
An analysis of the Chaikin Money Flow (CMF) shows that despite the increase in the price, the indicator remains in negative territory and shows a downward trend. This indicates that capital inflows into the market are insufficient, while outflows continue. This weak course of the CMF suggests that the current uptrend is not supported by liquidity and the market is still cautious. This raises doubts about the permanence of the upward movement of the price. The Ichimoku indicator shows that the price continues to trade below both the tenkan and kijun levels. This suggests that the short and medium-term trend is still negative and upside attempts may remain under pressure. This positioning, especially on the ichimoku indicator, confirms that the overall technical outlook will remain weak unless the price breaks through the upper band of the kumo cloud.
In summary, if the XRP price loses the support at the $2.21 level in the evening, the selling pressure may become more pronounced and the price is likely to test the support area at the $2.12 level again. This level stands out as an important bottom in the short term. On the other hand, the current negative structure may become invalid if the price breaks the upper band of the kumo cloud at $2.25 in volume. In such a scenario, a new uptrend could begin. Therefore, both the ichimoku structure and liquidity flows should be carefully monitored.
Supports 2.2154- 2.0201 – 1.8932
Resistances 2.3938 – 2.4721 – 2.8347

SOL/USDT
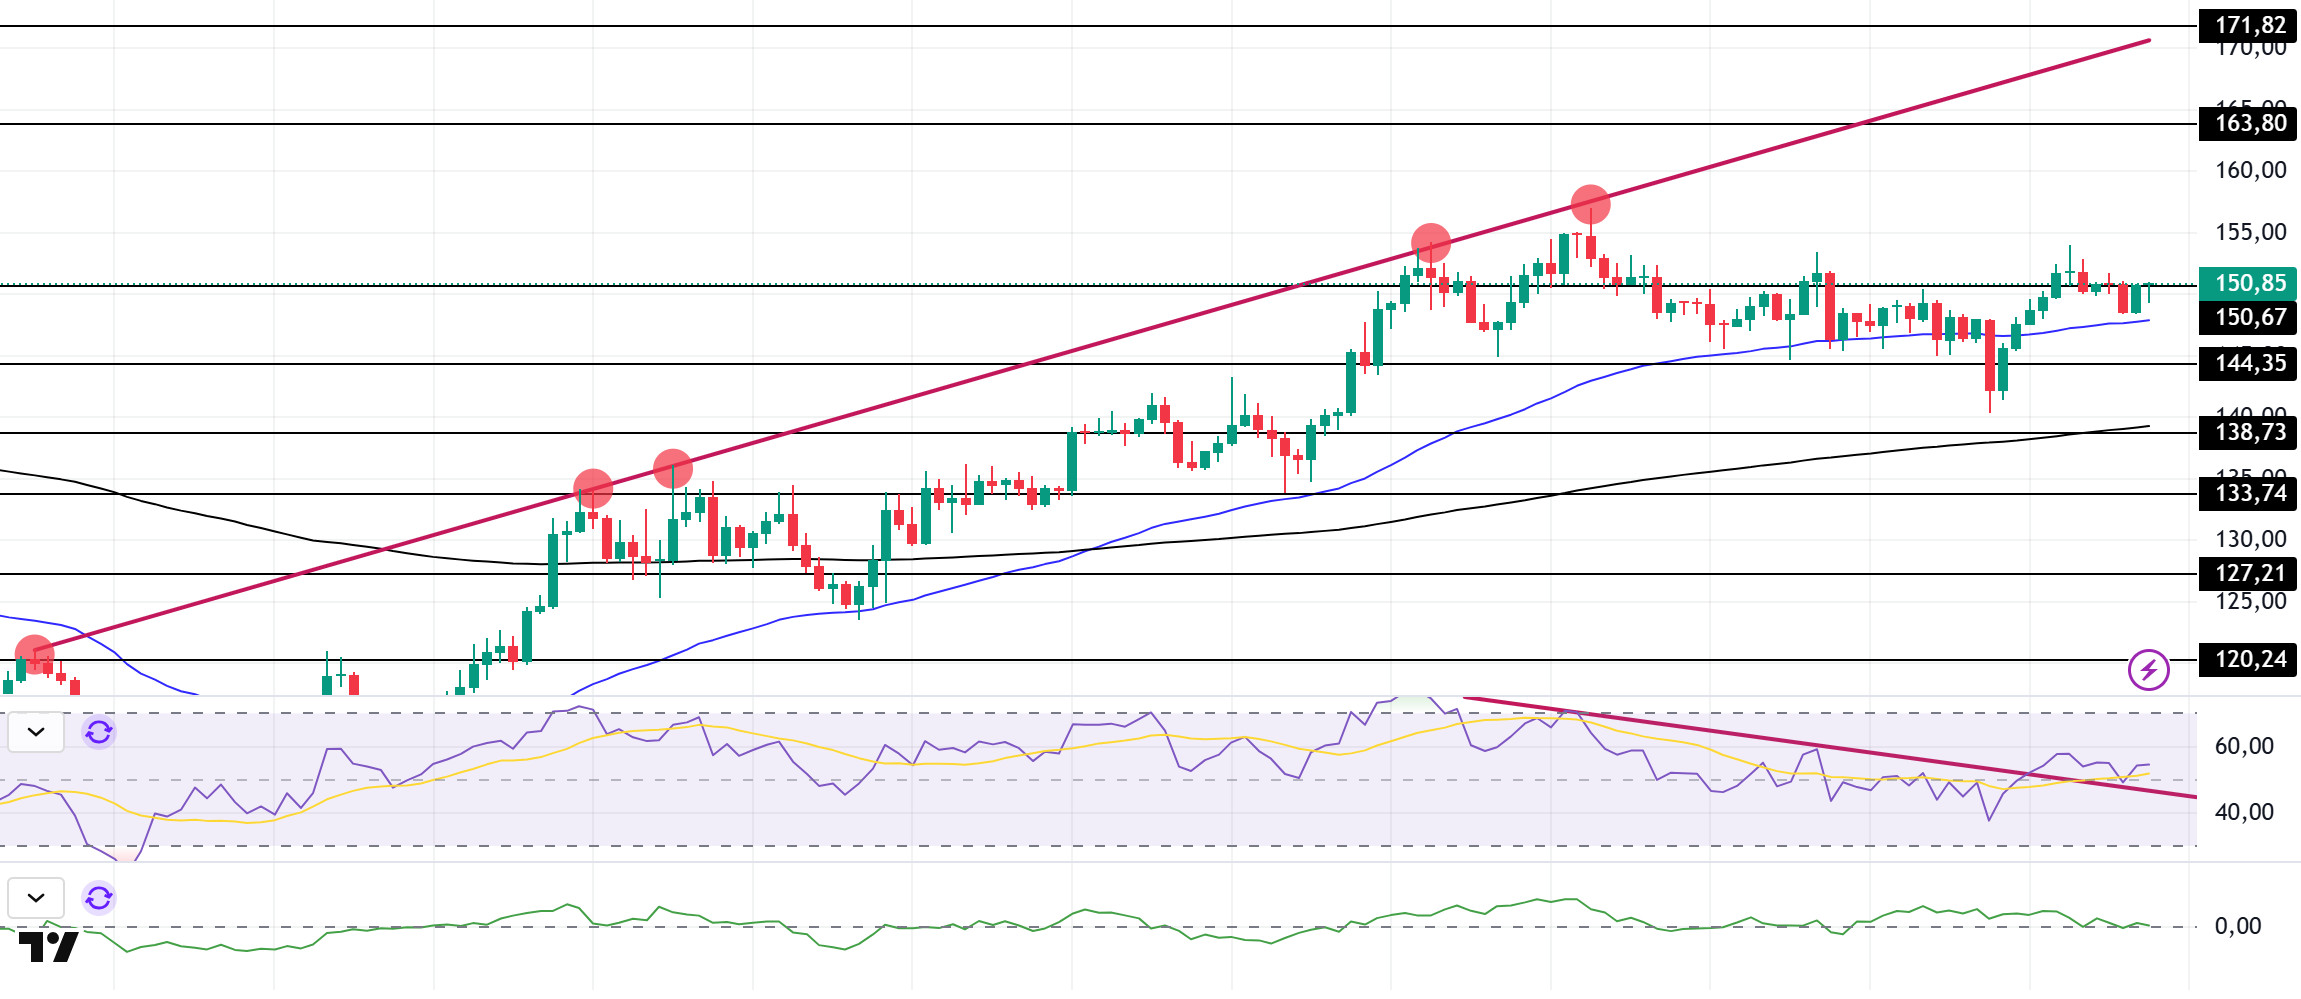
Classover Holdings, Inc. announced on May 1 its plan to sell up to $400 million of equity to Solana Strategies Holdings LLC and integrate Solana (SOL) tokens into its reserves. Meanwhile, Janover DeFi Development Corp announced on May 1 a $24 million PIPE investment to develop its Solana holdings.
SOL price was slightly bullish during the day. The asset continues to trade below the resistance level of the ascending line that started on April 6. As of now, the price manages to stay above the 50 EMA (Blue Line) and tests the $150.67 level, which is a strong resistance. On the 4-hour chart, the 50 EMA (Blue Line) remains above the 200 EMA (Black Line). This suggests that the uptrend may continue in the medium term. In addition, the fact that the price remains above both moving averages suggests that buying pressure continues across the market. Chaikin Money Flow (CMF20) remains neutral, but a decline in daily volume may cause CMF to move into negative territory. Relative Strength Index (RSI14) has broken the downtrend that started on April 23 to the upside. However, selling pressure continues. This caused it to test the downtrend support and accelerated upwards from there. The $163.80 level stands out as a strong resistance point in case of an uptrend on the back of macroeconomic data or positive news on the Solana ecosystem. If this level is broken upwards, the rise can be expected to continue. If there are pullbacks due to contrary developments or profit realizations, the $138.73 level may be retested. In case of a decline to these support levels, the increase in buying momentum may offer a potential bullish opportunity.
Supports 144.35 – 138.73 – 133.74
Resistances 150.67 – 163.80 – 171.82
DOGE/USDT
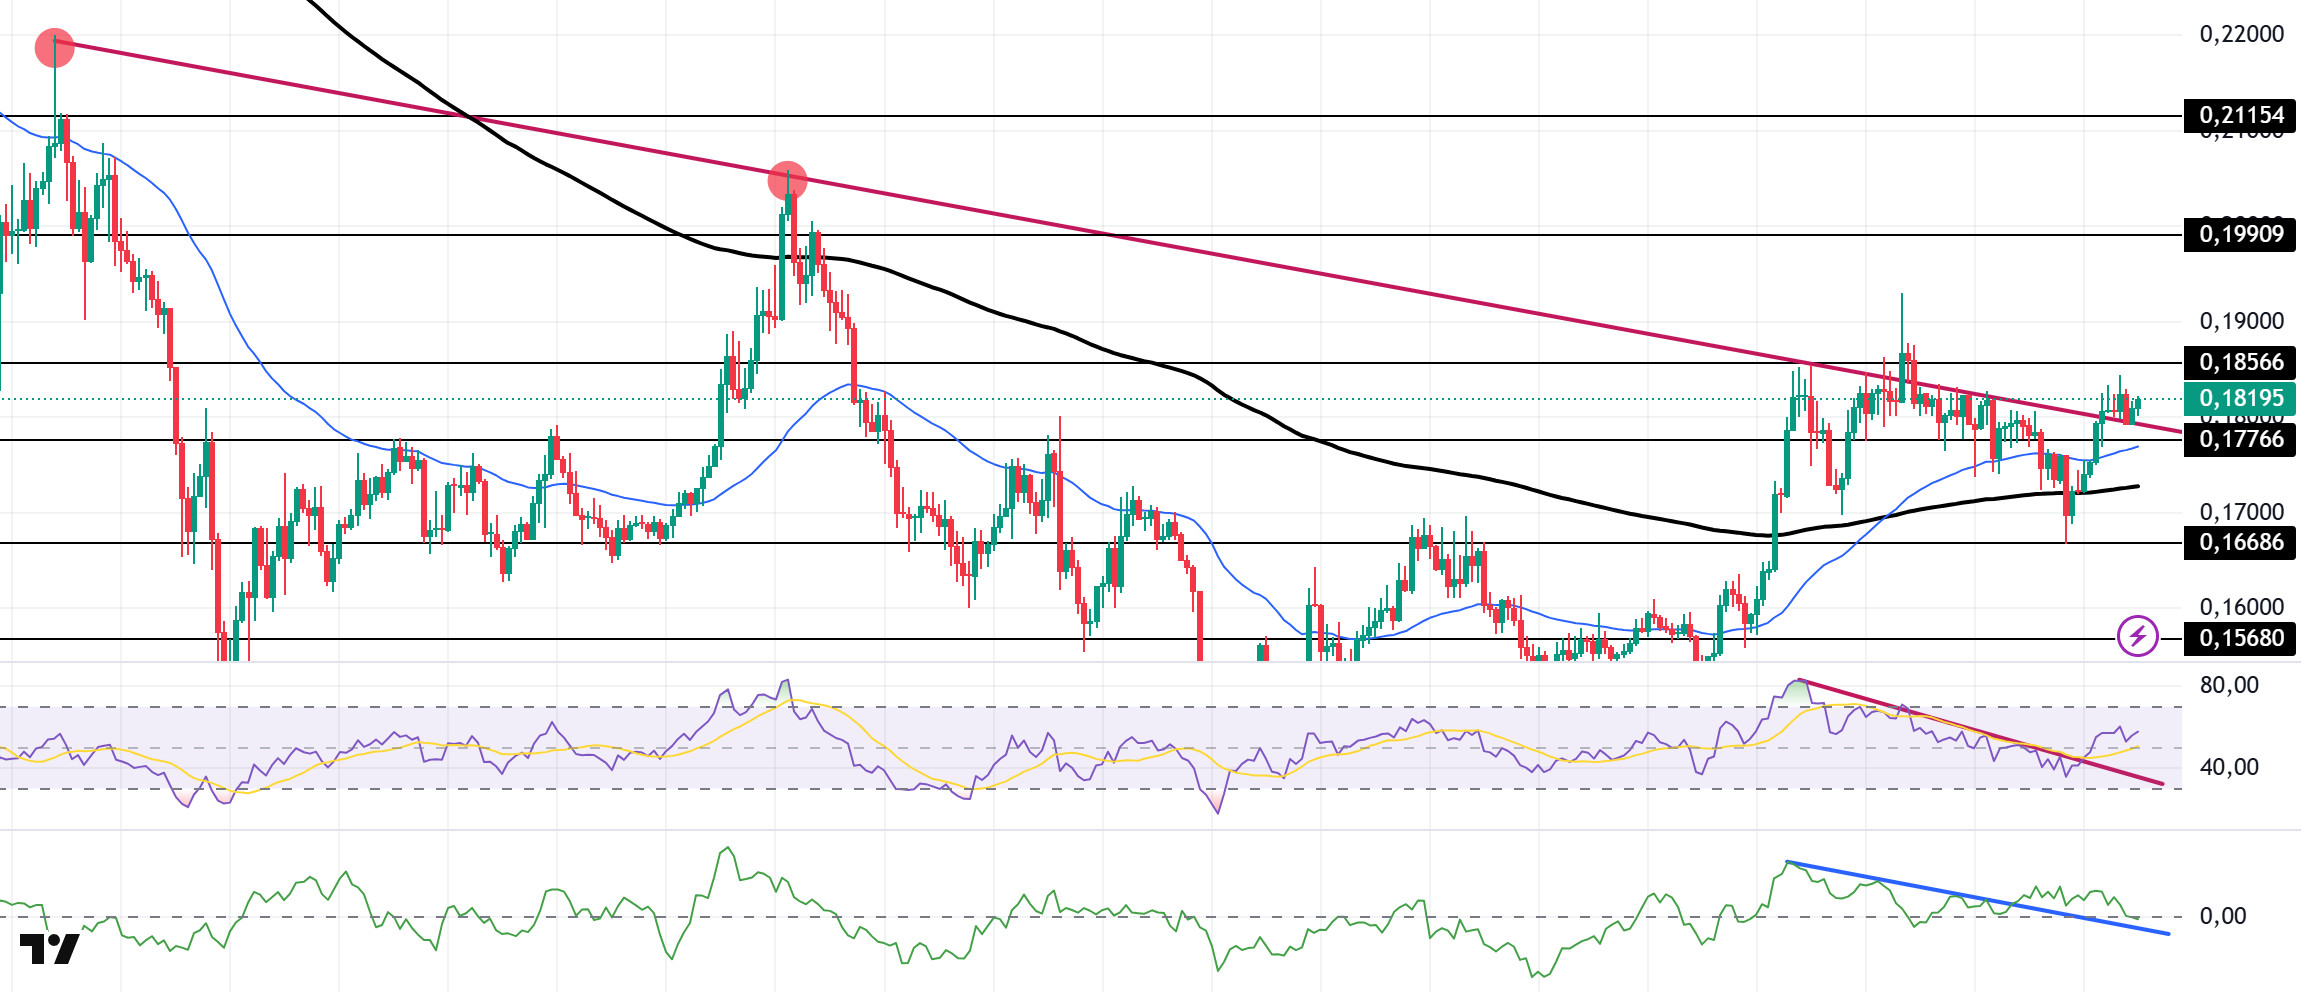
Dogecoin whales have raised 100 million DOGE.
The DOGE price moved sideways during the day. The asset broke the downtrend that started on March 6 and managed to stay above it. As of now, it tested the downtrend as support and rose from there. After this acceleration, the resistance level of $0.18566 can be followed. On the 4-hour chart, the 50 EMA continues to be above the 200 EMA. The fact that the price is above both moving averages indicates that the upward momentum is strong in the medium term. The Chaikin Money Flow (CMF20) indicator crossed into negative territory. At the same time, the decline in money inflows may move CMF deeper into the negative zone and test the downtrend that started on April 22 as support. Relative Strength Index (RSI14), on the other hand, remained in positive territory. It also remains above the downtrend that started on April 23. This suggests that the uptrend will strengthen. The $0.19909 level stands out as a strong resistance zone in the case of possible rises in line with political developments, macroeconomic data or positive news flow in the DOGE ecosystem. In the opposite case or possible negative news flow, the $0.16686 level may be retested. In case of a decline to these levels, the increase in momentum may start a new bullish wave.
Supports 0.17766 – 0.16686 – 0.15680
Resistances 0.18566 – 0.19909 – 0.21154
Legal Notice
The investment information, comments and recommendations contained herein do not constitute investment advice. Investment advisory services are provided individually by authorized institutions taking into account the risk and return preferences of individuals. The comments and recommendations contained herein are of a general nature. These recommendations may not be suitable for your financial situation and risk and return preferences. Therefore, making an investment decision based solely on the information contained herein may not produce results in line with your expectations.

