
TECHNICAL ANALYSIS
BTC/USDT
US President Trump emphasized the importance of global leadership in digital asset innovation, while emphasizing that crypto assets remained stronger than the stock market during the recent market crash. These statements are supported by institutional investment rhetoric towards Bitcoin, especially in the election atmosphere in South Korea. Deribit data shows that the market has optimistic expectations for the end of June; $300,000 BTC call options have reached remarkable levels. Today, eyes will be on BTC buying data from Stategy, which publishes Tracker.
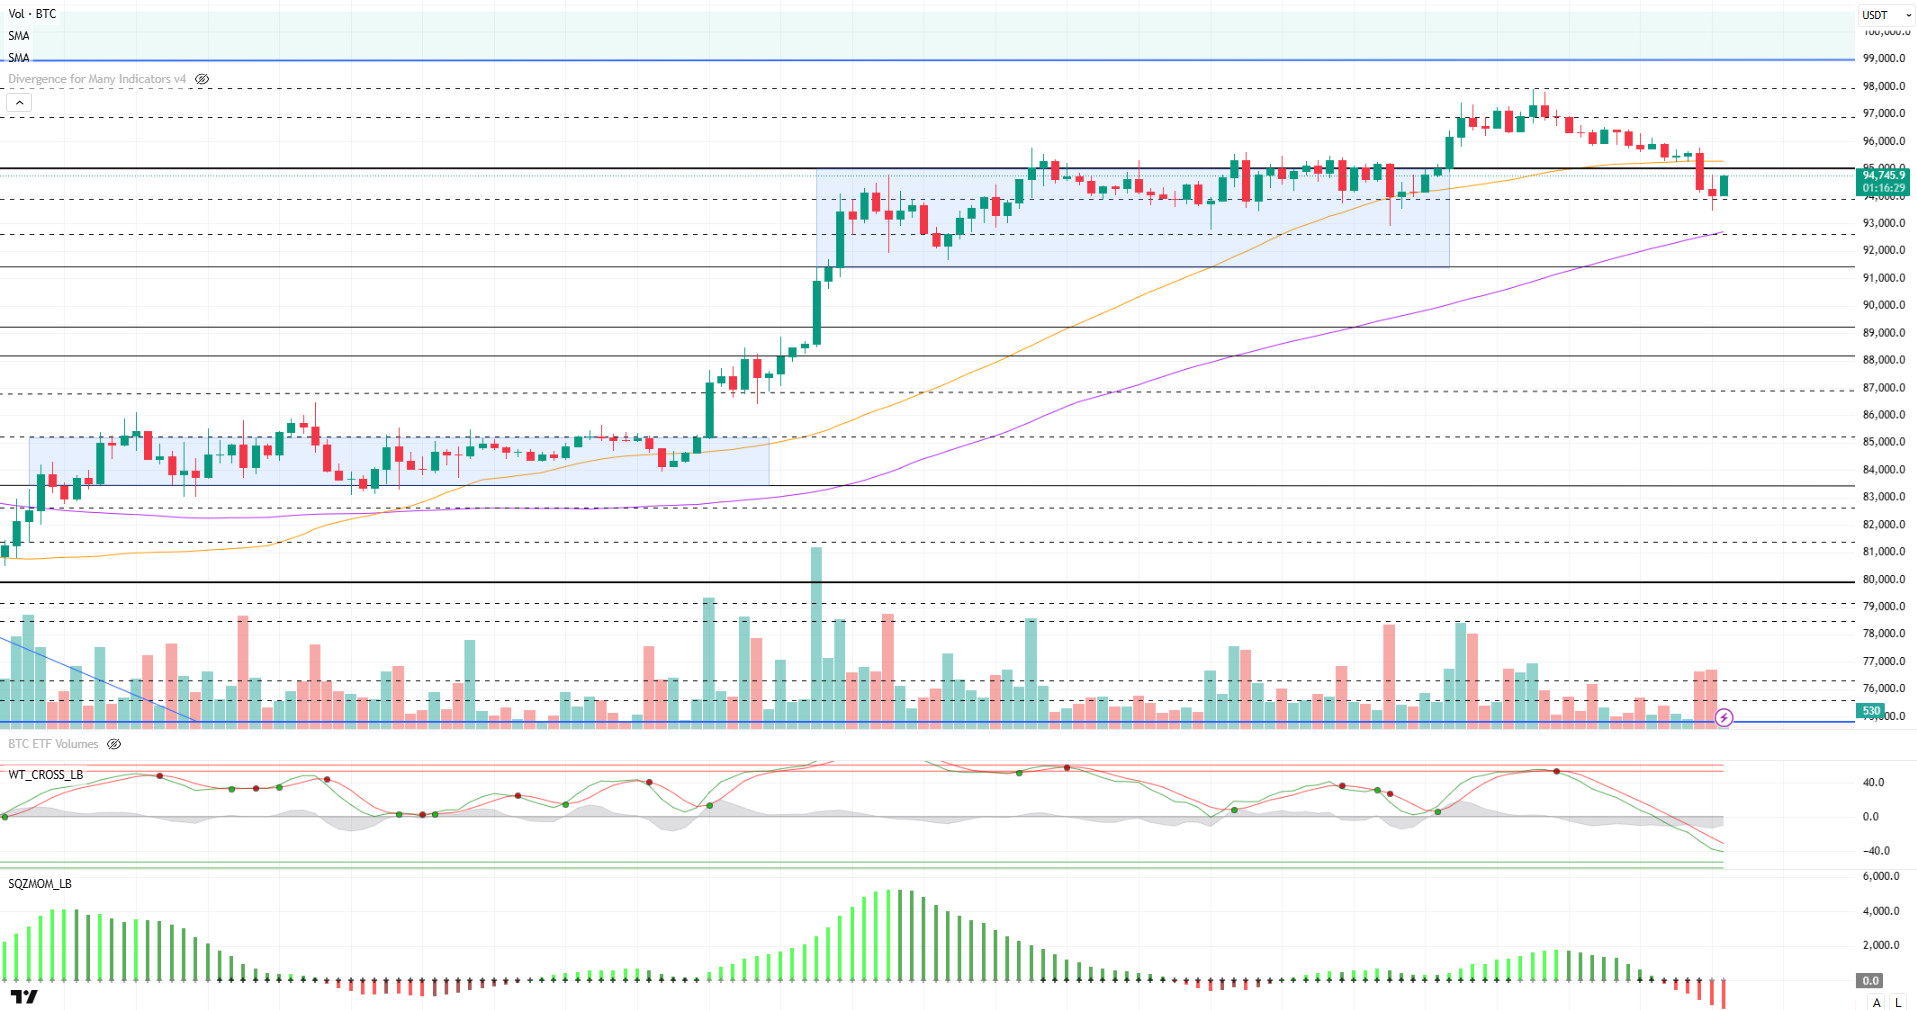
Looking at the technical outlook, BTC, which consolidated in a narrow band range last week, made an upward breakout from this region and tested the 98,000 level. However, as technical oscillators hit the overbought zone, the price entered a correction and retreated to 93,600. BTC, which managed to recover after this decline, is moving towards the 95,000 level again as of the time of writing. With this correction, it is noteworthy that while some long positions have been liquidated, there is still a limited increase in short transactions. Technically, the wave trend oscillator coming to the oversold zone supports the possibility of the price moving upwards again with the buy signal coming during the day. However, the weak momentum indicators suggest that the price needs a new fundamental catalyst to reach six-digit levels. In this context, the interest rate decisions to be announced during the week and the messages regarding the US economy are among the most important factors that will determine the medium-term direction of BTC. If the technical structure is ready to rebound, BTC could test above 98,000 and head towards the 100,000 level with the support of fundamental developments. Otherwise, a new correction towards the 94,000 – 92,800 support band may be inevitable.
Supports 94,000 – 92,800 – 91,400
Resistances 95,000 – 97,000 – 98,000
ETH/USDT
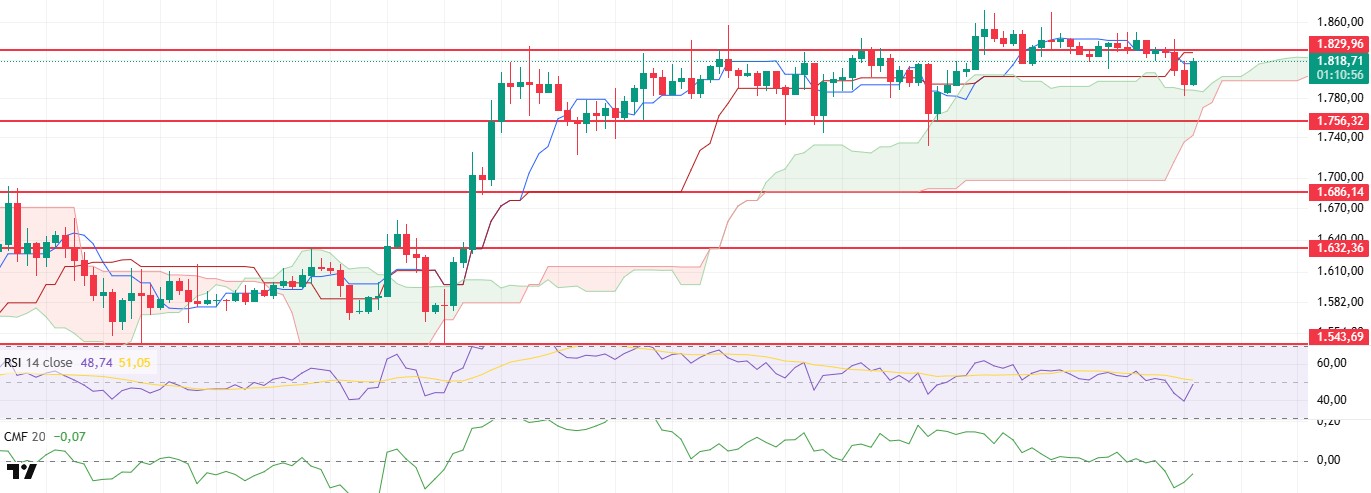
ETH moved sideways in a narrow band over the weekend, breaking the $1,829 level downwards on Sunday with weaknesses in technical indicators and falling to the upper band of the kumo cloud. The price, which recovered with the reaction from this region, broke above the tenkan level again and overcame a short-term resistance.
The Ichimoku indicator shows a classic sell signal as the tenkan level crosses the kijun level to the downside. However, the fact that the price is still above the kumo cloud suggests that this signal does not yet indicate a confirmed strong downtrend. Although prices hovering above the cloud level allow the overall structure to remain positive, this crossover should be carefully monitored, as the bearish signal may gain strength if the price dips below the cloud. The Chaikin Money Flow (CMF) indicator fell into negative territory with the decline in prices, indicating that liquidity flow to the market has weakened. However, the slight recovery observed in this indicator indicates that buyers have re-engaged, albeit limited. The fact that CMF is still in negative territory reflects that the bearish pressure has not fully ended and the market structure remains fragile. On the momentum side, the price seems to be trying to recover after the recent decline. Relative Strength Index (RSI) rose as high as the based MA. Although this rise signals an improvement in momentum in the short term, it is not enough for the start of a strong uptrend.
In summary, although technical indicators signal a recovery in the short term, the overall structure is still weak. In this context, the $1,829 level is likely to work as resistance during the day and downward pressure is likely to increase if the price is rejected from this level. In such a scenario, a break of the $1,789 level, the upper band of the kumo cloud, could pave the way for a deeper correction. On the other hand, a close above $1,829 could invalidate the negative technical outlook and set the stage for the start of a new uptrend
Top of Form
Below the Form
Supports 1,756 – 1,686 – 1,632
Resistances 1,829 – 1,925 – 2,131
XRP/USDT
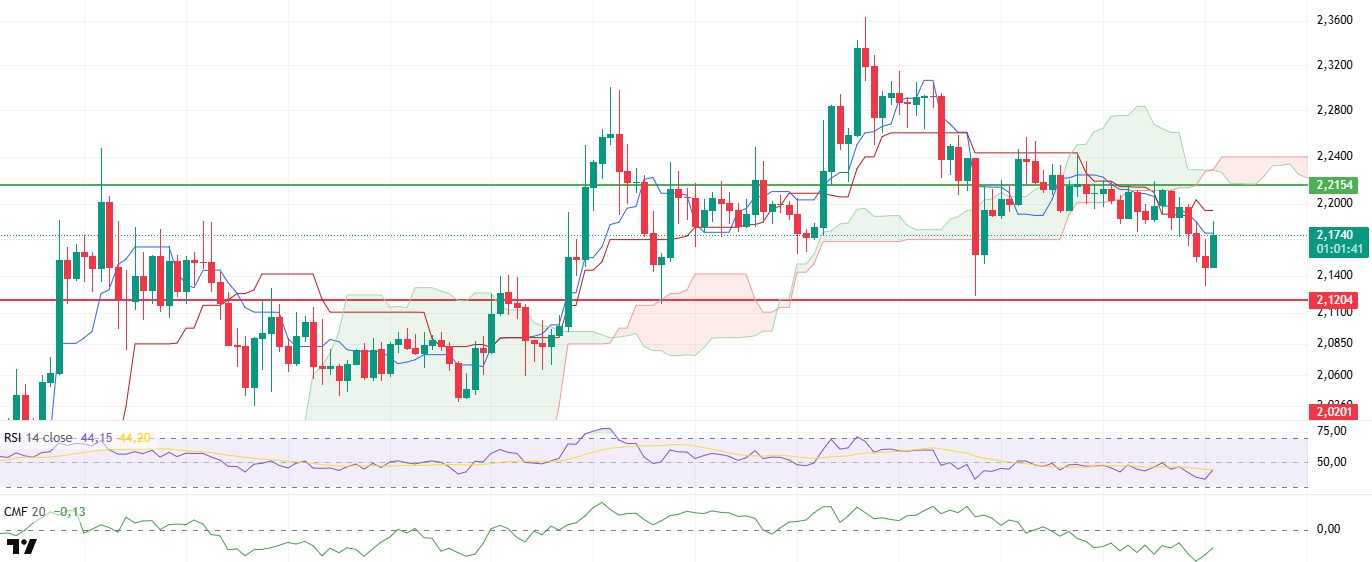
XRP was in an effort to regain the $2.21 level over the weekend. However, it struggled to break through this resistance zone and with intense selling pressure, it turned downward and fell to around $2.12. With the slight recovery observed in the last candle, the price rose to the tenkan level and is currently trying to hold in this region. This short-term rise can be considered as a limited recovery in the current weak structure.
Looking at the technical indicators, Chaikin Money Flow (CMF) is still in negative territory. Although there has been a limited recovery in the indicator with the effect of the recent rise, it can be said that the overall negative structure continues. This indicates that market liquidity has not improved significantly and buyers are still not active strongly enough. The Ichimoku indicator shows a more pronounced weakness. The price continues to price below both tenkan and kijun levels after dipping below the kumo cloud. While this structure indicates that the bearish technical outlook continues, especially the downward crossing of the tenkan level to the kijun level plays an important role in confirming this negative structure. This intersection shows that the weak momentum continues in the short and medium term and selling pressure is still effective.
In line with this outlook, if the XRP price fails to break the zone between the kijun resistance at $2.19 and the main resistance at $2.21 during the day, selling pressure can be expected to increase again. In this scenario, the $2.12 level should be followed as the first important support point. A downward breach of this level may cause the downward movement to continue more sharply and the price to turn towards lower supports. On the other hand, a breakout and close above the $2.21 level could invalidate the current negative technical structure and set the stage for the start of a new uptrend
Supports 2.1204 – 2.0201 – 1.8932
Resistances 2.2154 – 2.3938 – 2.4721
SOL/USDT
Pump.fun sends $16 million SOL to Kraken. Solana validators patch zero-day bug that could lead to unlimited minting of certain tokens
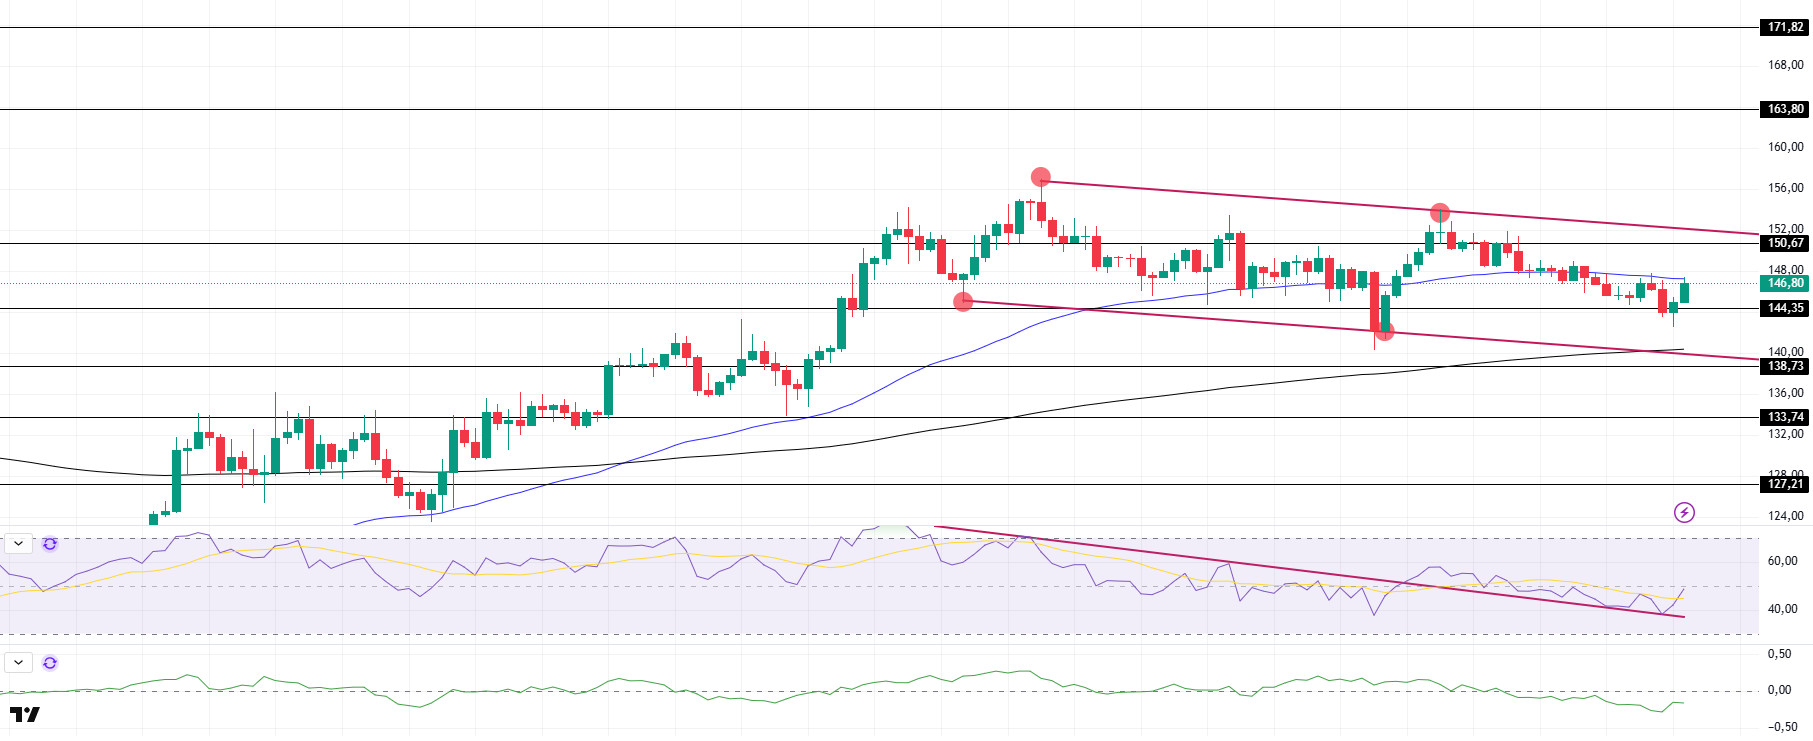
SOL price continues its sideways trend. The asset remains in the middle levels of the downtrend that started on April 25. The price accelerated after testing the strong support at $144.35 and is currently testing the 50 EMA (Blue Line) as a resistance. On the 4-hour chart, the 50 EMA (Blue Line) remains above the 200 EMA (Black Line). This suggests that the uptrend may continue in the medium term. However, the fact that the price is between both moving averages suggests that the overall market is in the decision phase. Chaikin Money Flow (CMF20) remains negative, but a rise in daily volume may cause CMF to move into positive territory. Relative Strength Index (RSI14), on the other hand, broke the downtrend that started on April 23rd to the upside and turned it into a support and accelerated from there, allowing the price to rise to the neutral zone. The $163.80 level stands out as a strong resistance point in the event of a rally on the back of macroeconomic data or positive news on the Solana ecosystem. If this level is broken upwards, the rise can be expected to continue. If there are pullbacks due to contrary developments or profit realizations, the $138.73 level may be retested. In case of a decline to these support levels, the increase in buying momentum may offer a potential bullish opportunity.
Supports 144.35 – 138.73 – 133.74
Resistances 150.67 – 163.80 – 171.82
DOGE/USDT
Seth Wilks and Raj Mukherjee, two key cryptocurrency policy leaders of the US Internal Revenue Service (IRS), have resigned after accepting “DOGE Deferred Exit Agreements” offered by the government.
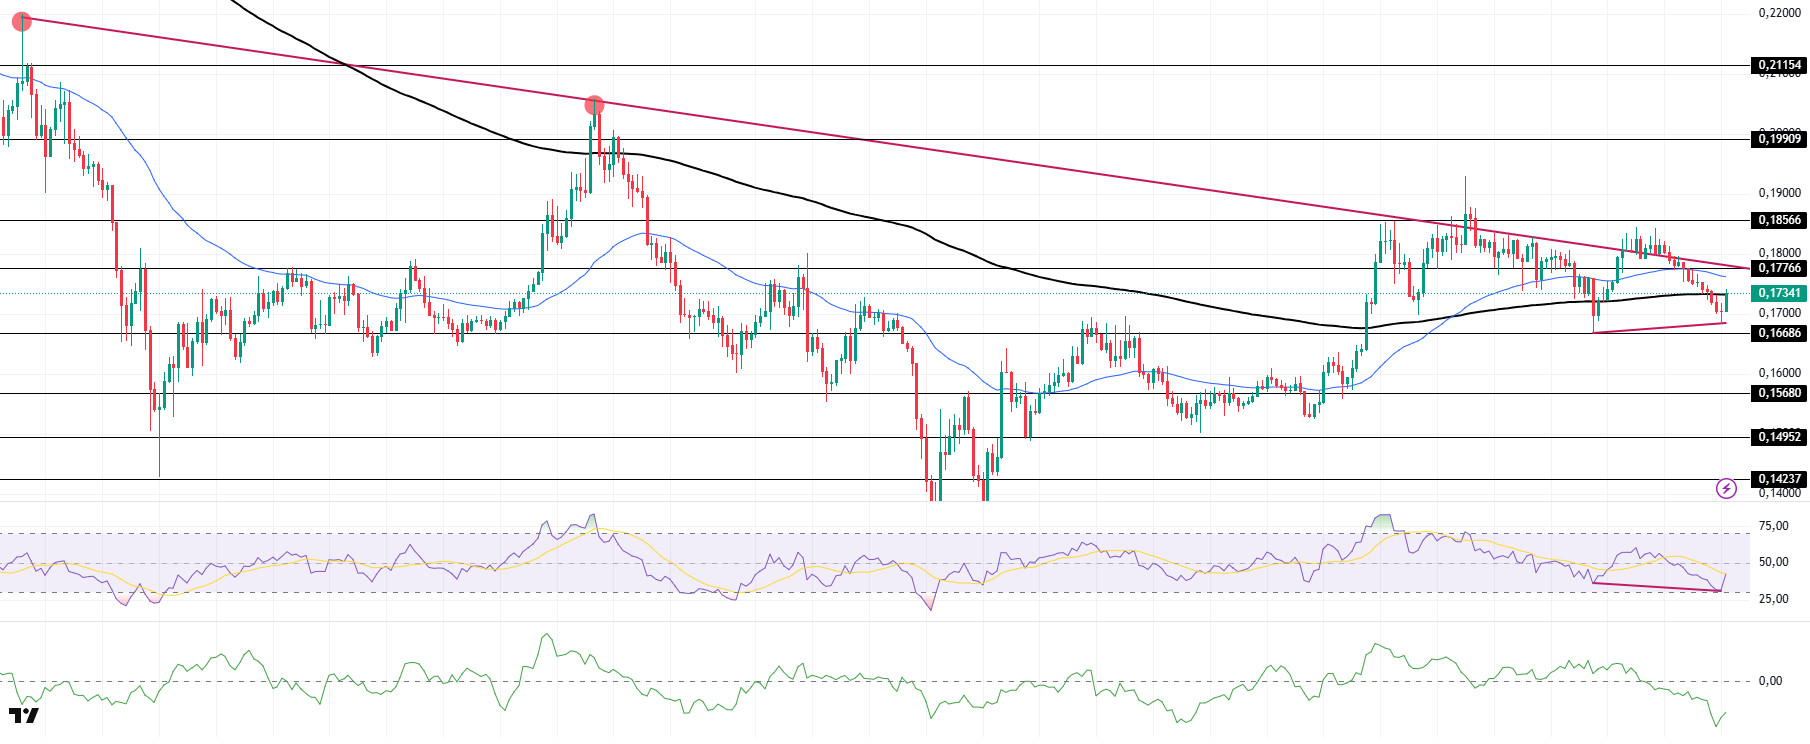
The DOGE price continued to move in a narrow band. The asset broke the downtrend that started on March 6 but failed to break it and fell back below it. Currently, the slightly bullish asset is testing the 200 EMA as resistance. After this acceleration, the resistance level of $0.18566 can be followed. On the 4-hour chart, the 50 EMA continues to be above the 200 EMA. The fact that the price is below both moving averages indicates that the downward momentum is strong in the medium term. The Chaikin Money Flow (CMF20) indicator is in the extreme negative territory. At the same time, an increase in money outflows may move CMF deeper into the negative zone. Relative Strength Index (RSI14), on the other hand, accelerated from the oversold territory, slightly increased and is at the mid-level of the negative zone. Also, bullish divergence should be monitored. The $0.18566 level stands out as a strong resistance zone in case of a possible rise in line with political developments, macroeconomic data or positive news flow in the DOGE ecosystem. In the opposite case or possible negative news flow, the $0.16686 level may be retested. In case of a decline to these levels, the increase in momentum may start a new bullish wave.
Supports 0.16686 – 0.15680 – 0.14952
Resistances 0.17766 – 0.18566 – 0.19909
Legal Notice
The investment information, comments and recommendations contained herein do not constitute investment advice. Investment advisory services are provided individually by authorized institutions taking into account the risk and return preferences of individuals. The comments and recommendations contained herein are of a general nature. These recommendations may not be suitable for your financial situation and risk and return preferences. Therefore, making an investment decision based solely on the information contained herein may not produce results in line with your expectations.
