
TECHNICAL ANALYSIS
BTC/USDT
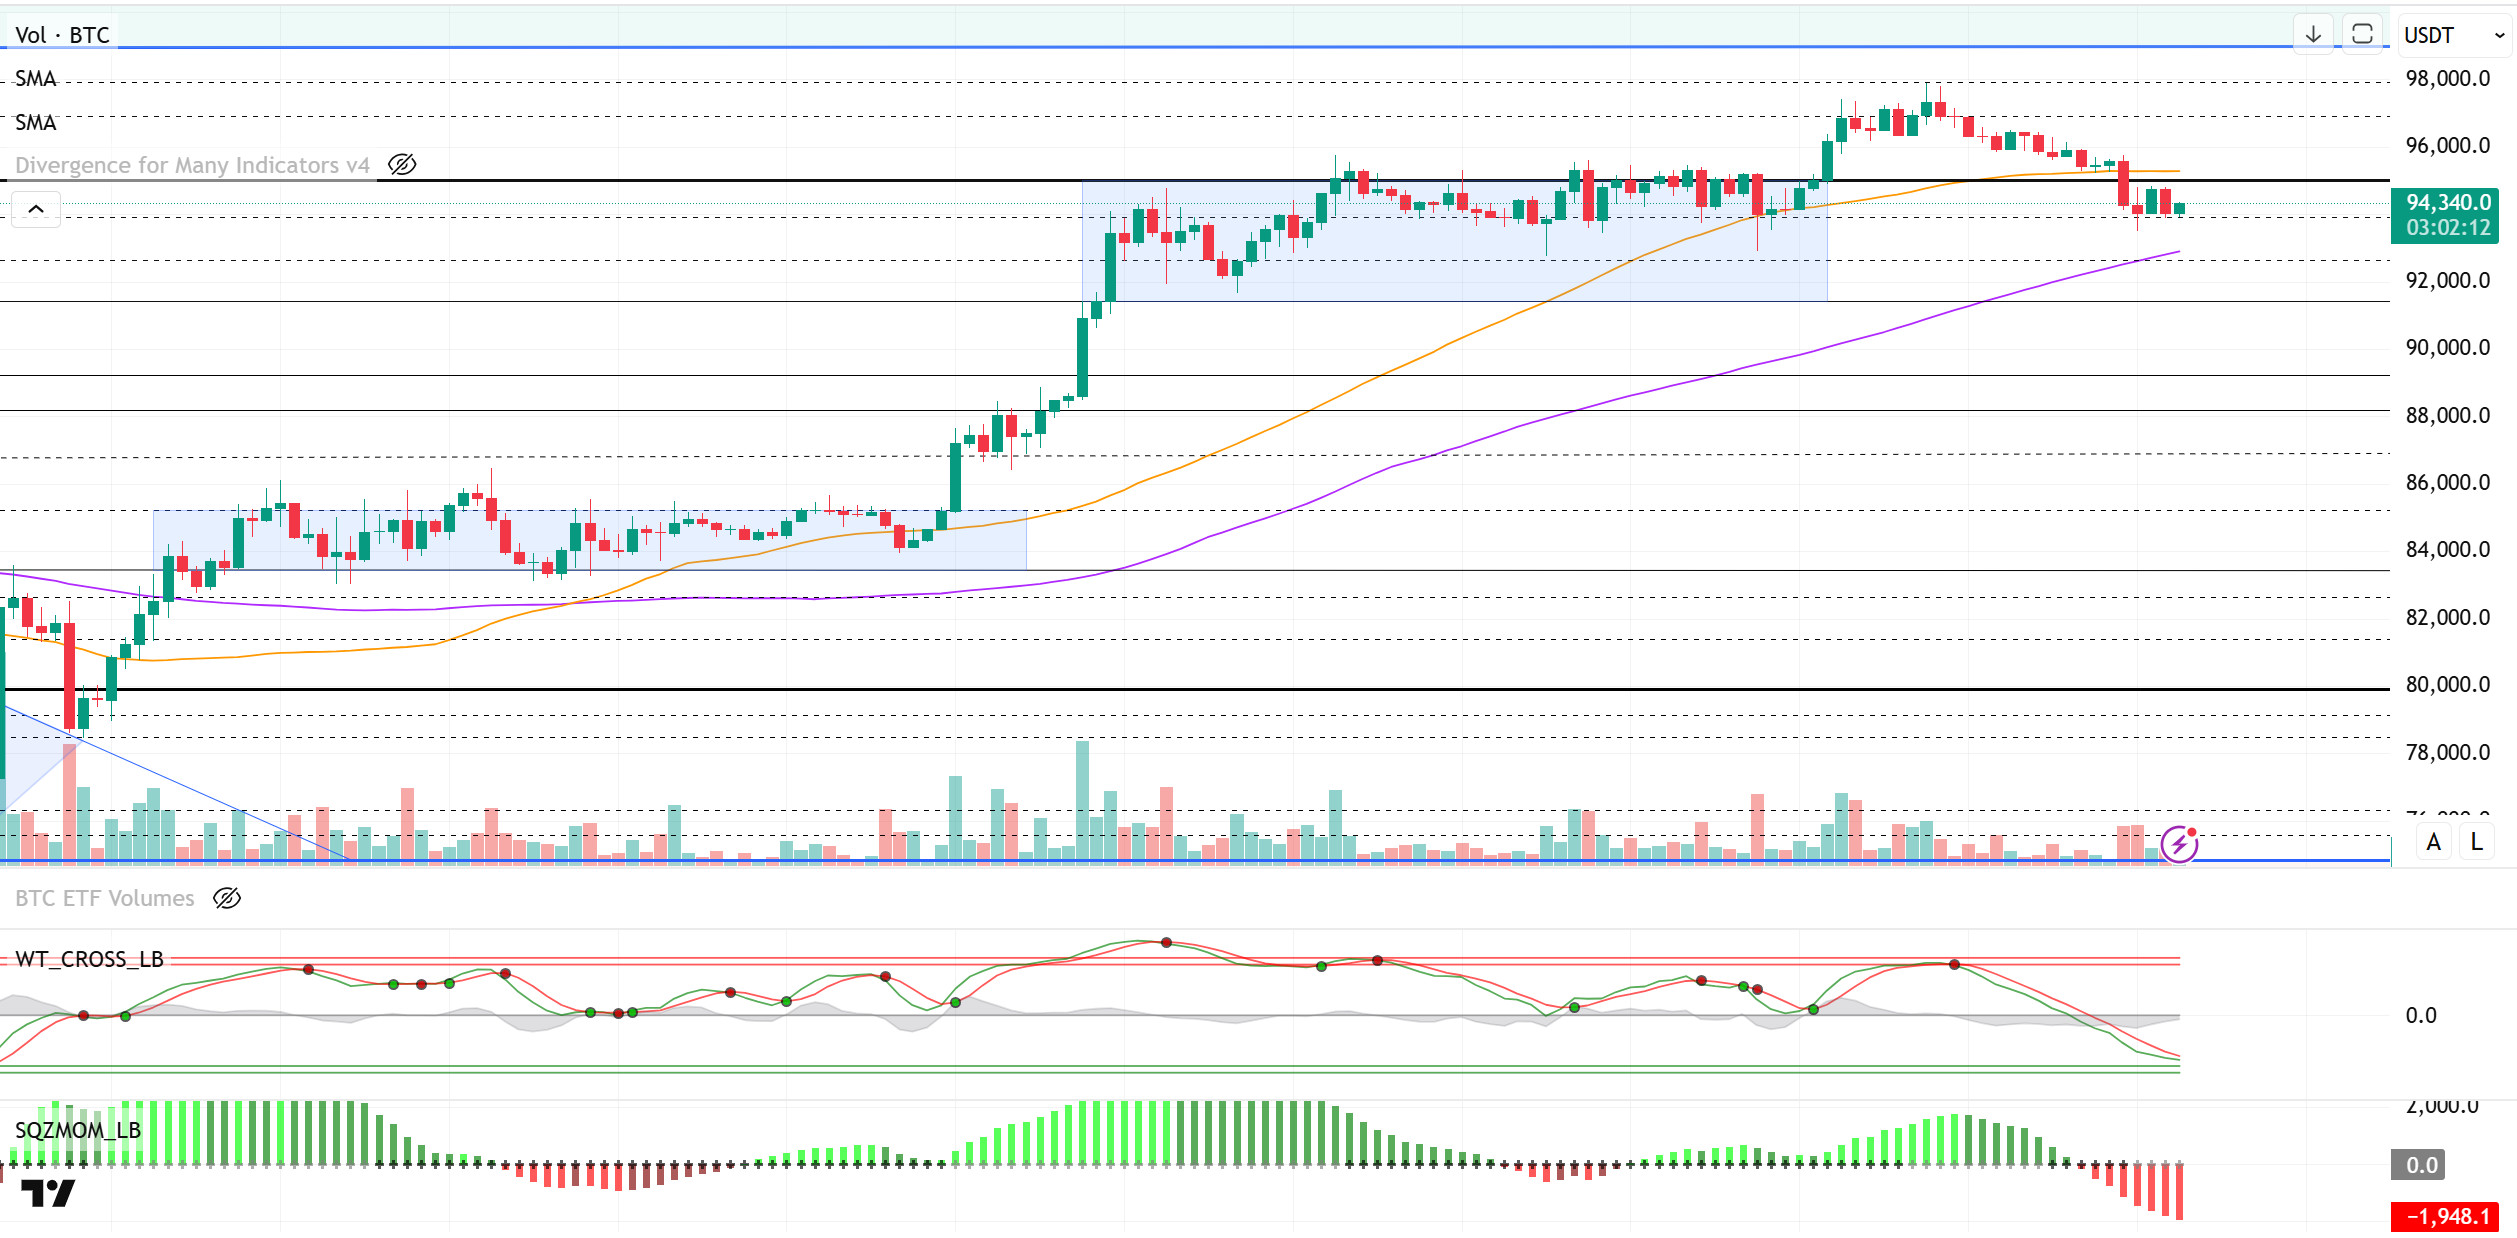
Institutional interest in Bitcoin continues unabated. Strategy reported last week that it increased its holdings by buying 1,895 BTC with $180.3 million, bringing the average price per BTC to $95,167. Semler Scientific also bought another 167 BTC, bringing its total holdings to 3,634 BTC. Meanwhile, the news that tech giant Nvidia is considering adding Bitcoin to its balance sheet has caused excitement in the market, but no official statement has yet been made on the subject.
Looking at the technical outlook, there is no significant change in BTC’s technical structure compared to the previous analysis. It is noteworthy that the price is stuck back to the 94,000-95,000 levels, the band range in which it has moved for a long time before. This sideways movement suggests that the market is looking for a new catalyst and that there is not yet enough momentum for an upward move to begin. On the technical indicators, BTC is currently priced between the 50 and 100-day moving averages (SMAs), while the wave trend oscillator is preparing to generate a buy signal near the oversold area. However, a negative US futures market could weigh on the price in the short term, causing a pullback to the 92,800 levels where the SMA 100 line crosses. This level, as mentioned earlier, stands out as the area where buy orders are concentrated and is followed as technical support where reaction buying is expected in a possible decline. As a matter of fact, the bearish scenario continues to gain weight with closures below 95,000. On the other hand, crossing the 95,000 level, which we take as a reference level, and hourly closures above it can be expected to gain momentum for the rise again.
Supports 94,000 – 92,800 – 91,400
Resistances 95,000 – 97,000 – 98,000
ETH/USDT
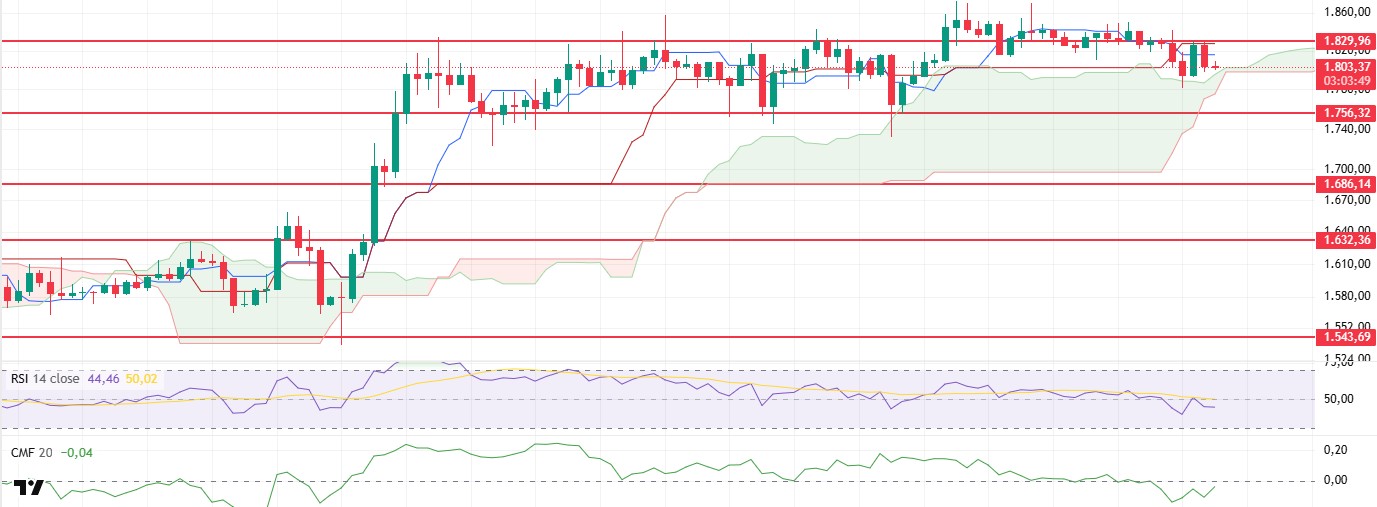
ETH reached the resistance point at $1,829 during the day, in line with technical expectations, and then experienced a slight pullback from this region, facing selling pressure. This pullback caused the price to approach the kumo cloud support level again.
Although the Chaikin Money Flow (CMF) indicator remains in negative territory, it is showing a slight recovery trend within the horizontal channel. This indicates that liquidity inflows to the market have started, albeit limited, but the overall structure is still weak. This fragile liquidity flow may cause the price to fail to find stable support in bullish attempts. This situation stands out as a factor that questions the sustainability of bullish movements. On the Ichimoku indicator, the negative intersection between the Tenkan and Kijun levels is still generating an active sell signal. Although this intersection is generally accepted as one of the leading signals of trend changes, we are talking about a structure where this signal has not gained confirmation as the price is still moving in the kumo cloud. Pricing within the cloud indicates that the market is directionally indecisive, and a clear upside or downside break of the cloud is required for a clear trend formation.
Looking at the current position of price movements, it is assessed that the downward pressure after the rejection from the $1,829 level may increase further in the evening hours and as a result, there is a high probability that the kumo cloud will be breached downwards. If this scenario materializes and the price slips below the cloud, a pullback to the first major support level of $1,756 is likely. Testing this level would be an important test both technically and in terms of investor psychology. In the opposite scenario, ETH’s ability to rise above the $1,829 level and persist above this region may invalidate the current negative technical structure. In such a case, there will be strong signals that the short-term downtrend has ended, and a new uptrend has begun.
Supports 1,756 – 1,686 – 1,632
Resistances 1,829 – 1,925 – 2,131
XRP/USDT
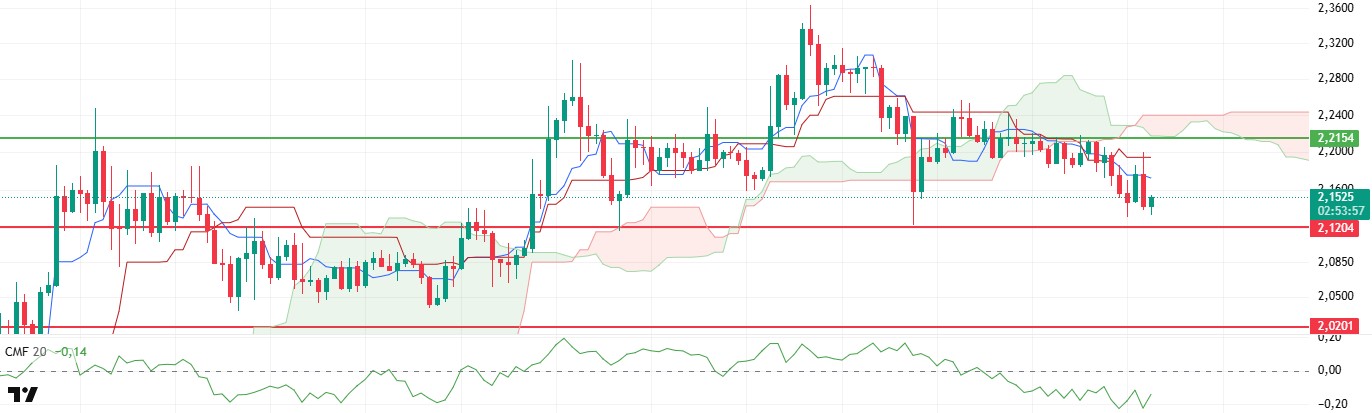
Although XRP managed to rise up to the Kijun resistance at $2.19 during the day, it faced selling pressure from this level and turned down again and retreated to the support zone around $2.12. While the price’s reaction from this level remains quite limited, especially the weakness in trading volume and the loss of strength in technical indicators indicate that bearish risks are increasing. This short-term price action suggests that XRP has failed to hold on to a strong area of resistance and the market is currently unable to support any upside momentum.
The Chaikin Money Flow (CMF) indicator continues to display a horizontal outlook in the negative territory. This structure indicates that the net liquidity entering the market remains limited and there is no strong demand for purchases. CMF, which has been persisting in the negative zone for a long time, points to the lack of strong capital inflows behind the price increases, questioning the sustainability of the current bullish attempts. Looking at the Ichimoku indicator, the price is moving below both Tenkan and Kijun levels. The price is also below the kumo cloud, confirming that the market is currently bearish in technical terms. This structure clearly reveals that the price is not in search of direction, but the current direction is down. The fact that the price continues to remain under the cloud, especially on the Ichimoku indicator, shows that the technical downtrend is dominant and that this trend is likely to continue unless there is a positive breakout in the short term. The price retracement to the $2.12 level suggests that a critical support zone has been reached. A daily close below this level or persistence on an hourly basis could accelerate the downward momentum and set the stage for the price to decline towards lower support levels in the short term. On the other hand, XRP first needs to exceed the $2.19-2.21 band with volume in order for the possibility of a rebound to arise. Persistence above this region will both show that the negative structure is over in technical terms and can be interpreted as the beginning of a new upward trend.
Supports 2.1204 – 2.0201 – 1.8932
Resistances 2.2154 – 2.3938 – 2.4721
SOL/USDT
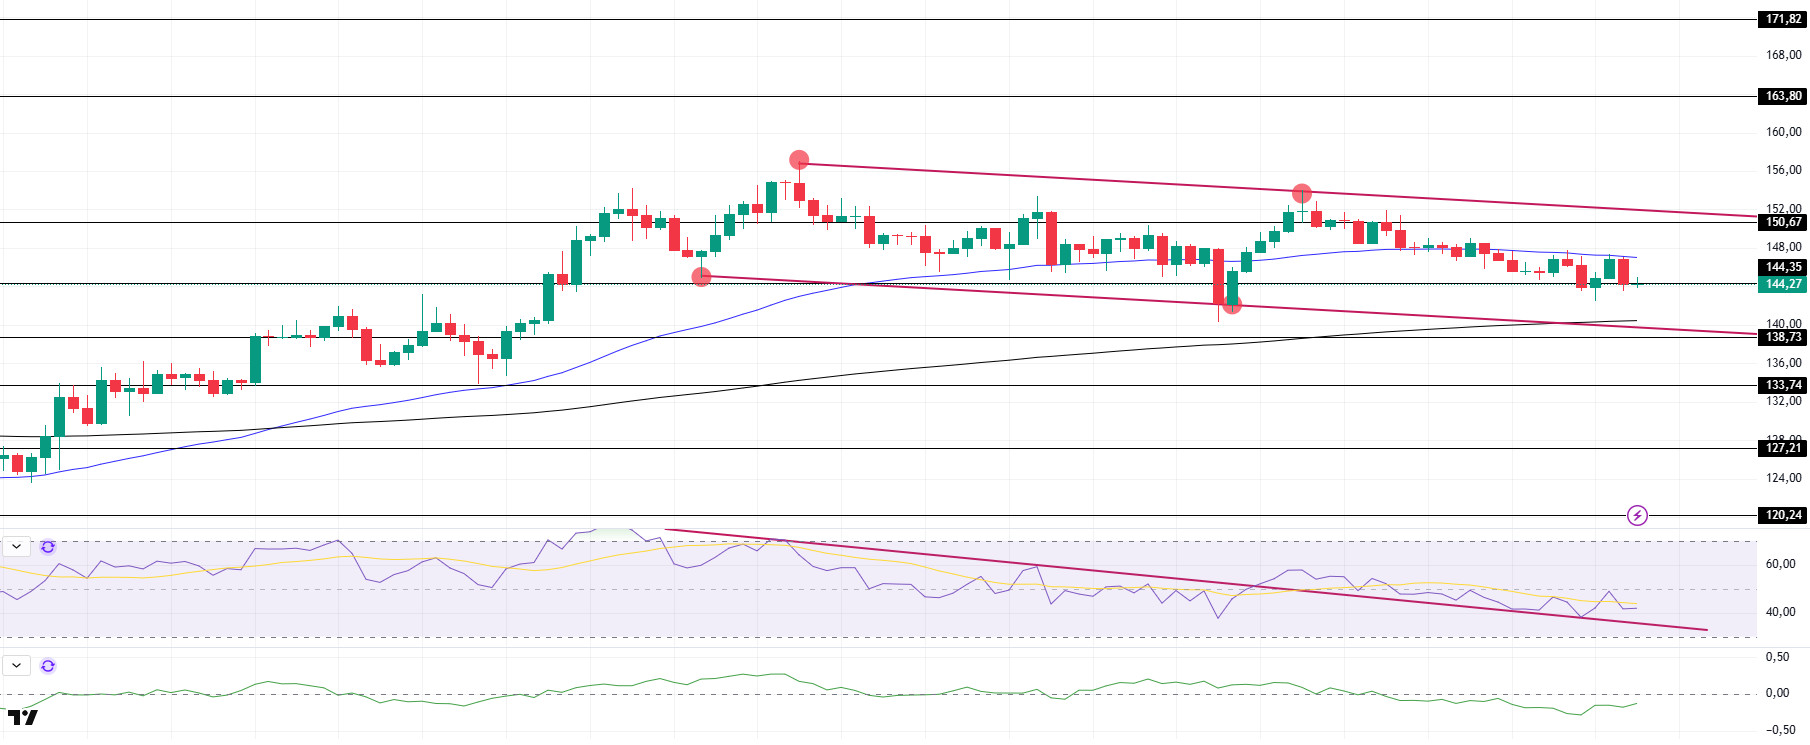
SOL price continued its sideways movements during the day. The asset remains in the middle levels of the downtrend that started on April 25. The price is currently retesting the strong support at $144.35. On the 4-hour chart, the 50 EMA (Blue Line) remained above the 200 EMA (Black Line). This suggests that the bullish trend may continue in the medium term. However, the fact that the price is between both moving averages suggests that the overall market is in the decision phase. Chaikin Money Flow (CMF20) remains negative, but an increase in daily inflows may cause CMF to move into positive territory. Relative Strength Index (RSI14), on the other hand, broke the downtrend that started on April 23rd to the upside and turned this trend into a support and accelerated from there, allowing the price to rise to the neutral zone, but selling pressure continues. The $163.80 level stands out as a strong resistance point in the event of a rally on the back of macroeconomic data or positive news on the Solana ecosystem. If this level is broken upwards, the rise can be expected to continue. If there are pullbacks due to contrary developments or profit realizations, the $ 138.73 level may be retested. In case of a decline to these support levels, the increase in buying momentum may offer a potential bullish opportunity.
Supports 144.35 – 138.73 – 133.74
Resistances 150.67 – 163.80 – 171.82
DOGE/USDT
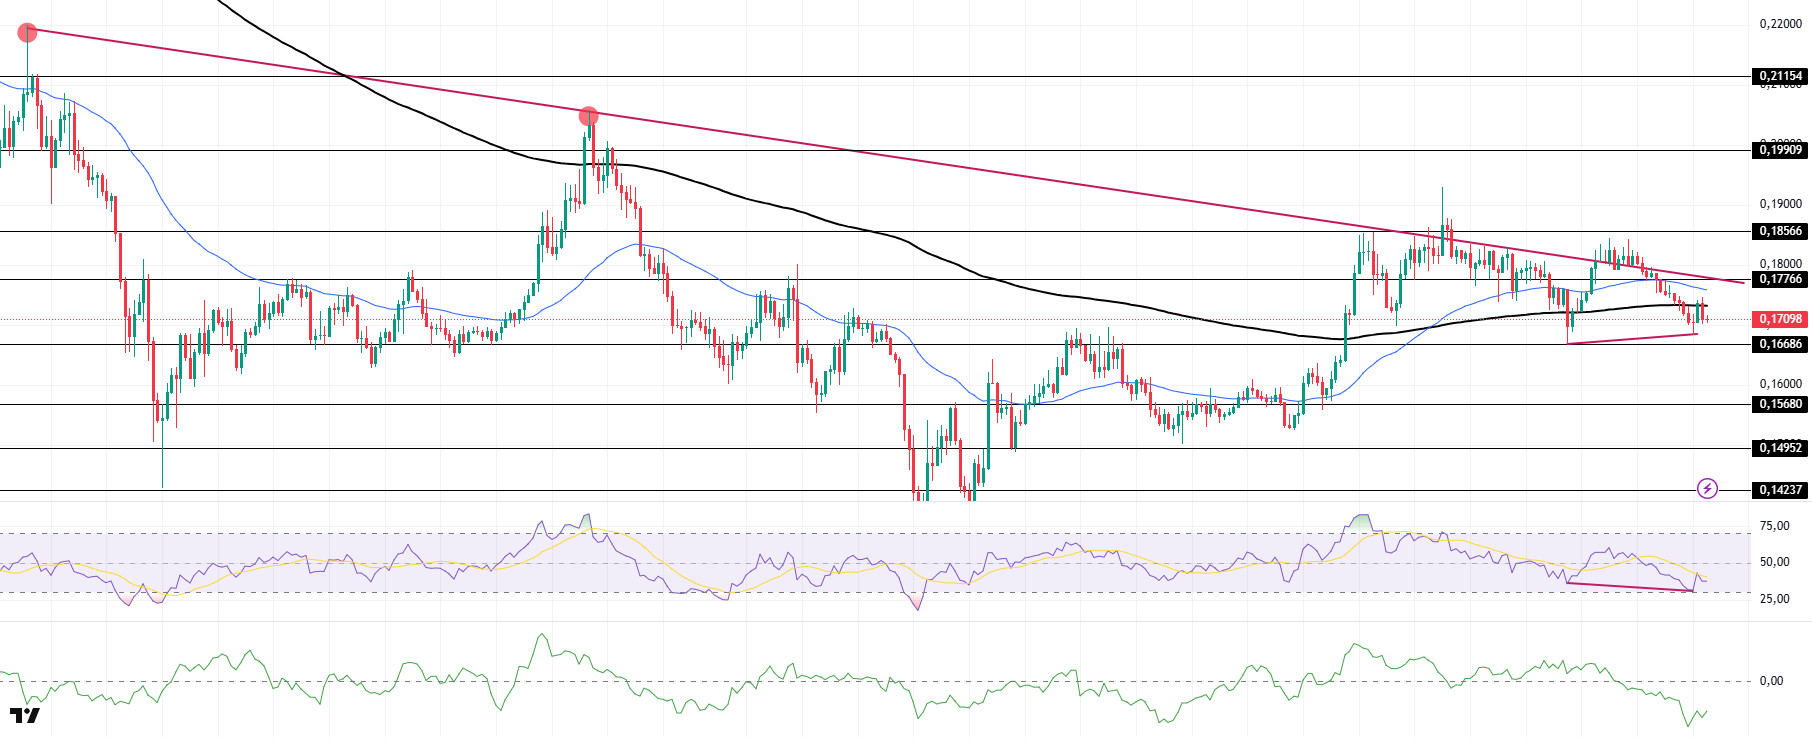
The DOGE price continued its sideways trend during the day. The asset failed to break the downtrend that started on March 6 and fell back below it. The asset, which tested the 200 EMA (Black Line) as resistance, has currently retreated from here. On the 4-hour chart, the 50 EMA (Blue Line) remains above the 200 EMA (Black Line). The fact that the price is below both moving averages indicates that the downward momentum is strong in the medium term. The Chaikin Money Flow (CMF20) indicator is in the extreme negative territory. At the same time, an increase in money outflows may move CMF deeper into the negative zone. Relative Strength Index (RSI14), on the other hand, accelerated from the oversold territory, slightly increased and is at the mid-level of the negative zone. Also, bullish divergence should be monitored. The $0.18566 level stands out as a strong resistance zone in case of a possible rise in line with political developments, macroeconomic data or positive news flow in the DOGE ecosystem. In the opposite case or possible negative news flow, the $0.16686 level may be retested. In case of a decline to these levels, the increase in momentum may start a new bullish wave.
Supports 0.16686 – 0.15680 – 0.14952
Resistances 0.17766 – 0.18566 – 0.19909
Legal Notice
The investment information, comments and recommendations contained herein do not constitute investment advice. Investment advisory services are provided individually by authorized institutions taking into account the risk and return preferences of individuals. The comments and recommendations contained herein are of a general nature. These recommendations may not be suitable for your financial situation and risk and return preferences. Therefore, making an investment decision based solely on the information contained herein may not produce results in line with your expectations.
