
TECHNICAL ANALYSIS
BTC/USDT
The US Senate’s vote on the GENIUS Stablecoin Act represents an important threshold for crypto regulation. With consumer protection and national security in mind, this legislation could provide long-awaited legal clarity for digital assets. On the other hand, as Trump’s 5% tax bill on remittances advances in Congress, it may make cryptocurrencies more preferred for cross-border transactions. Bond yields in Japan hit a 20-year high, raising concerns about long-term borrowing costs in global financial markets. On the Bitcoin front, the negative correlation with gold may be another factor that may cause BTC to decouple positively in the coming days and move the ATH levels up.
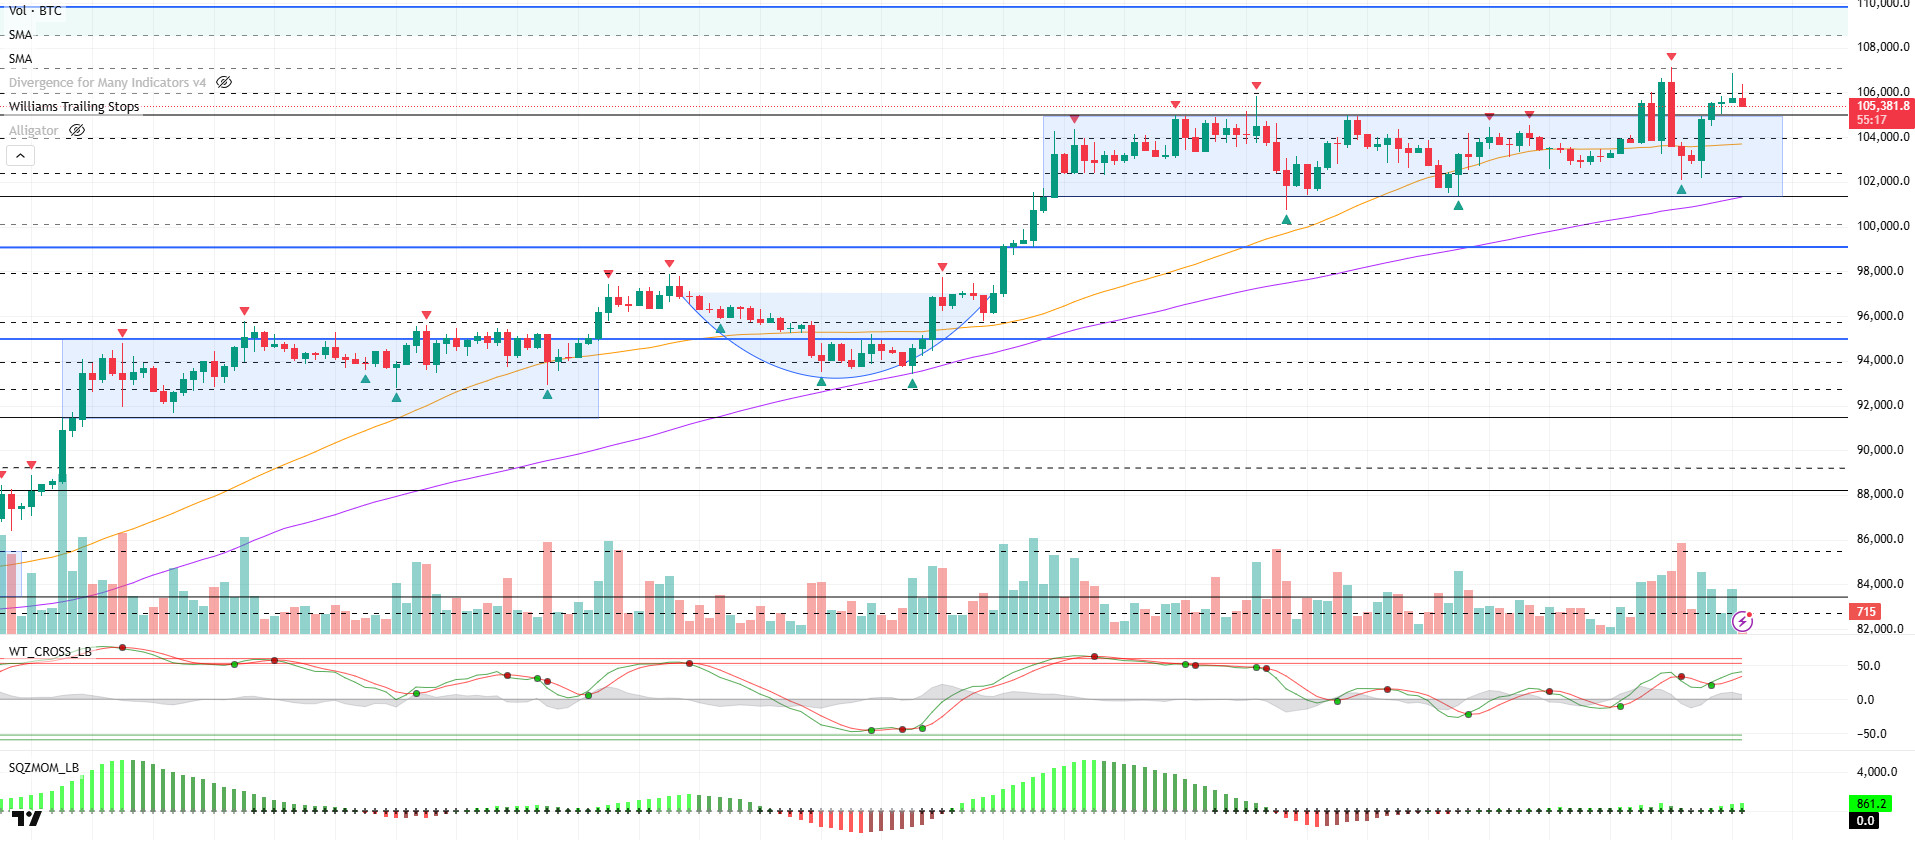
When we look at the technical outlook with the latest developments, it is seen that BTC regained momentum as the sell signal was replaced by a buy signal in the previous analysis. The price, which retreated to 102,350 support after testing the 107,000 level, recovered quickly with the support it received from this level and reached 106,000 levels again. With rising volatility, BTC managed to break through the 105,000 resistance after consolidating in a horizontal band range for a long time. For BTC, which has formed a double top in its price, new peak attempts may be possible with daily closes above 105,000. The fact that previous consolidation periods were followed by hard breakouts and did not repeat the same cycle this time shows that the market needs a new catalyst. In the technical structure, while the Wave trend oscillator maintains its buy signal, the momentum indicators are starting to regain strength, supporting the bullish scenario, if the 107,000 level is exceeded in volume, the ATH point can be expected to move up once again. When we look at the liquidation data, we see that sales transactions have shifted above the 107,000 level. This shows that this region will be followed as a strong resistance in a possible new bullish move. On the other hand, we will follow the 105,000 level as a support point in a possible correction movement or selling pressure.
Supports 105,000 – 104,200 – 102,350
Resistances 106,000 – 107,000 – 109,400
ETH/USDT
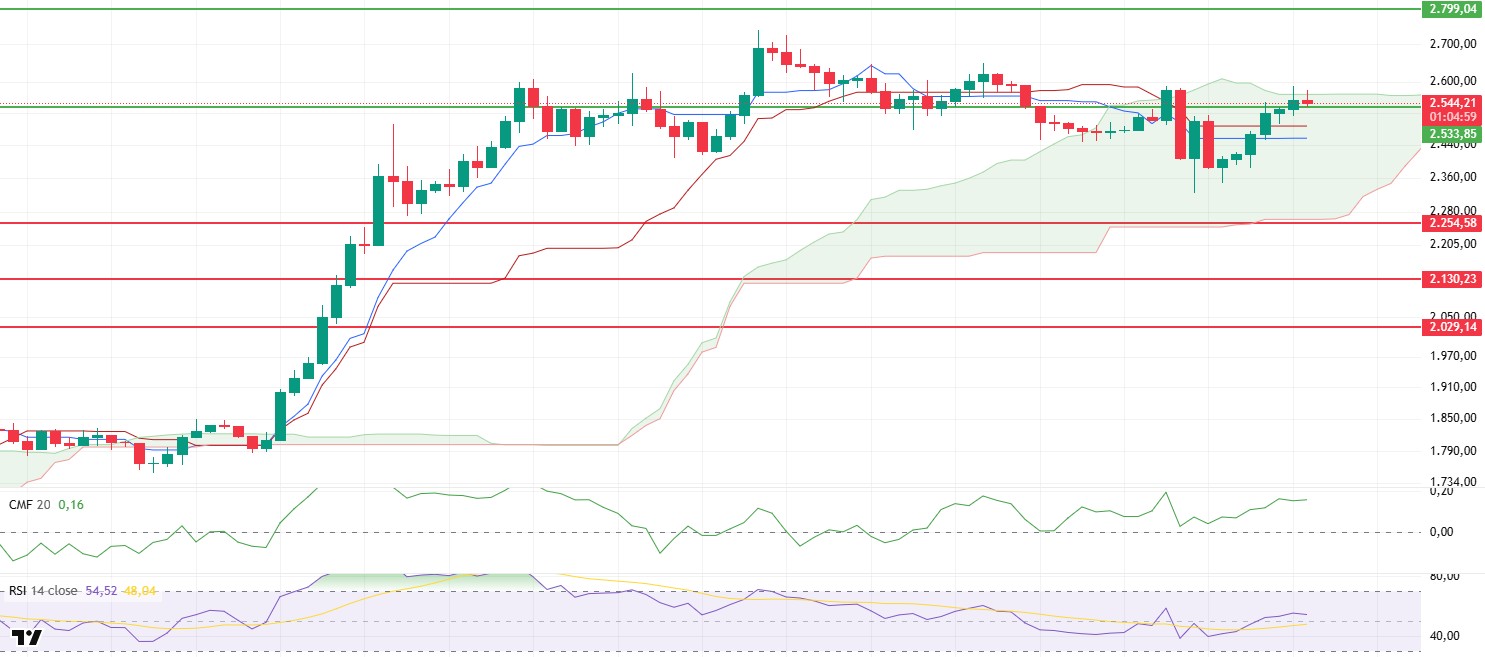
ETH started an upward movement with the strong support it received from the $2,350 level yesterday evening and managed to rise above the $2,533 level. However, it faced selling pressure from the kumo cloud upper band just above this level and was rejected at this point. After this rejection, the price is currently tracing a horizontal course within the kumo cloud of the ichimoku indicator. The consolidation of the price at this level suggests that the market is looking for direction.
When technical and on-chain data are analyzed together, it is seen that the market structure is in a positive trend in the short term. The Chaikin Money Flow (CMF) indicator remains in positive territory and accelerates upwards, indicating that new liquidity inflows to the market continue. This suggests that buyers are still active and capital flows are improving in a positive direction. In addition, the Cumulative Volume Delta (CVD) data shows that the rise was mainly driven by the spot market. This demand from spot markets gives a positive signal that the price movement may be healthier and more permanent, free from manipulation. There is a similar recovery on the momentum side. The positive momentum of the Relative Strength Index (RSI), which rose above the 50 level, reveals that short-term buying pressure is regaining strength. This movement in the RSI supports that the buying appetite among market participants has increased and the upside potential of prices is maintained.
The overall outlook suggests that the price may break through the upper band of the kumo cloud in the short term and continue its upward movement. However, closes below the $2,533 level may weaken the current positive outlook and cause the price to enter a downward correction process again. For this reason, exceeding this resistance level with a voluminous breakout is critical for the healthy continuation of the rise.
Supports 2,533 – 2,254 – 2,029
Resistances 2,799 – 3,062- 3,246
XRP/USDT
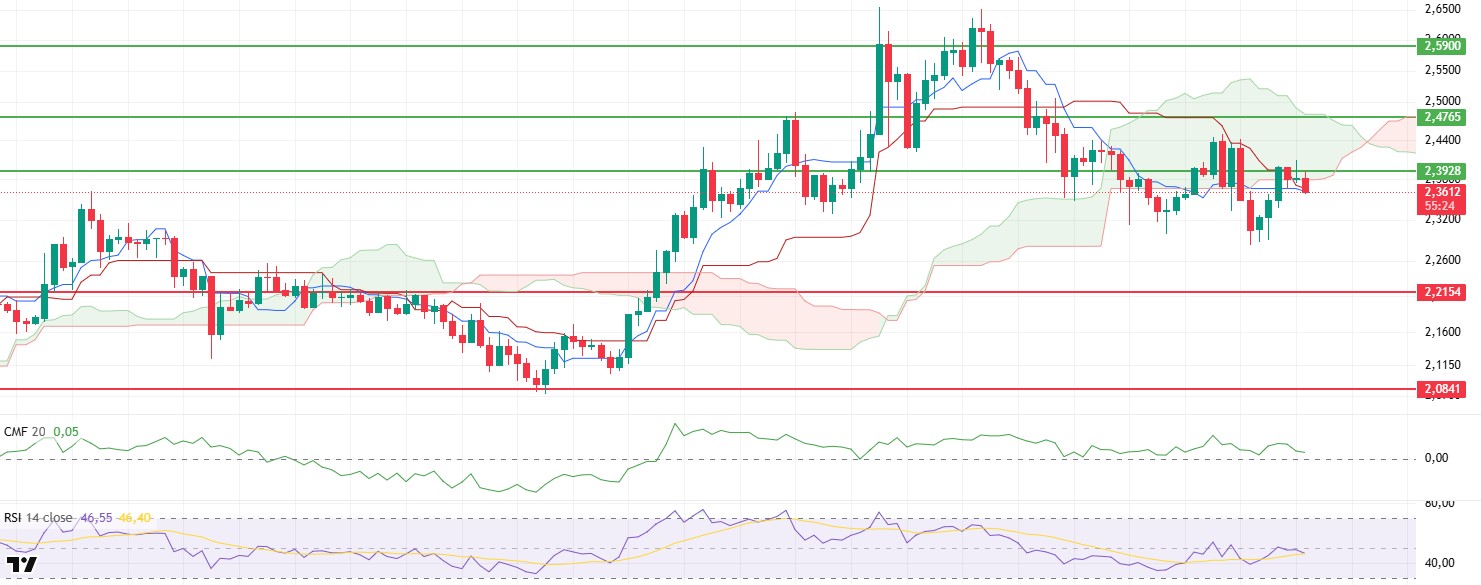
Despite the weak outlook in technical indicators yesterday evening, XRP made an effort to recover in line with the general bullish trend in the crypto market and managed to rise to the critical resistance zone at the $2.39 level. However, the price, which faced increasing selling pressure at this level, was pushed back outside the lower boundary of the kumo cloud of the ichimoku indicator and the current negative technical structure was maintained. This suggests that the upside momentum remains limited in the short term and market participants are turning towards profit realization.
When the on-chain and technical indicators are evaluated together, it is seen that the uptrend has not yet settled into a strong structure for XRP, although it depends on the market in general. The fact that the Chaikin Money Flow (CMF) indicator remains in negative territory and does not accompany the rise indicates that capital outflows from the market continue. This is an important warning that the price action may be unhealthy and that there is no strong buyer base behind the current rise. The Relative Strength Index (RSI) indicator, on the other hand, has gained upward momentum, albeit slightly. Although this indicates the start of a limited recovery in momentum, the RSI is still far from generating a strong bullish signal. This suggests that the market remains indecisive and buyers remain cautious. The most decisive technical signal comes from the ichimoku indicator. The fact that the price is still below the kumo cloud confirms that the negative market structure continues and the price is generally bearish. Pricing below the cloud suggests that XRP is facing strong resistance in the short term and doubts remain about the sustainability of upside moves.
As a result, downward pressure is likely to continue if the price fails to break the lower band of the kumo cloud in the range of $2.38-2.39 on volume during the day. In this case, XRP may test support levels again. On the other hand, a close above the $2.39 level could allow the technical structure to recover and invalidate the short-term negative outlook, setting the stage for an uptrend. However, it should be noted that this scenario requires strong buyer interest and volume support
Supports 2.2154 – 2.0841 – 2.0402
Resistances 2.3928 – 2.4765 – 2.5900
SOL/USDT
The SEC postponed its decision on the Solana ETFs of 21Shares, Bitwise, VanEck, Canary Capital and Fidelity. Anza, a Solana blockchain infrastructure firm spun off from Solana Labs, has proposed a new proof-of-stake consensus called Alpenglow, which it claims will be “the biggest change to Solana’s core protocol” and will compete with existing internet infrastructure.
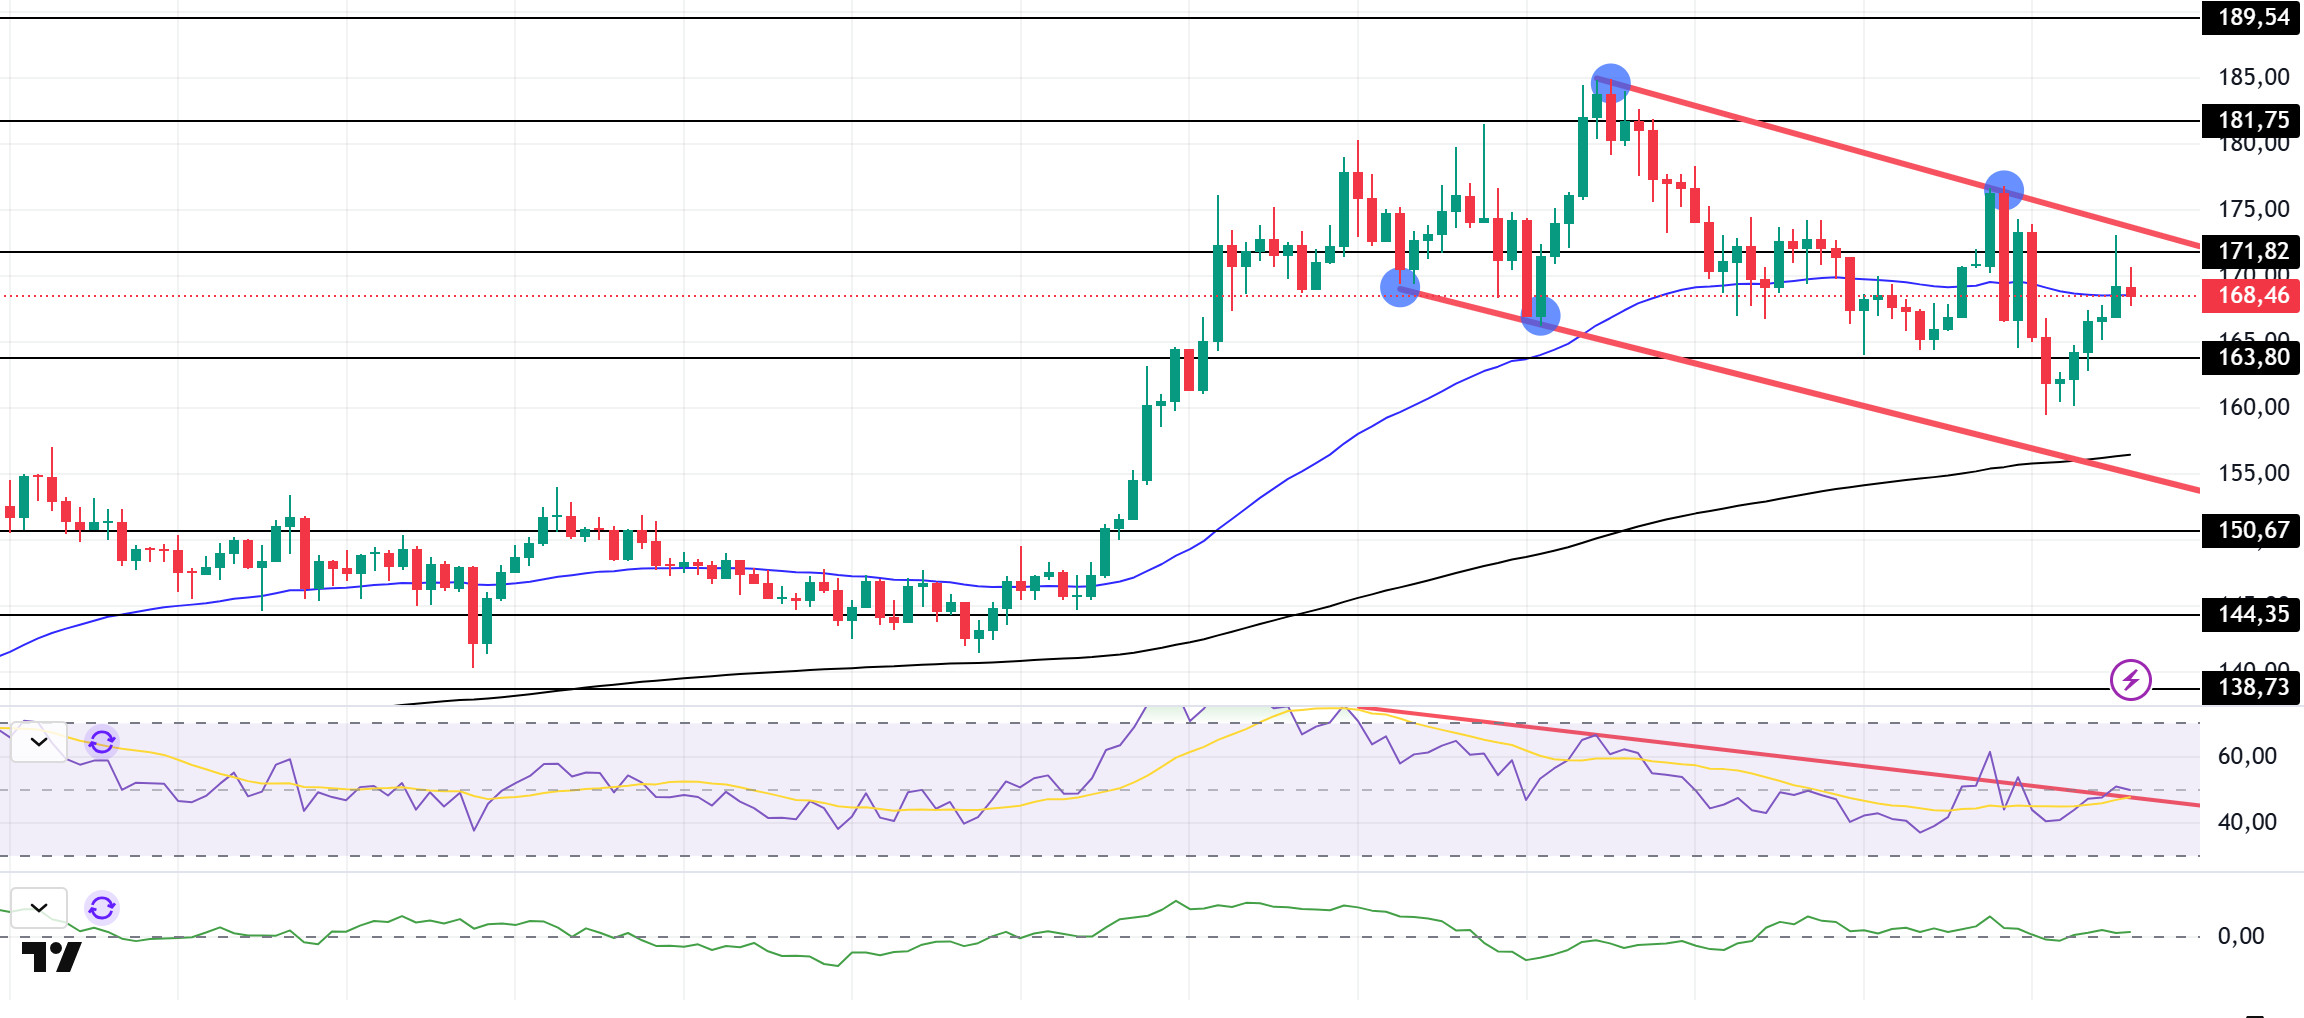
SOL price moved up, gaining about 5%. The asset remained within the downtrend that started on May 13. As of now, it hit resistance at the ceiling of the downtrend and is testing the 50 EMA (Blue Line) as support. If it breaks here, the $163.80 level could be triggered. On the 4-hour chart, the 50 EMA (Blue Line) continued to hold above the 200 EMA (Black Line). This suggests that the uptrend may continue in the medium term. Also, the fact that the price is above both moving averages suggests that the market is in a bullish trend. Chaikin Money Flow (CMF-20) crossed into positive territory; in addition, an increase in daily inflows may move CMF to the middle of the positive zone. Relative Strength Index (RSI-14), on the other hand, is at neutral level and has broken the downtrend that started on May 9 to the upside. This indicates an increase in buying pressure. The $181.75 level stands out as a strong resistance point in case of an uptrend on the back of macroeconomic data or positive news on the Solana ecosystem. If this level is broken upwards, the rise can be expected to continue. If there are pullbacks due to contrary developments or profit realizations, the $150.67 level may be retested. In case of a decline to these support levels, the increase in buying momentum may offer a potential bullish opportunity.
Supports 163.80 – 150.67 – 144.35
Resistances 171.82 – 181.75 – 189.54
DOGE/USDT
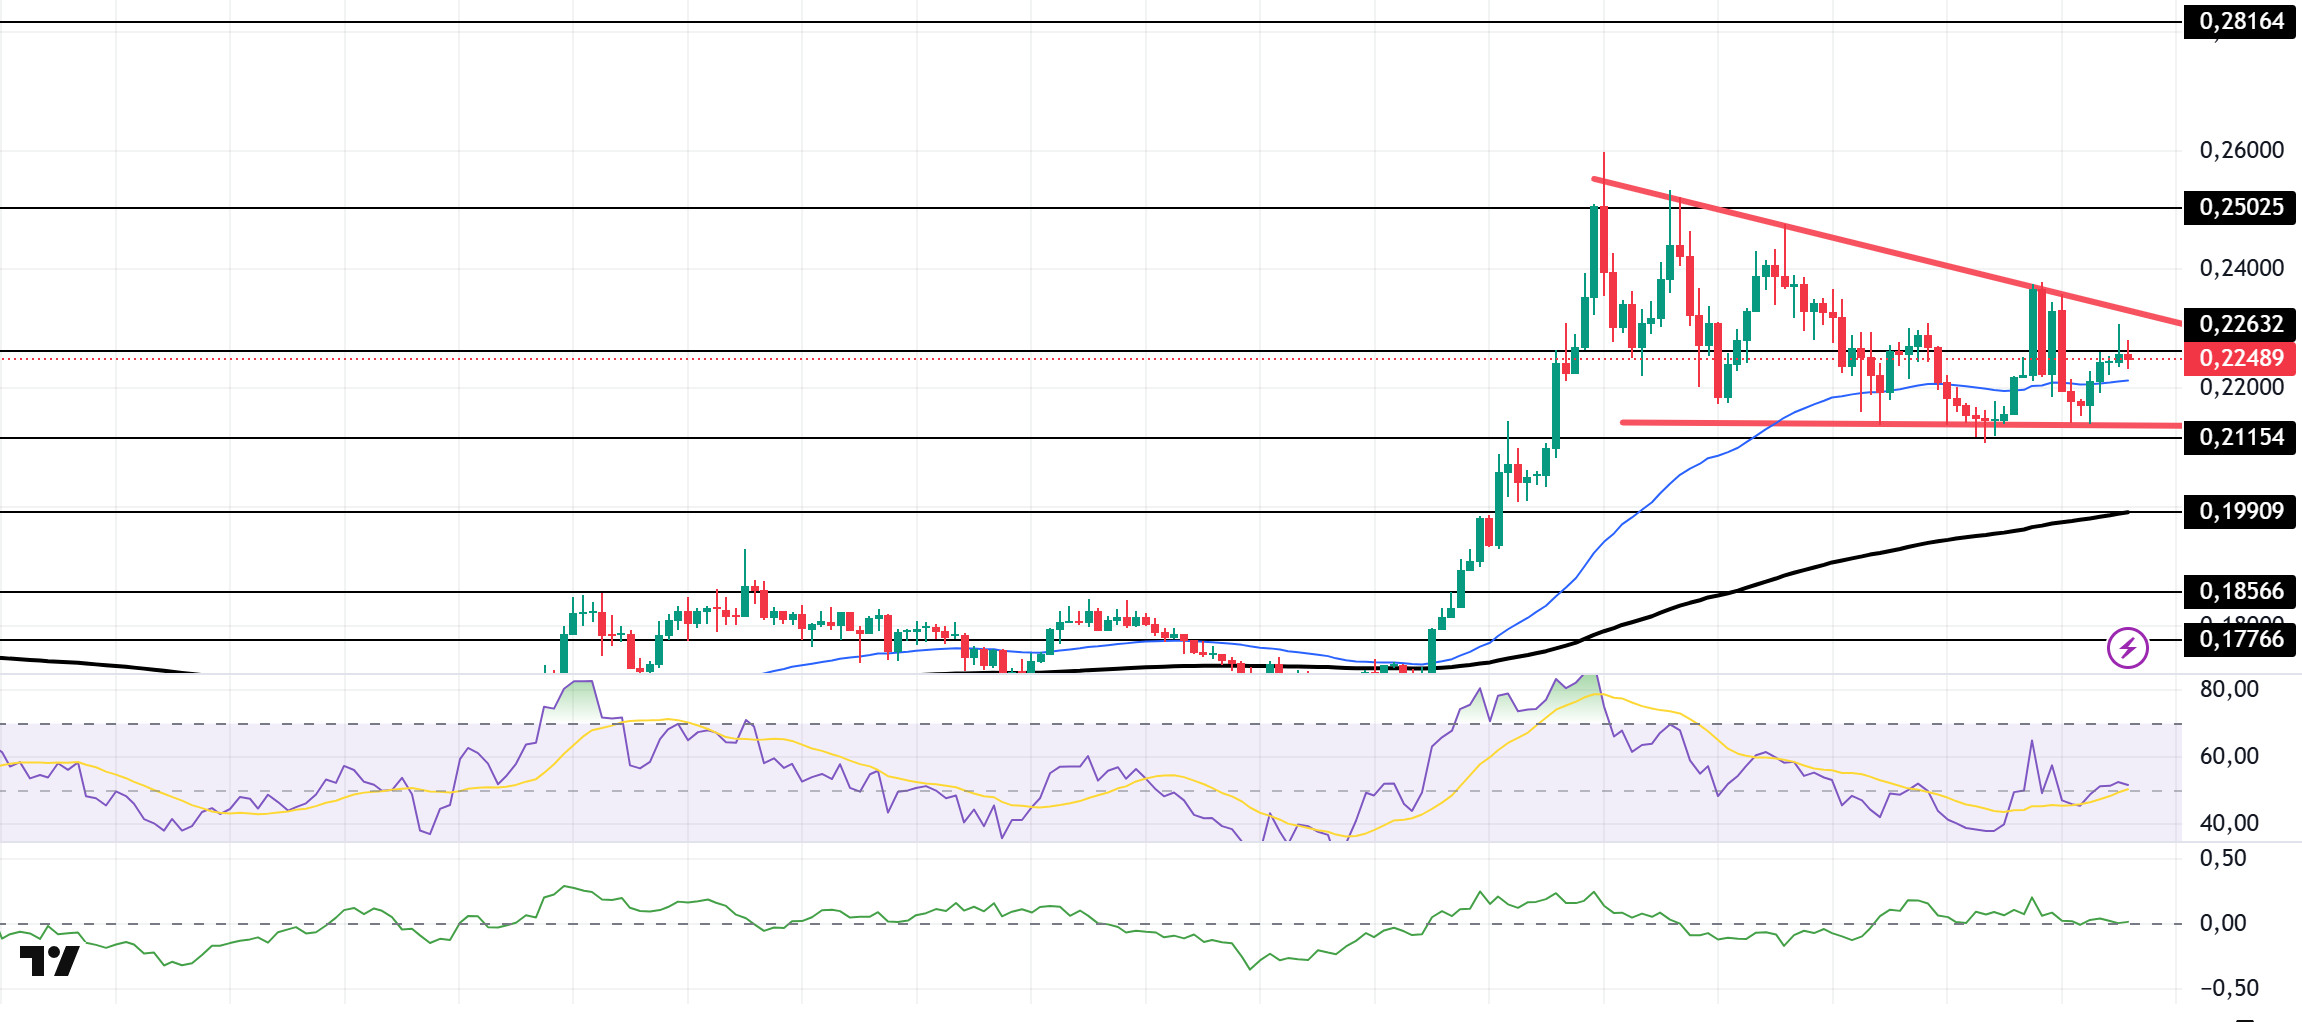
DOGE price continued its slight uptrend. The asset continued to be inside the descending triangle pattern that started on May 11. Accelerating from the base level of the descending triangle pattern, the price moved higher to be above the 50 EMA (Blue Line). It is currently preparing to test the moving average as support. On the 4-hour chart, the 50 EMA (Blue Line) continued to be above the 200 EMA (Black Line). The fact that the price is above both moving averages suggests that the asset is in a bullish phase in the short term. The Chaikin Money Flow (CMF-20) indicator is in neutral territory. In addition, a decline in money inflows may move CMF into negative territory. Relative Strength Index (RSI-14) is at a neutral level. The $0.25025 level stands out as a strong resistance zone in the case of possible rises in line with political developments, macroeconomic data or positive news flow in the DOGE ecosystem. In the opposite case or possible negative news flow, the $0.19909 level may be triggered. In case of a decline to these levels, the increase in momentum may start a new bullish wave.
Supports 0.21154 – 0.19909 – 0.18566
Resistances .22632 – 0.25025 – 0.28164
Legal Notice
The investment information, comments and recommendations contained herein do not constitute investment advice. Investment advisory services are provided individually by authorized institutions taking into account the risk and return preferences of individuals. The comments and recommendations contained herein are of a general nature. These recommendations may not be suitable for your financial situation and risk and return preferences. Therefore, making an investment decision based solely on the information contained herein may not produce results in line with your expectations.
